
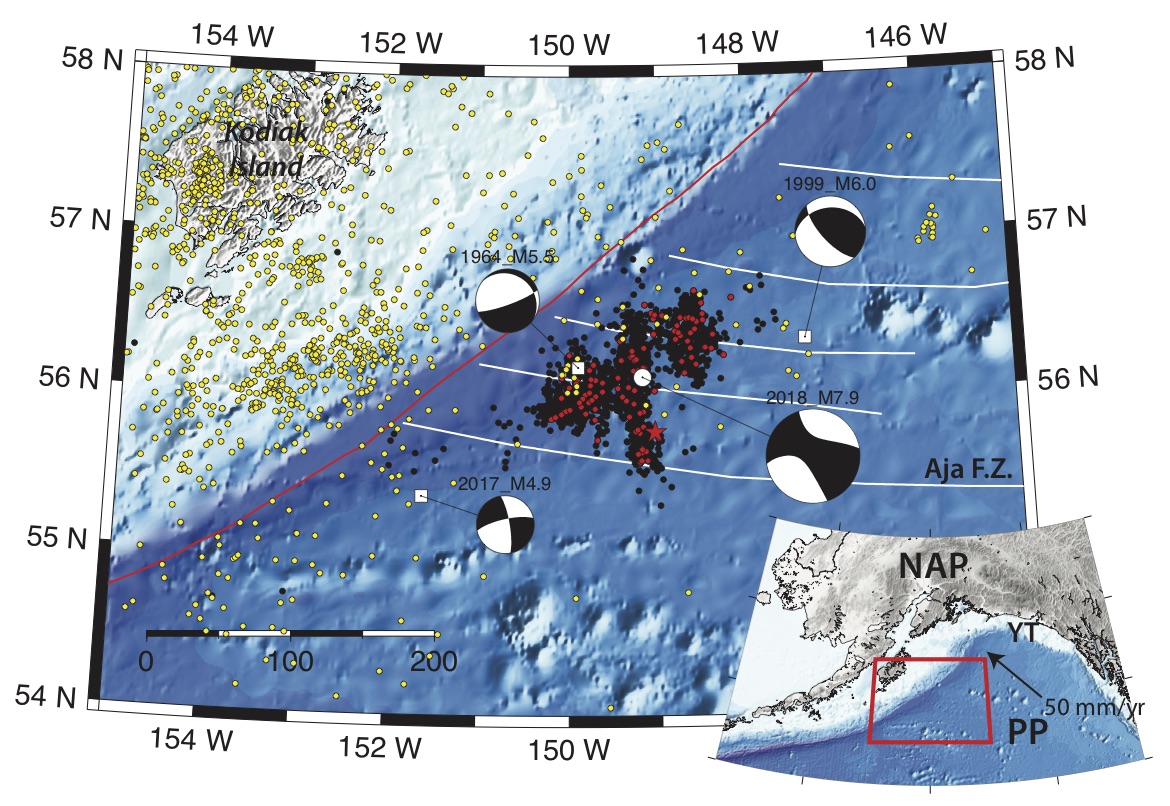


Halfway through 2018, January's magnitude 7.9 earthquake in the Gulf of Alaska remains the year's largest quake worldwide. Although its tsunami proved harmless—it was measured in inches—the Offshore Kodiak earthquake will rightly be remembered for causing evacuations in many Alaska coastal communities. It was an invaluable test of warning systems and disaster planning.
The earthquake was also important for what it can teach us about seismicity under the gulf. Because our seismic stations are on land, we miss many smaller offshore earthquakes. This means that we know far less about what goes on under the Gulf of Alaska than we know about onshore and near-shore regions.
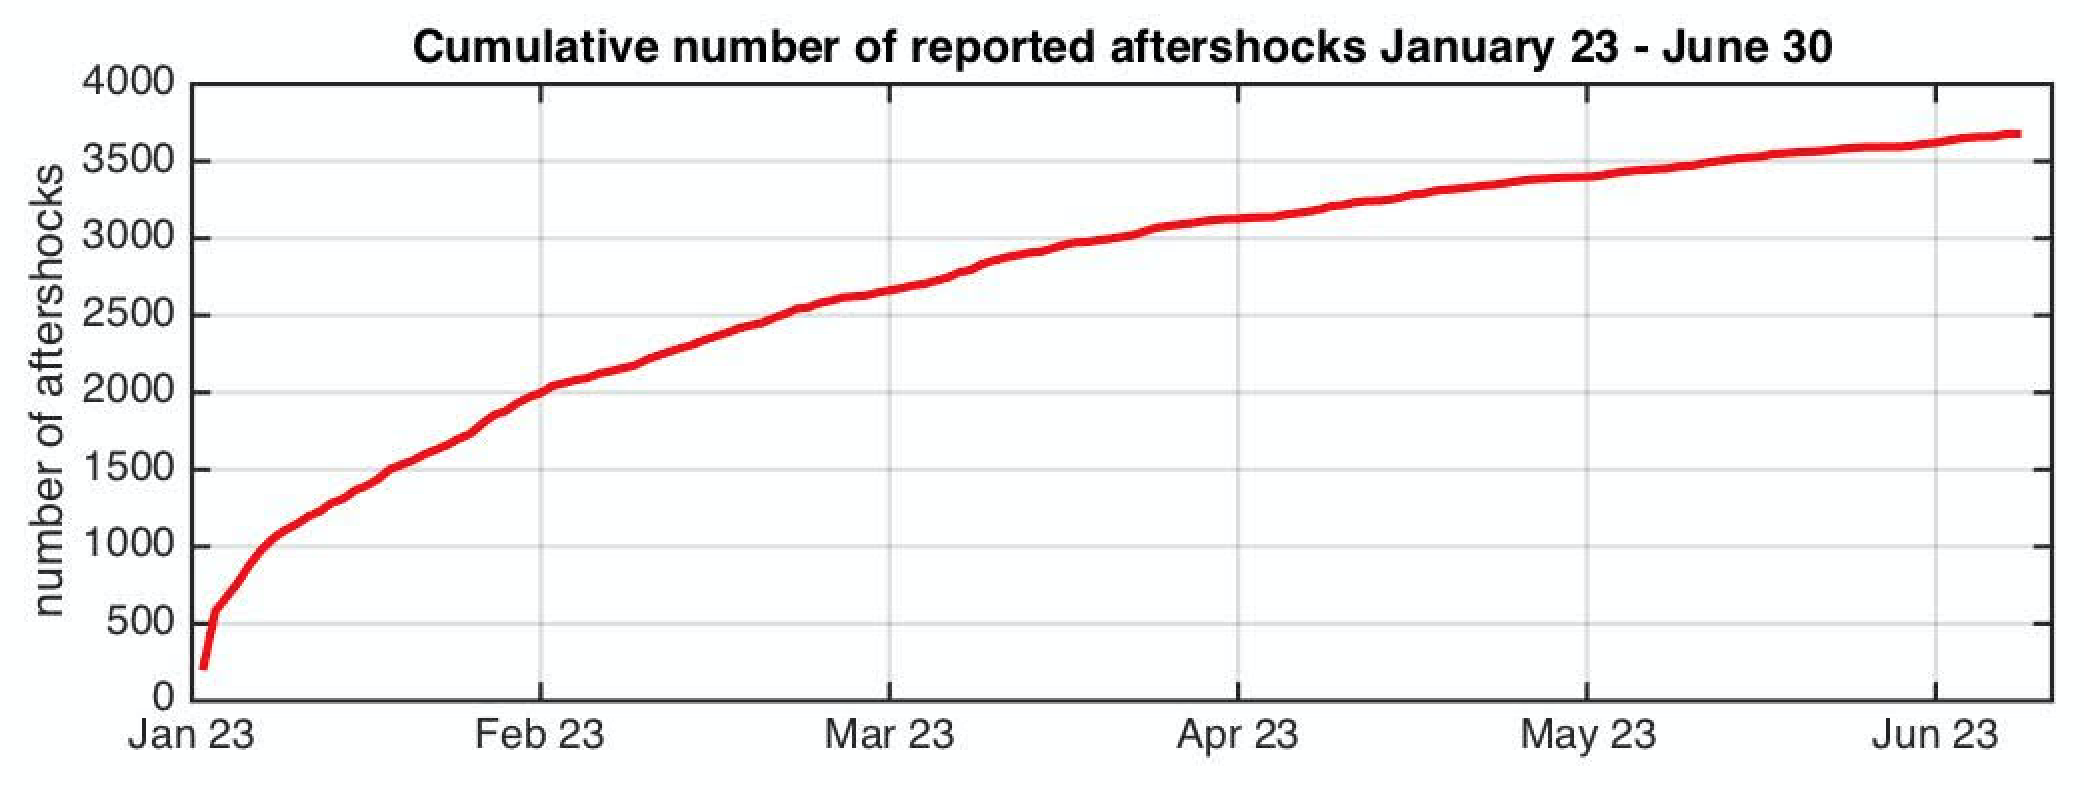
The aftershock sequence from the Offshore Kodiak earthquake should help us to unravel some of those mysteries. We recorded 225 aftershocks on the day of the earthquake. Over the first week we recorded about 150 aftershocks per day, a rate that has since slowed to six or seven aftershocks daily. Our recordings of those aftershocks can tell seismologists a lot about the earthquake and the tectonics of the area where it happened.
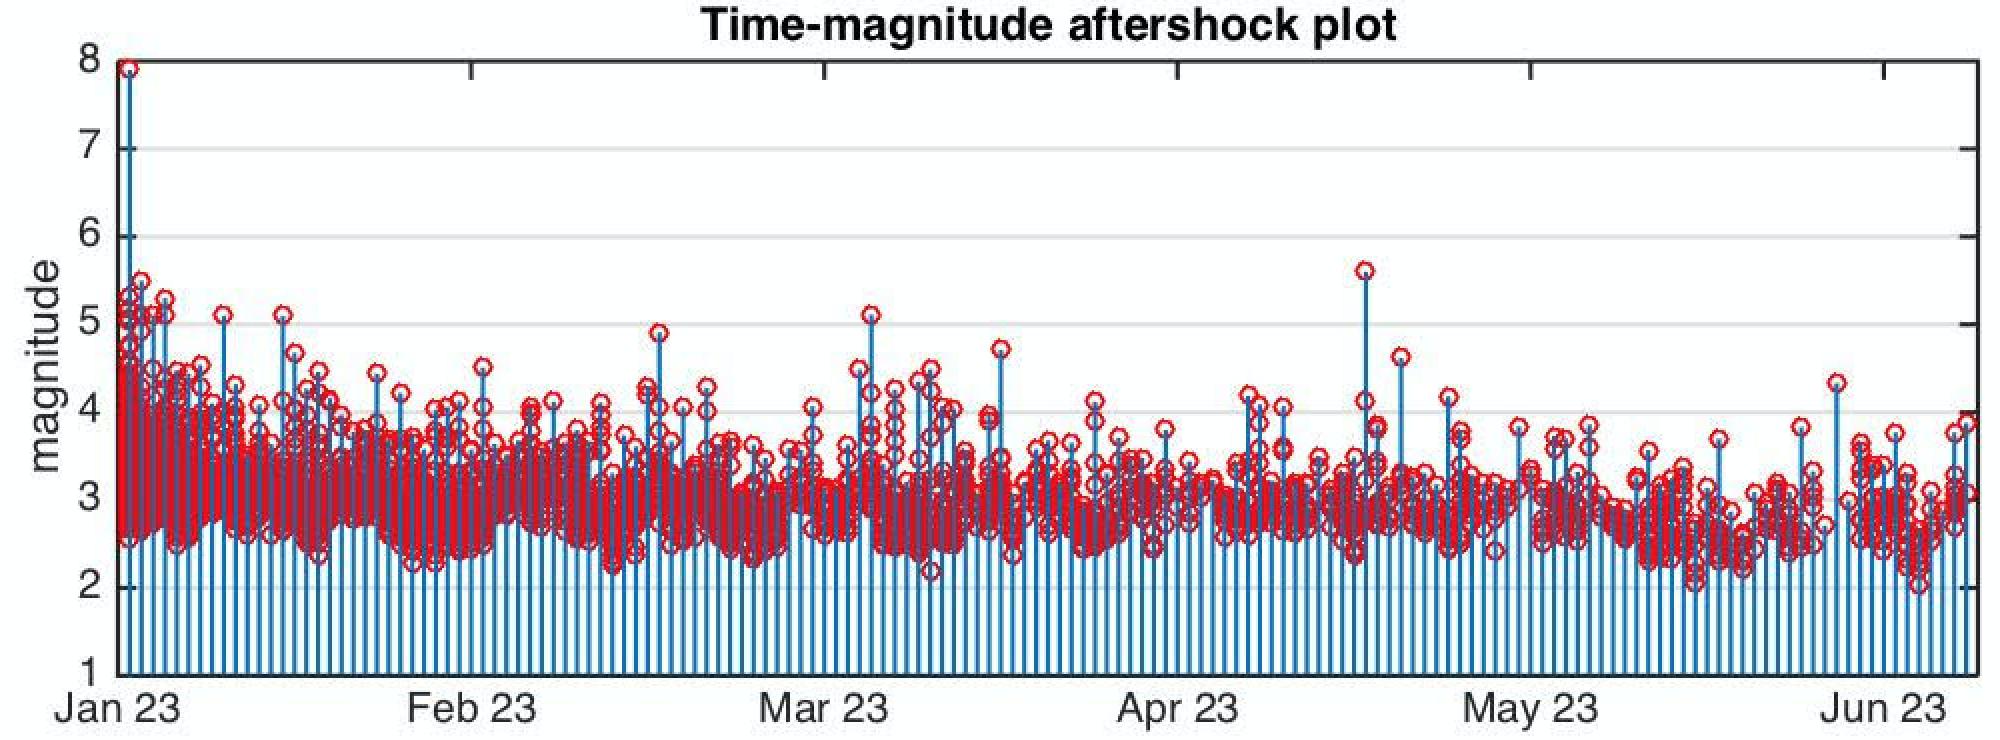
Here is where the aftershock sequence stands: Through the end of June, we’ve located 3,700 aftershocks. The largest of these were a pair of magnitude 5.5 quakes, one occurring two hours after the mainshock and the second on May 8. So far, there have been 17 aftershocks of magnitude 5 or greater and 226 of magnitude 4 or greater. It is still possible to have another large aftershock, but the likelihood of that goes down as the rate of aftershocks decreases.
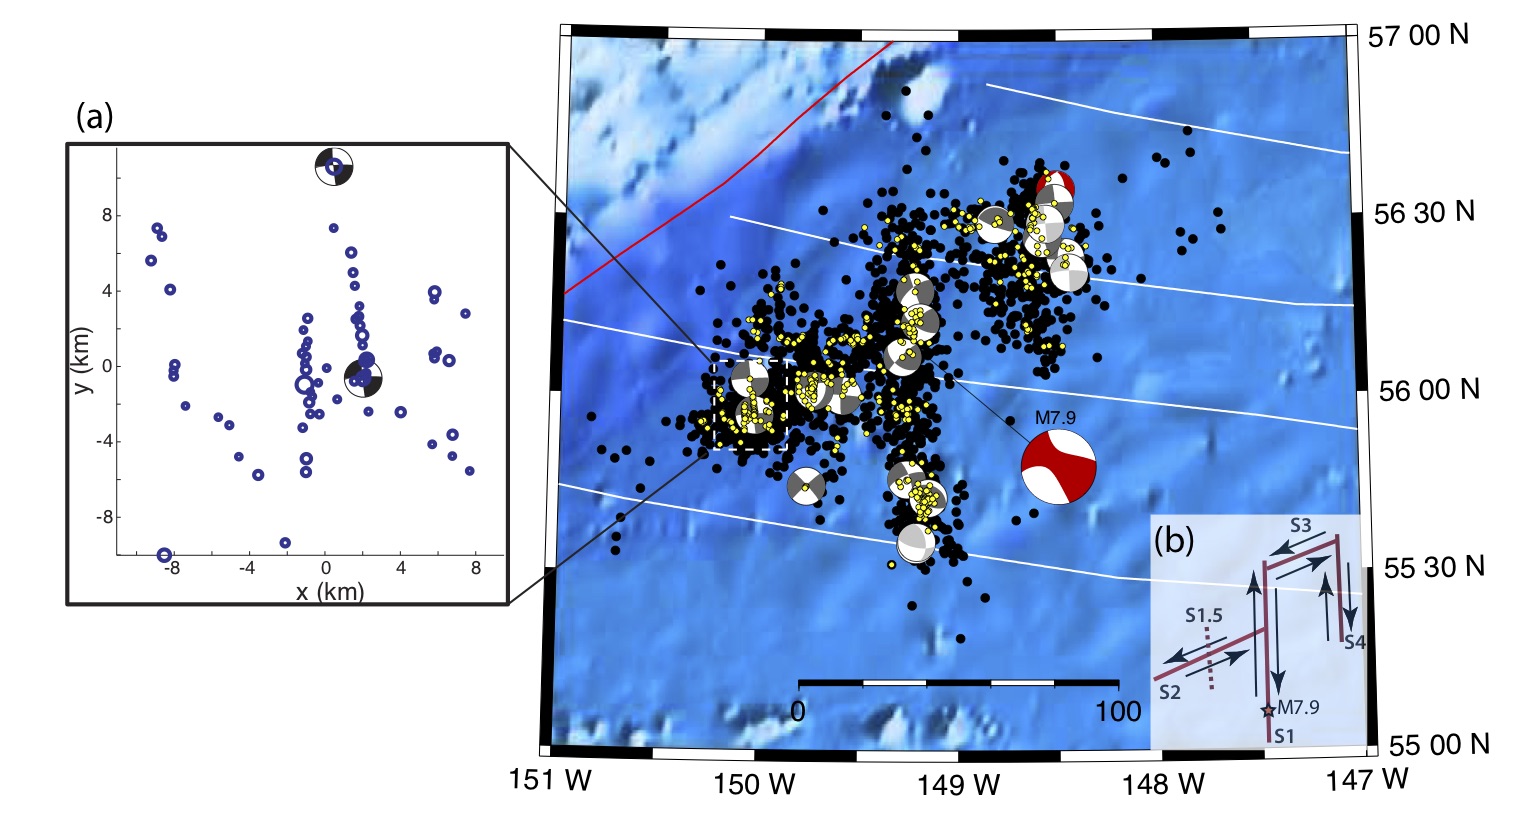
What have we learned so far? First, the earthquake was not a straightforward rupture along a single fault. This became clear soon after the quake. The entire aftershock region was active within hours, and when plotted on a map, the distribution of aftershocks looked less like a line than a cloud. Over time, this distribution has illuminated several sharp north-south and broad northeast-southwest trends. The most prominent of these is a 110-kilometer-long north-south strand with the magnitude 7.9 mainshock’s epicenter located near its southern end.
Most of the aftershocks are strike-slip earthquakes, which are caused by horizontal movement along a fault. However, some of the aftershocks show either normal or reverse faulting, which result from extensional or compressional forces, respectively. Taken together, the intersecting aftershock trends and the different types of aftershocks indicate complex faulting rather than a rupture on a single fault plane.
Seismologists have identified complex, undersea earthquakes like this before. The most recent example is the 2012 Wharton Basin sequence in the Indian Ocean, where a series of magnitude 8+ earthquakes occurred on a complex set of faults intersecting at highly oblique angles, possibly including reactivated fracture zones.
To understand the difficulties of studying these offshore ruptures, consider the 2002 Denali Fault earthquake. Like Offshore Kodiak, it was a shallow magnitude 7.9 strike-slip earthquake. Unlike Offshore Kodiak, it happened on land, in an area that already had many seismic stations. Soon after the earthquake, we were able to rapidly install many more stations to better record the aftershocks. In the first five months after Offshore Kodiak, we recorded 3,600 aftershocks with the smallest recorded aftershocks being around magnitude 2.5. In the first five months after the Denali Fault earthquake, we recorded 24,000, but for that sequence we recorded aftershocks down to magnitude 1 and lower. The Offshore Kodiak aftershocks are simply more difficult for our analysts to process because they are happening so much farther from our seismic stations.
Still, we are far from done collecting new information about Offshore Kodiak. The rate may be slowing, but we expect to continue recording aftershocks from this earthquake for years if not decades to come.