


For two weeks in July I was onboard the Research Vessel Sikuliaq as an apply-to-sail participant of the Alaska Amphibious Community Seismic Experiment (AACSE). AACSE is a broadband seismic array designed to investigate the subduction zone structure and seismicity across the Alaska Peninsula. In July we deployed 30 of the project’s planned 75 ocean bottom seismometers (the other 45 were deployed in May on a 3-week long cruise). The entire array covers an approximately 650 km along-strike segment of the subduction zone, including the Alaska Peninsula and Kodiak Island. It reaches about 250 km seaward of the trench, extending offshore the existing seismic network in the region. The project also includes a land component consisting of an additional 30 temporary seismometers densifying the existing network and making this array shore-crossing.
Despite being familiar with the general principles of ocean bottom seismic (OBS) deployments, this was a great learning experience for me. First of all, great care has to be taken in designing the sensor packages so that they would be able to function autonomously for many months. Because data from the sensors can not be retrieved in real-time, the quality of the data will not be known until the OBS is retrieved. Any failure would result in unrecoverable loss of data and possibly loss of the valuable equipment. The OBS engineers have to design a system that would withstand water pressure, currents, trolling by fishing vessels, have enough power to last for the desired length of time and respond to remote commands for deployment and retrieval. With the help of a special deployment arm and special gyros, the seismic sensor is able to position itself upright on the ocean floor. This is important, because if the sensor lands upside down or on its side, the data would be useless.
Secondly, a special procedure has to be followed while each OBS is deployed. As we sail towards each deployment site, we must study the bathymetry (seafloor profile) of the proposed location. We don’t want to see any sudden changes in elevation, we aim for flat or gently sloping seafloor.
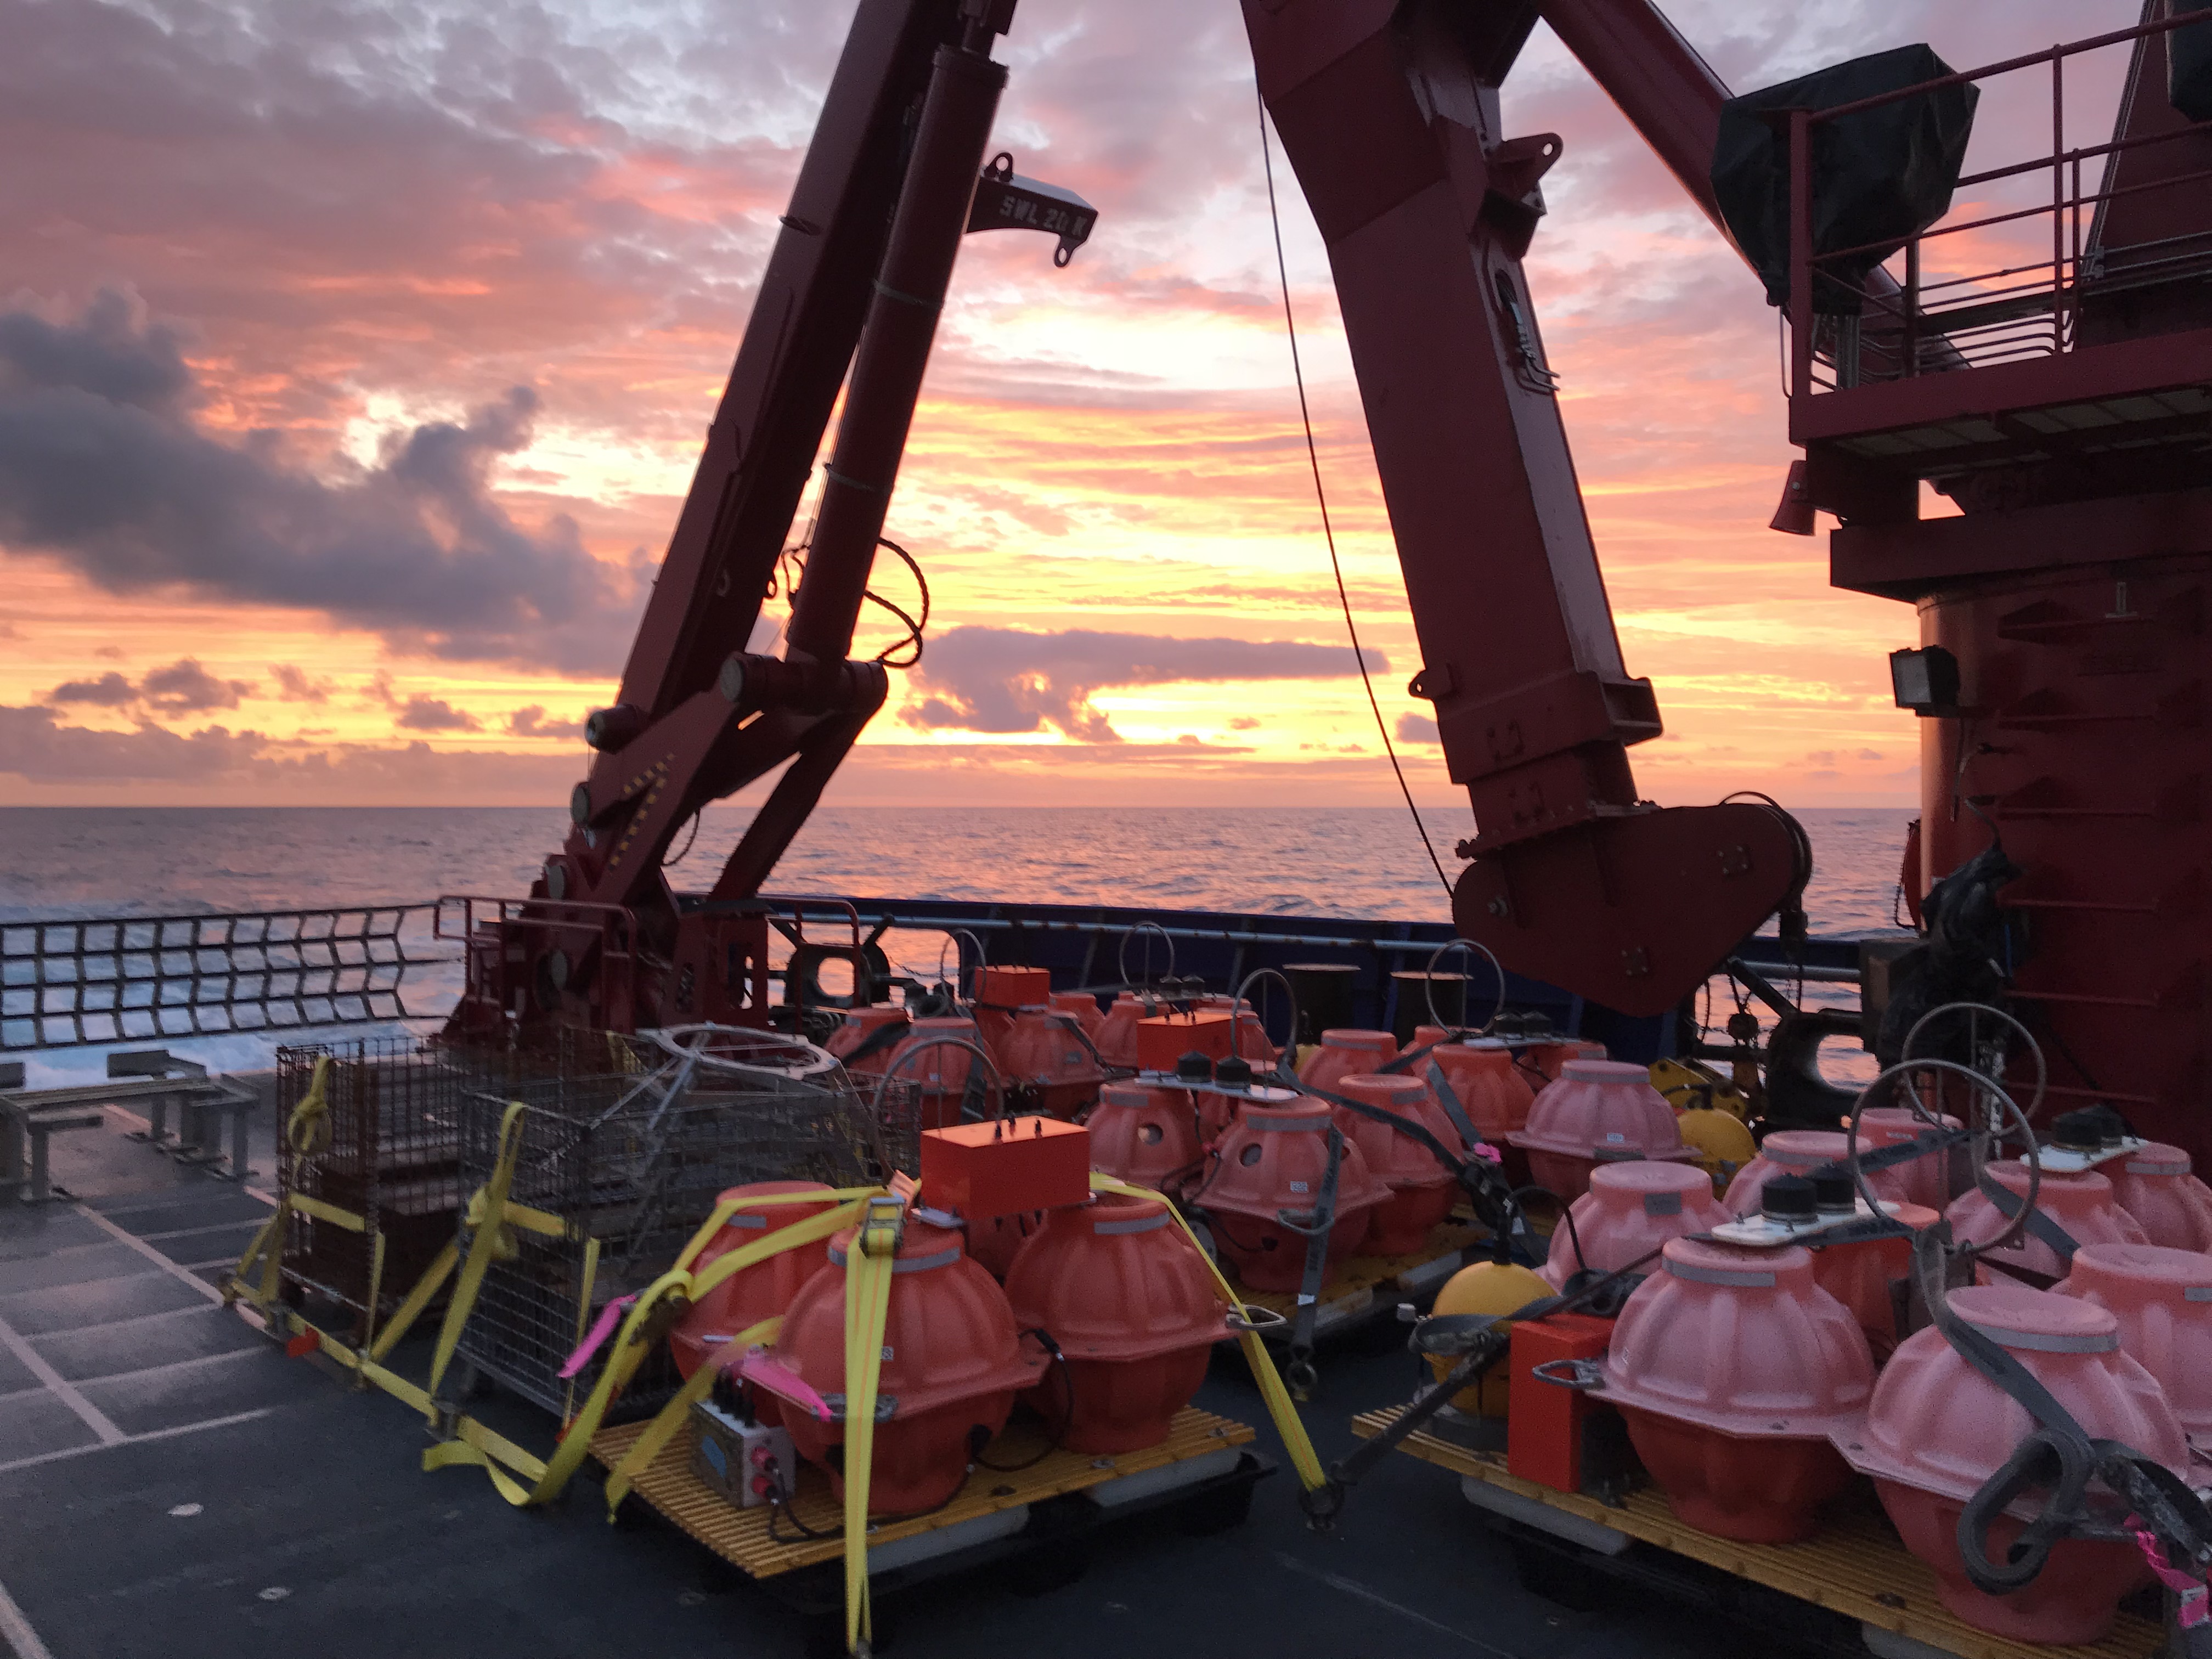
While each station is already packaged on its own platform and sitting on the deck ready to be deployed, there are still many tasks that the OBS engineers have to complete before sending the package away. About an hour before we reach the site, the final assembly tasks begin: attaching the broadband sensor onto the ready rack, mounting release rods, securing ballast to the station frame, attaching and activating strobe lights, radio beacons, performing last minute tests of the equipment, making sure that all components are securely attached with zip-ties, bolts, etc.
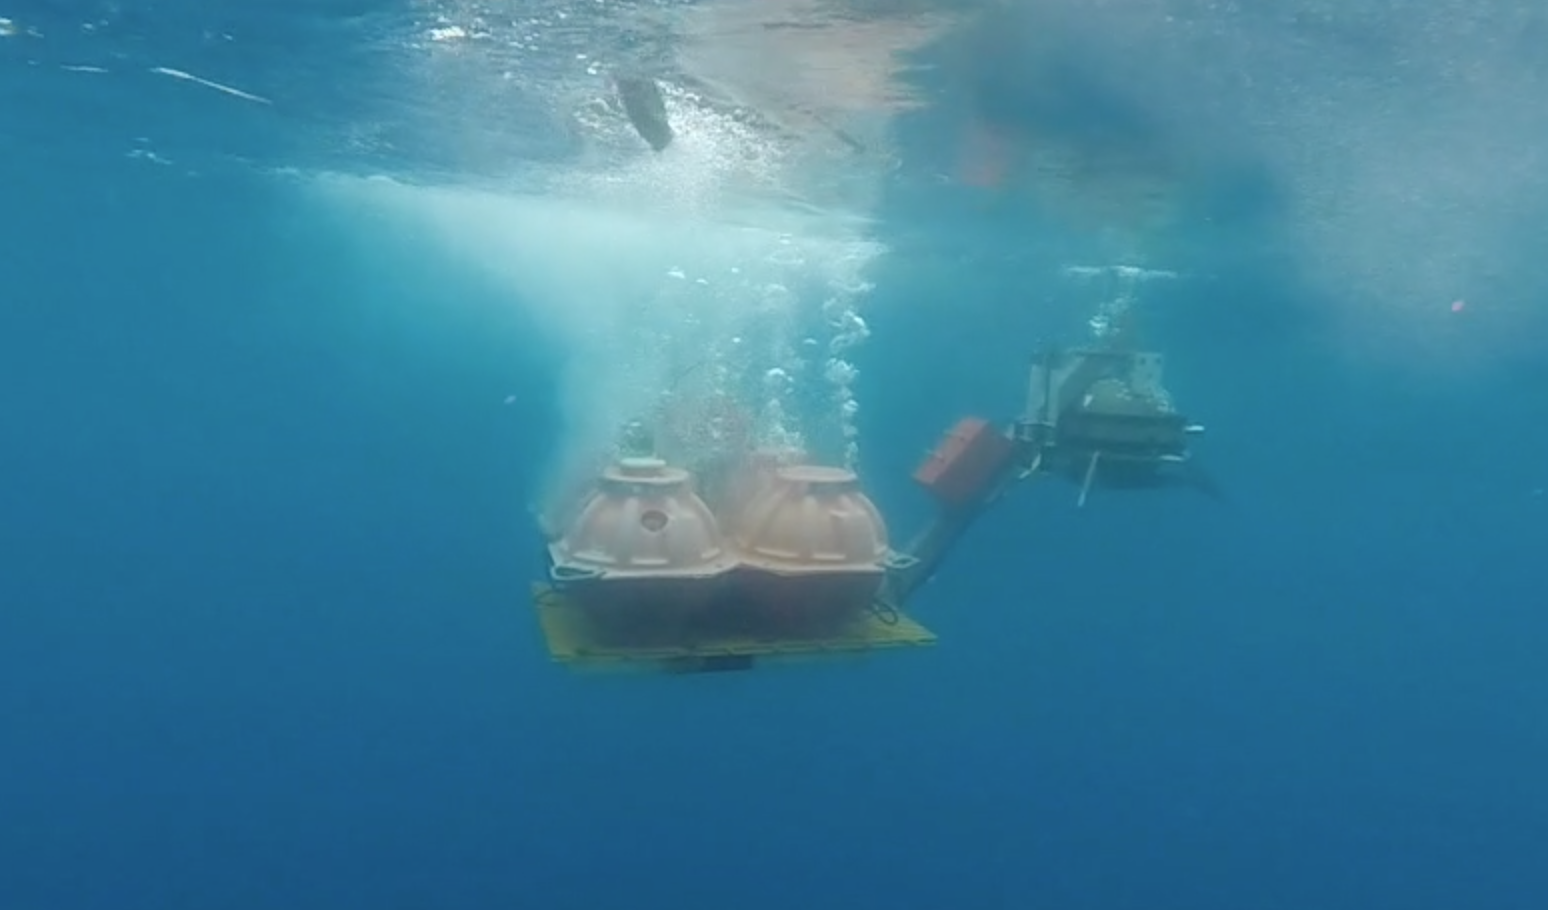
Once the package is ready and the bridge gives the go-ahead, the package is carefully lifted with the crane, guided with the tag lines and gently lowered into the water.
In a meantime, the science watch party takes pictures and detailed notes on the location, time, depth and weather conditions during the deployment, as well as any other pertinent information. As soon as the OBS crew reports that the package is away, the science crew activates transponders on the instrument and starts an algorithm to track the package as it sinks toward the ocean bottom. Depending on the depth of ocean floor, it can take up to 2 hours for the package to come to rest on the bottom (it sinks with an average rate of 44 m/min, our deepest OBS was deployed at 5,300 m depth). All this time the vessel is being maneuvered to remain stationary on top of the deployment site. We don’t want to drift too far before the package reaches the ocean floor.
Once the package reaches the bottom, the science crew springs into action once again. It’s time to do the survey! They activate a pinging sequence, where an acoustic signal is sent out to the OBS and bounced back to the ship, and fire up a program that will use the pinging sequence to triangulate an accurate location of the sensor. The Chief Scientist will give directions to the bridge on how to navigate for the survey. Depending on the conditions, we may do a circle around the sensor’s resting place, or a square, or some other pattern to make sure we get enough pings around the site. It’s a careful balance between frequency of the pings (not too many, not too few), ship speed (somewhere between 4-5 knots), distance to the sensor (about half-ocean depth, but not more than 1.5 nm) and wave action (works best in calm seas). And again, the science party listens attentively to the pings and tracks the location of the sensor, adjusting parameters along the way. Once we get enough pings, we wrap up the calibration sequence, record final details and call the bridge to start navigating to the next site. All in all, we may spend 3-4 hours at each site working through the deployment sequence.
We repeated this sequence at each site, no matter time of the day. There was always someone on watch. Prep, drop, track, survey, sail, repeat…
In the end, we were ahead of schedule and had about 36 extra hours left to do some bonus work. We decided to sail over the source region of the January 23, 2018 M7.9 Offshore Kodiak earthquake and collect high resolution bathymetry. The earthquake struck ~300 km offshore Kodiak Island in the outer rise region of the Alaska-Aleutian subduction zone. It triggered tsunami warnings and prompted evacuations of thousands of people in Alaskan coastal communities. While the source parameters for the earthquake indicated strike-slip faulting, the true complexity of the source has only become evident through analysis of multiple datasets. At least 4 conjugate strike-slip faults were involved in the earthquake rupture. However, distant location of the aftershock source region to the land-based stations made the data analysis and interpretation difficult. During the bathymetry survey we searched for faults that could have been activated during the earthquake. While the data was somewhat inconclusive, we were still able to identify several N-S trending fault structures.
Next summer all sensors will be retrieved and the data uploaded to the public data center where it can be accessed by the researchers. Data from the array can be used to evaluate variations in incoming Pacific plate structure, densely sample the Aleutian Megathrust as earthquake energy passes through it and is recorded on the OBS, and even extend across the volcanic arc to image the deep volcanic systems. We at the Alaska Earthquake Center are looking forward to being able to use this data to better understand the structure of the faults that ruptured in the 2018 Offshore Kodiak earthquake.