


The recent nuclear test in North Korea presents a quandary for seismologists. The political posturing and global tension these events create is significant. And yet scientifically, they are fascinating. The world community has considerable systems in place to track and assess nuclear explosions. These include a variety of geophysical sensor networks, plus the more clandestine tools undoubtedly in use behind the scenes. But we do not often get to test these systems on “real” data. The North Korean nuclear test is one of these regrettable, but opportune, moments.
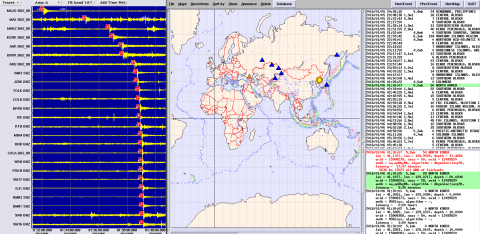
It is interesting to watch the news unfold around this story. For anyone familiar with the data, there is simply no debate over whether or not this was an explosion. Here in Alaska, our detection system picked up the event and pegged the magnitude at M5.3 nine minutes after it occurred---not bad for an automated system that is primarily tuned for activity here in Alaska (see screenshot). However it is also a testament to how “easy” it is to see the signals from nuclear explosions that are not masked. Explosions have a unique character that creates waveforms rich in high-frequency P-waves, but deficient in shear and surface waves.
The real questions now surround the yield of the explosion and what type of nuclear reaction – fission or fusion – created it. This is expertise I will leave for others. There are no doubt countless scientists squirreled away in classified settings poring over a broad set of observations to address this. But even a quick glance at the seismic waves reveals some pretty telling features. First off, M5.1 is suspiciously similar to the size of the previous test in 2013, also measured at M5.1. If this most recent explosion was a different type of reaction, then either is was oddly the same yield (estimated at 6-9 kilotons in 2013), or it was detonated in a such a way that it coupled very poorly into the surrounding earth. The latter would be a massive technological feat that, though not my expertise, seems unlikely.
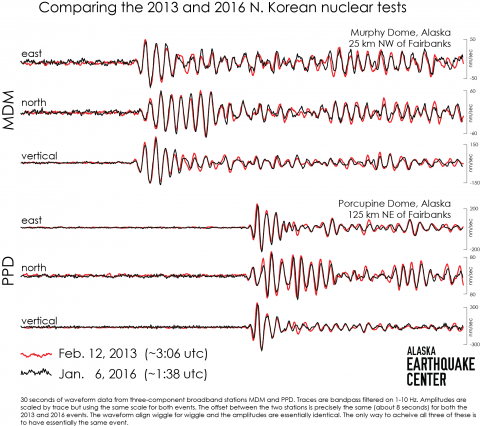
More interesting to me is the comparison of seismic waveforms between the 2013 and 2016 events. The second figure compares seismograms recorded at two stations not far from where I am sitting. These illustrate how remarkably similar the two presumed nuclear tests are. The traces align wiggle for wiggle, have almost exactly the same amplitudes, and the offset between the two stations is the same (about 8 seconds). This offset represents the different amount of time it takes to reach each station. These observations can only be achieved by having essentially the same explosion, with the same amount of radiated energy, in the same place. I expect a lot more nuance to come out through the media in the coming days. But I don’t see these basic facts changing.
The figures are bit small on this post. I posted them on Facebook for easier viewing. (We're still working out the kinks in the new web site!)