
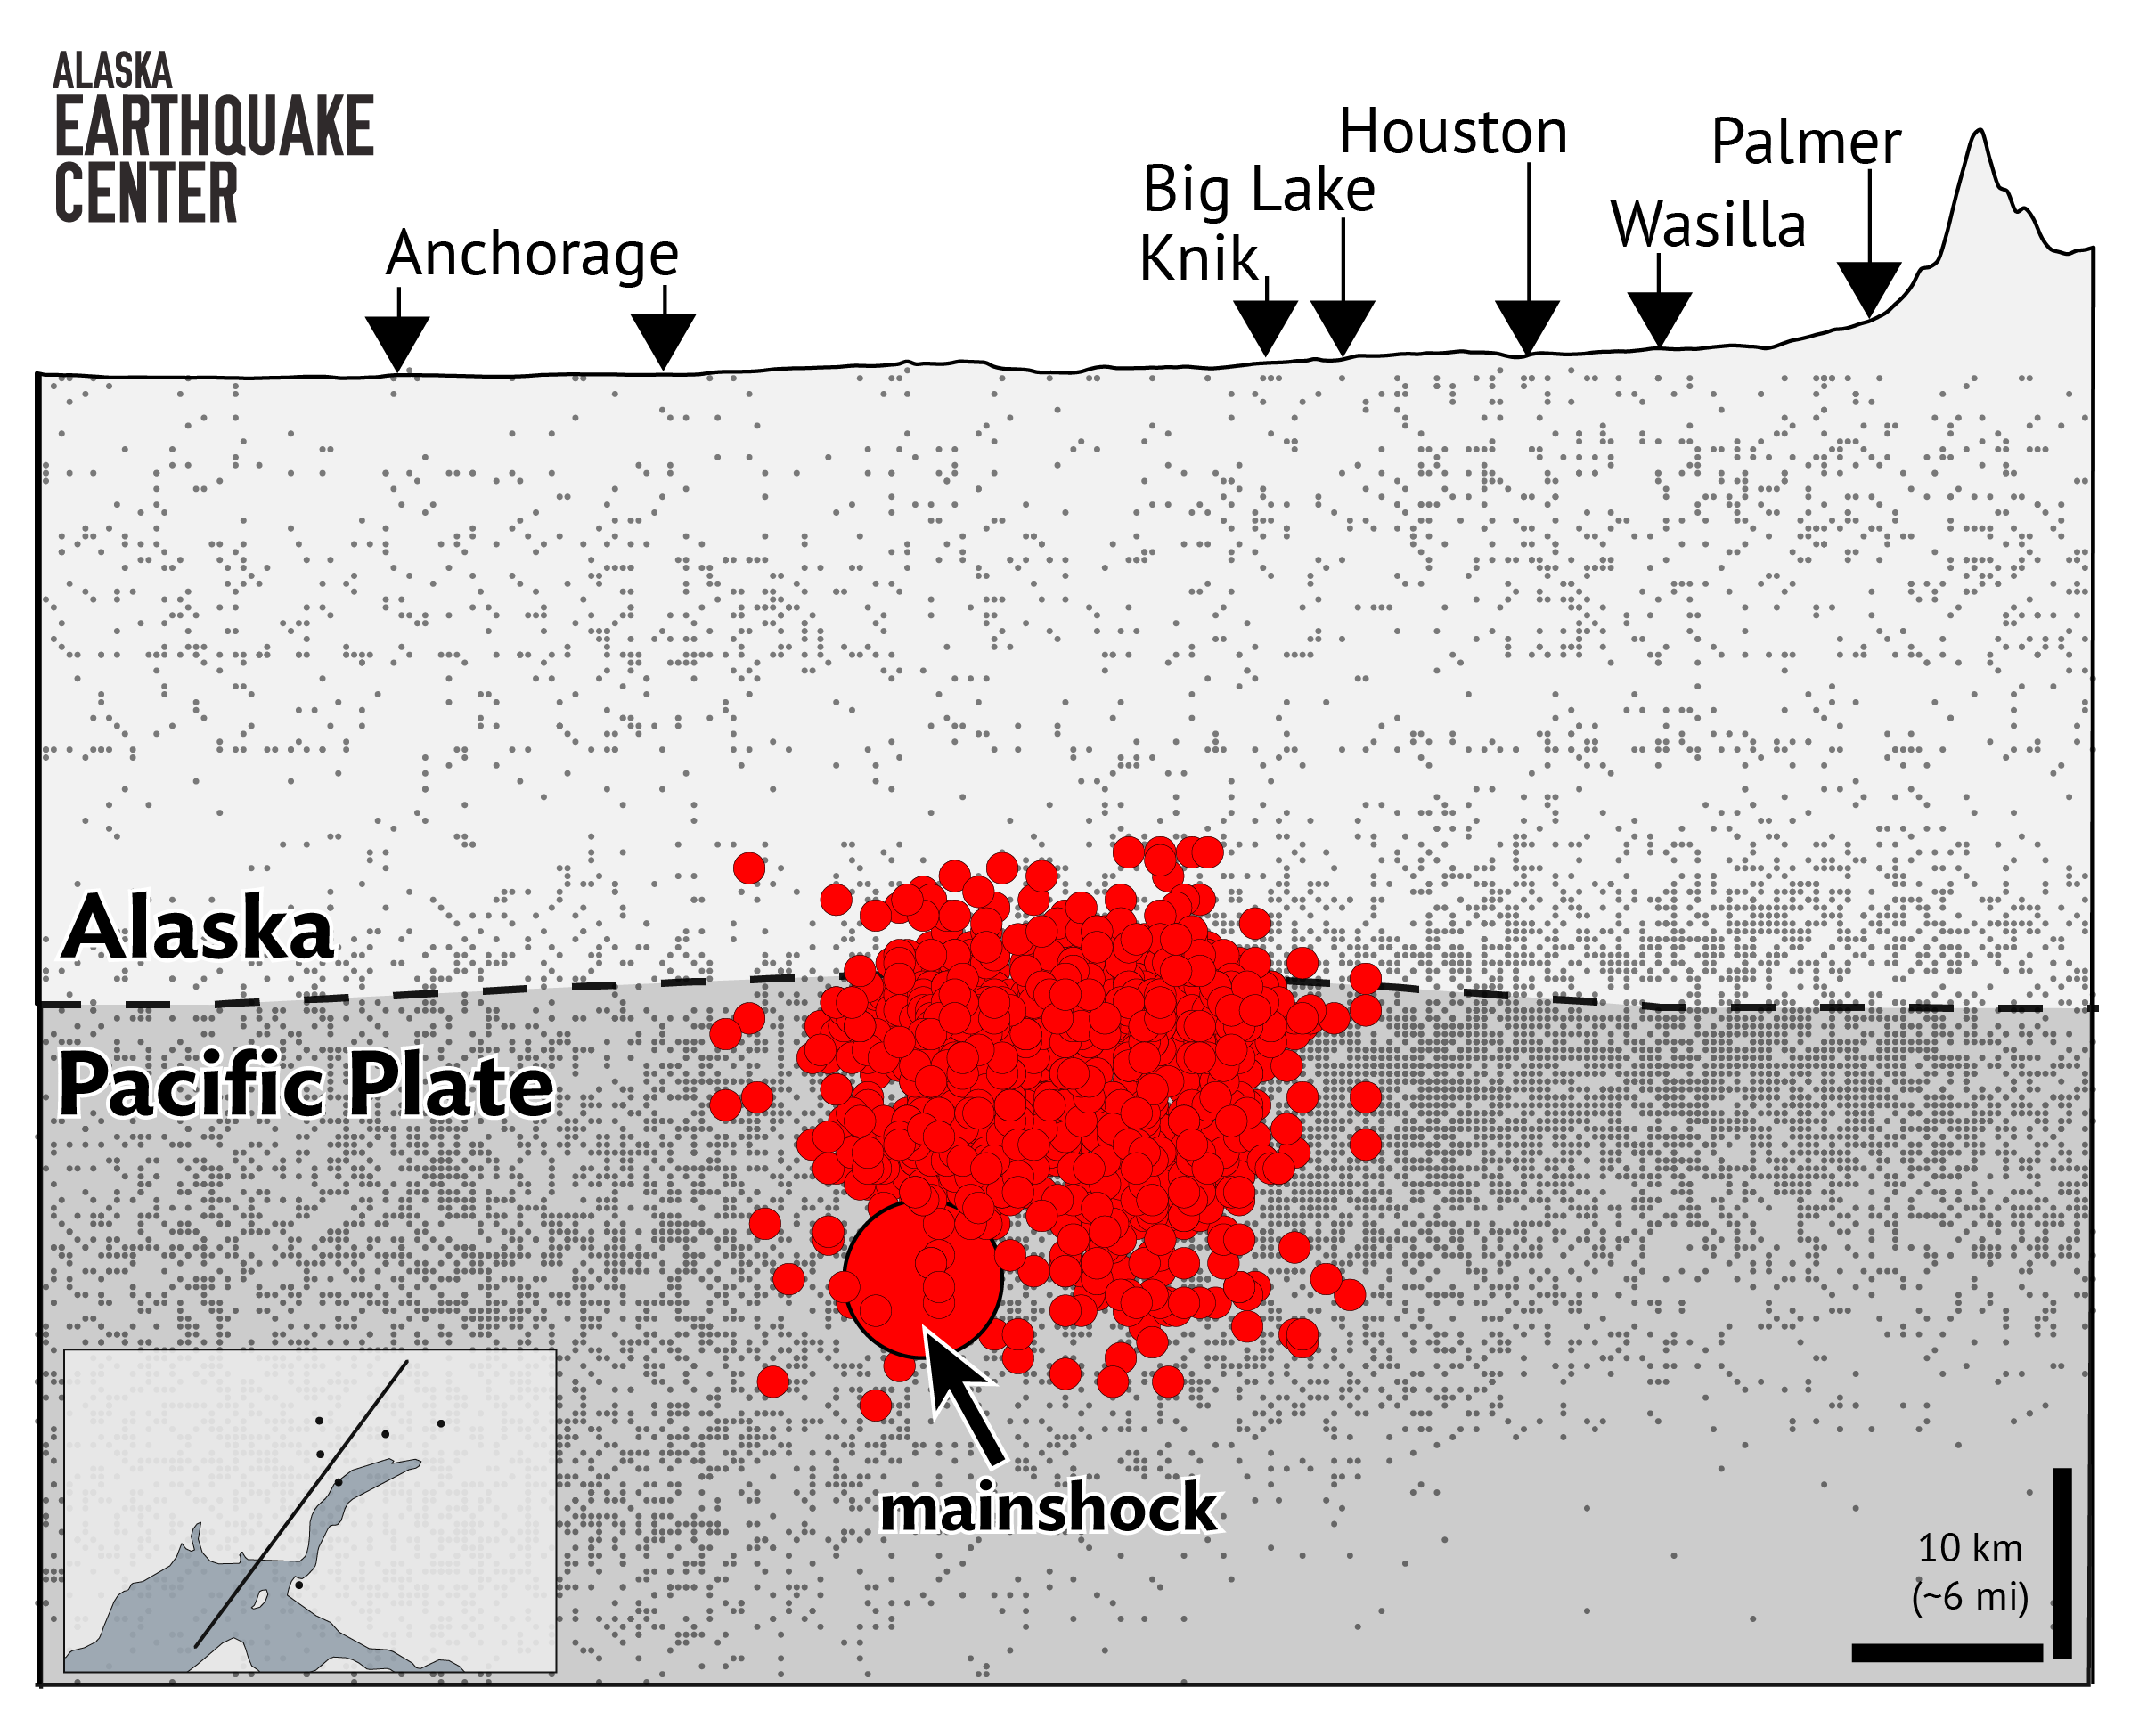


Here is a cross-section through Friday’s earthquake and subsequent aftershocks. The mainshock symbol marks where the M7.1 earthquake began. The cloud of aftershocks show, very approximately, the region of the fault that actually ruptured during the quake (black dots mark historical earthquakes). We call this the “rupture patch”. The aftershocks suggest that the rupture patch was about 15-25 miles across. They also demonstrate that the earthquake occurred inside the Pacific tectonic plate that is being pulled under Alaska, and that the earthquake began deep and proceeded to rupture upward and to the north. The rupture appears to have made it all the way to the top of the Pacific Plate---what was once the seafloor.
On a map, this earthquake looks like it occurred 5-10 miles north of Anchorage. But the cross-section illustrates that it is more appropriate to say the earthquake occurred deep underneath Anchorage. The same goes for the Mat-Su Valley. It is clear from the cross-section that much of the Mat-Su Valley and Anchorage were, roughly speaking, the same distance from the earthquake. That is why similar levels of shaking were observed across the region.
Most of these aftershock locations are preliminary. The view of the earthquake that they provide will become more clear as each of the aftershocks is reviewed and updated by a seismologist. Stay tuned ...
Note: On March 8, we revised the magnitude of the November 30 Anchorage earthquake upward, from 7.0 to 7.1. This piece has been edited to reflect that revision.