


On October 19, 2020 a magnitude 7.6 earthquake shook the ground in the vicinity of the July 22, 2020 M7.8 Simeonof earthquake aftershock region (Figure 1). While its location and timing were not surprising, its large magnitude raised some questions about nature of the aftershocks. Based on observations of thousands of aftershock sequences around the globe, seismologists have observed some basic trends and summarized rules for their behavior. One such rule states that the largest aftershock is usually an order magnitude smaller than the mainshock. Each rule, however, has an exception, and it seems that the M7.6 falls within the “exception” category.
Aftershocks are a normal and expected follow up to any significant earthquake. They occur in response to stress changes on and around the main rupture and may continue for weeks, months and even years depending on the size and type of a ruptured fault. They do eventually die out when conditions on the fault return to a normal steady state behavior. The aftershocks are not just smaller copies of the main event, however. They often occur on nearby faults that get perturbed by the shifting of the main fault surface and changing the stresses around them.
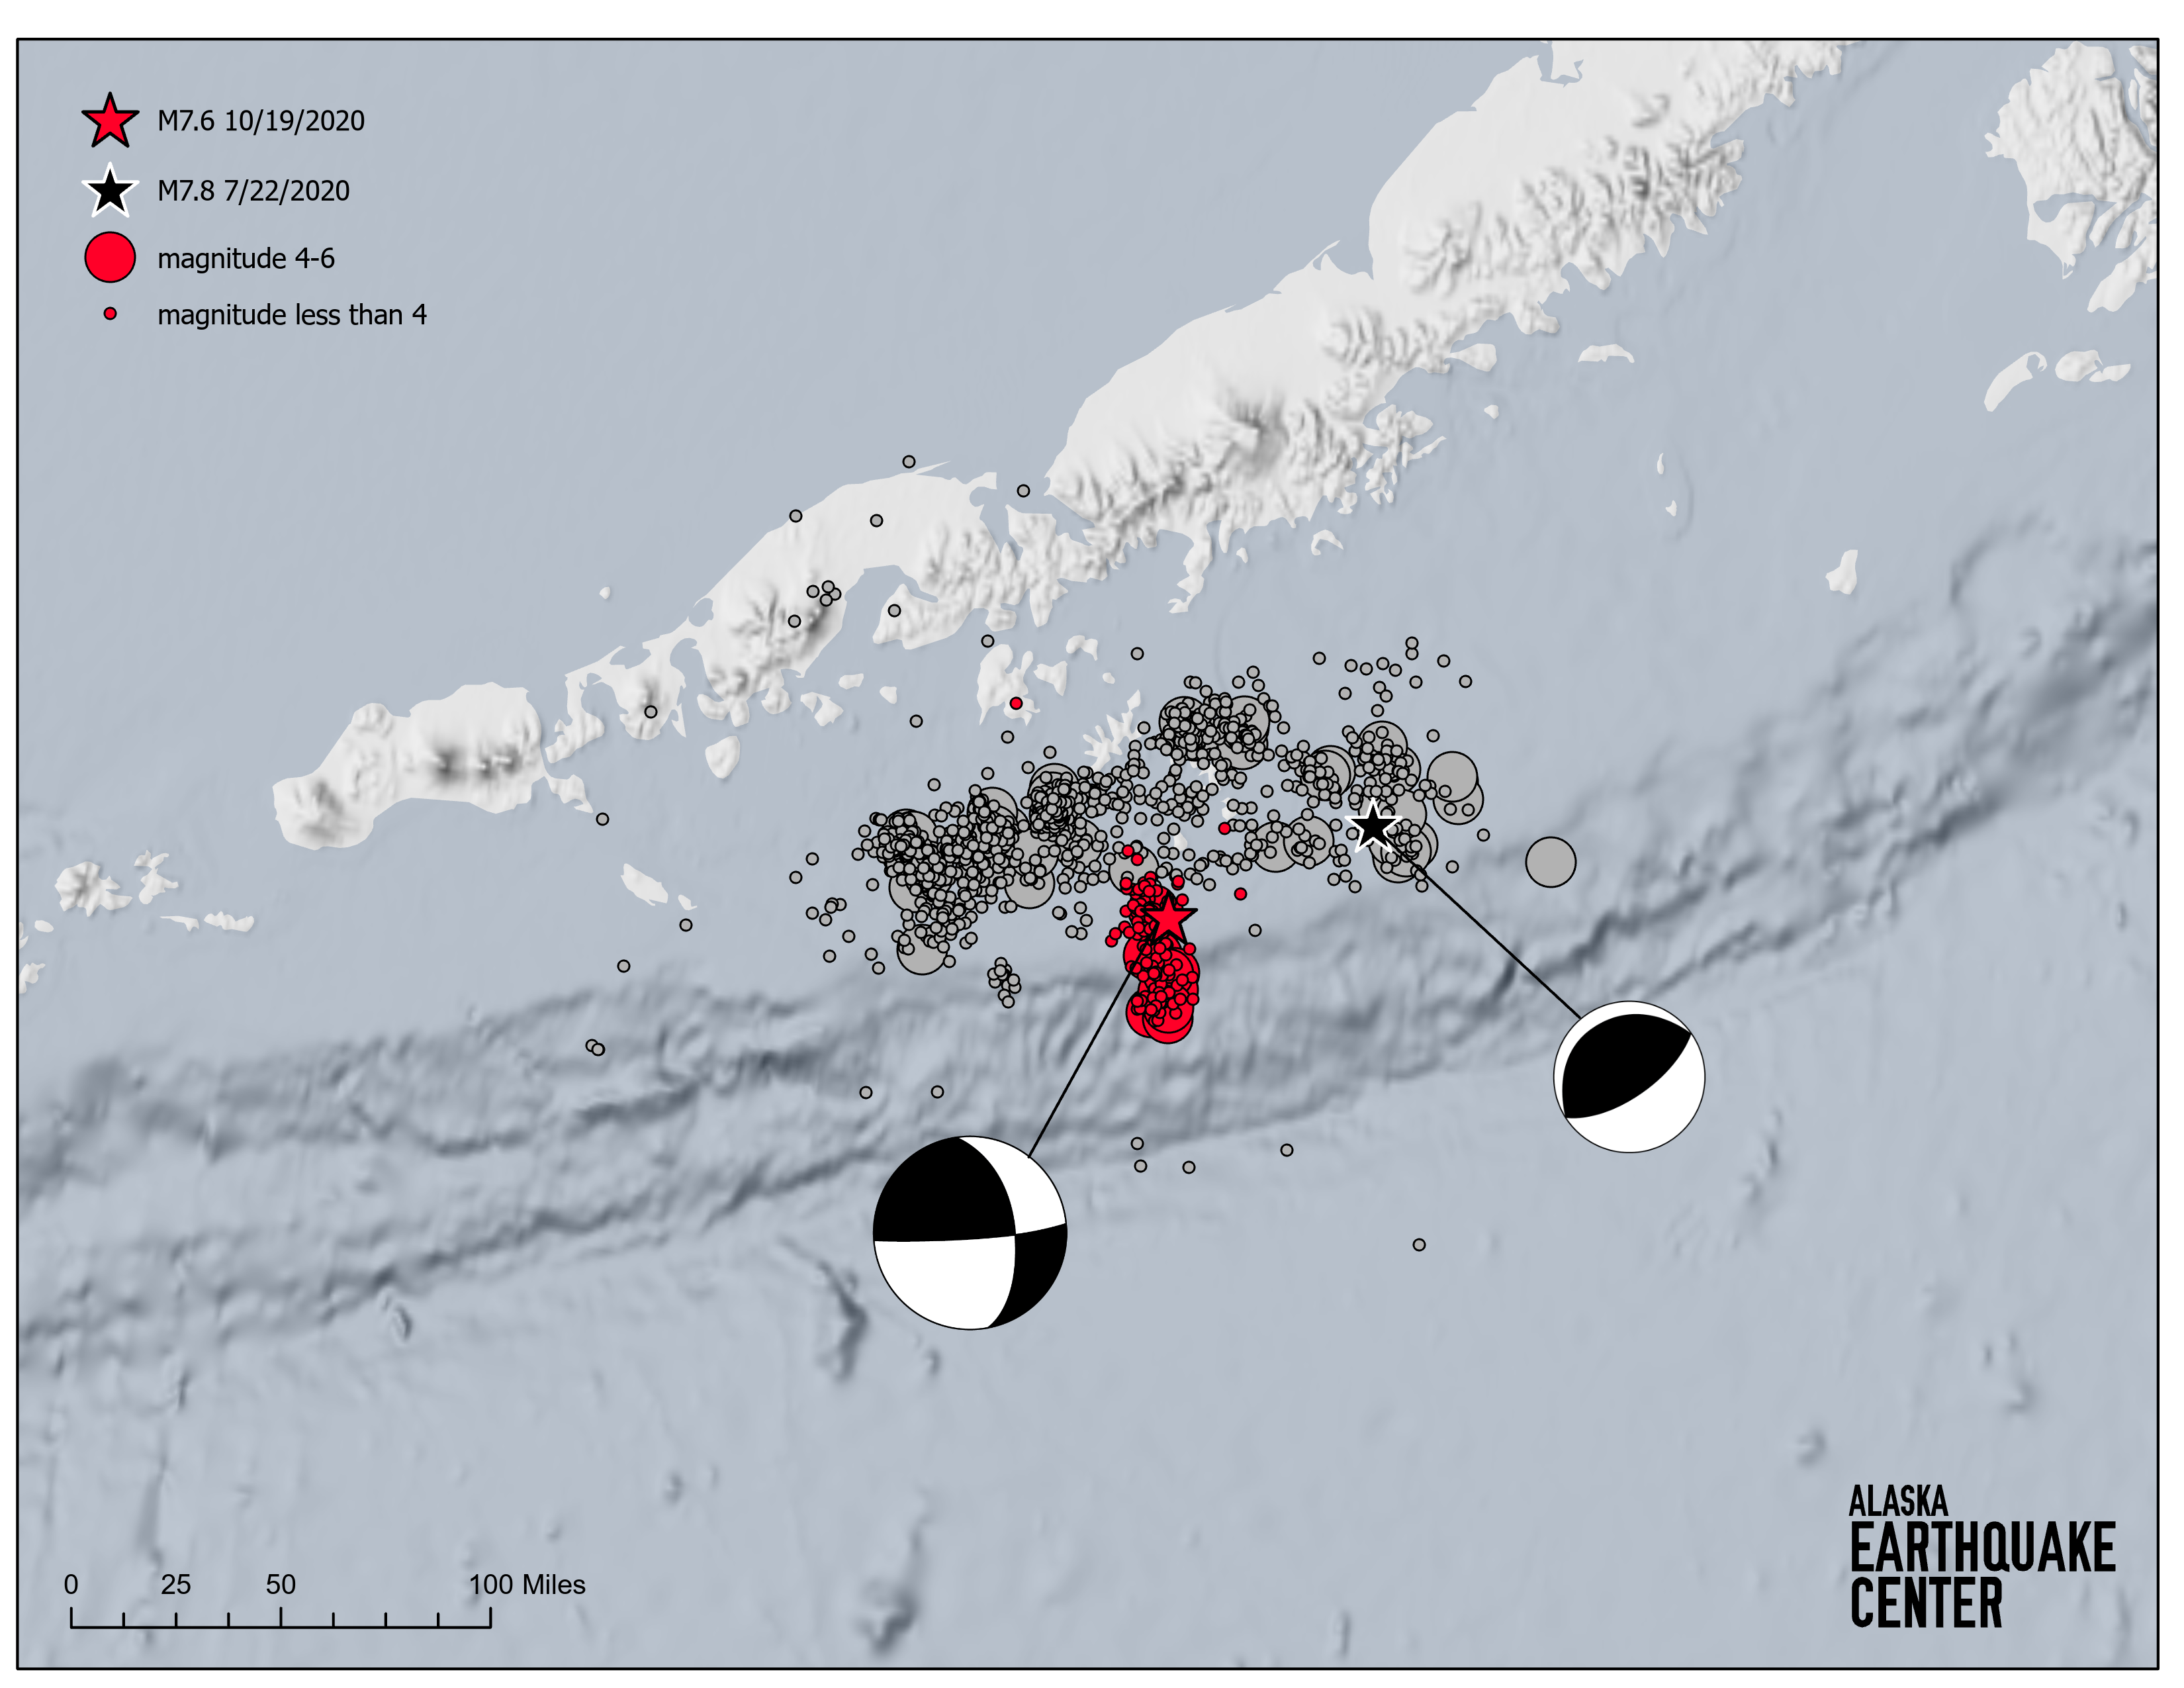
The M7.6 aftershock had a different sense of faulting than the M7.8 mainshock indicating that it occurred on a different fault surface (note the difference in the beach balls shown on the map). The Simeonof earthquake ruptured along the megathrust, an interface between the subducting Pacific and overlying North American plates. It was a typical subduction zone earthquake. The M7.6 aftershock, however, ruptured on a more steeply dipping plane that does not align with the megathrust interface.
There are two possibilities for the source of the M7.6 event. One is that it occurred in the overriding plate on a crustal fault, and another that it was located at a deeper depth and ruptured within the subducting plate, similar to the 2018 M7.1 Anchorage earthquake. In order to answer this question, we will need to record and analyze more aftershocks that followed the October 19 event. So far, reviewed October aftershocks align along the NNW-SSE-trending fault plane.
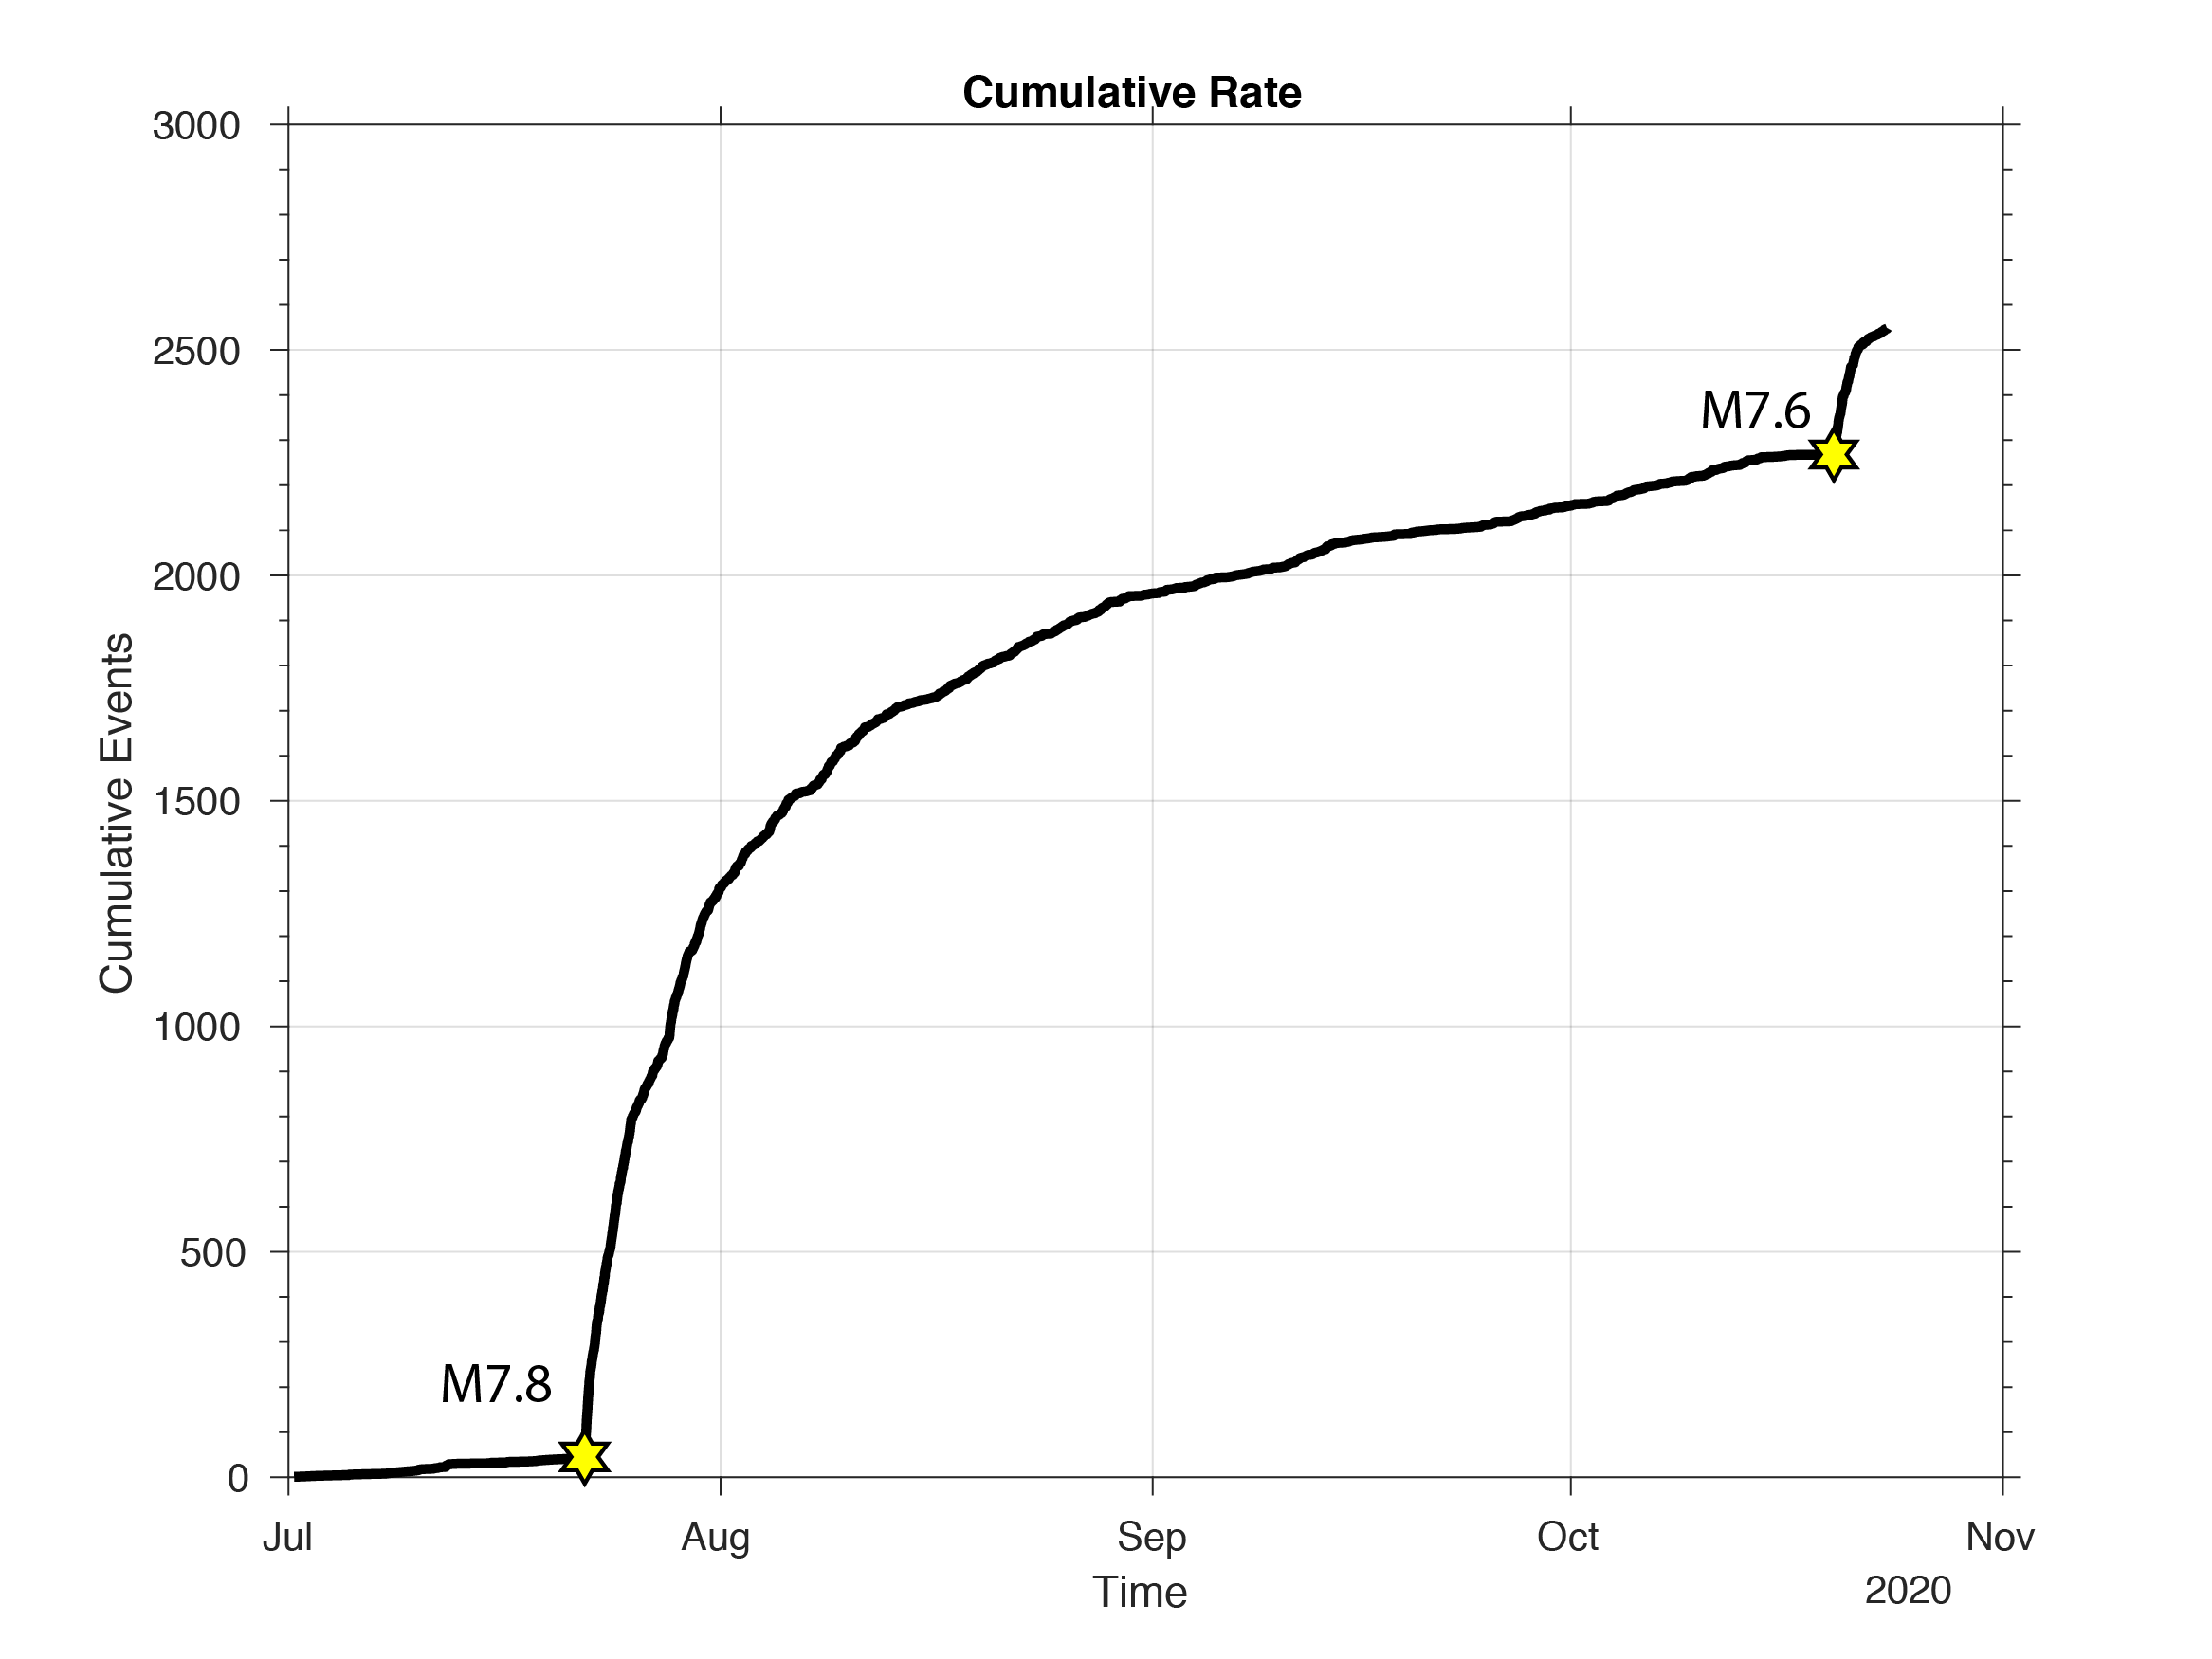
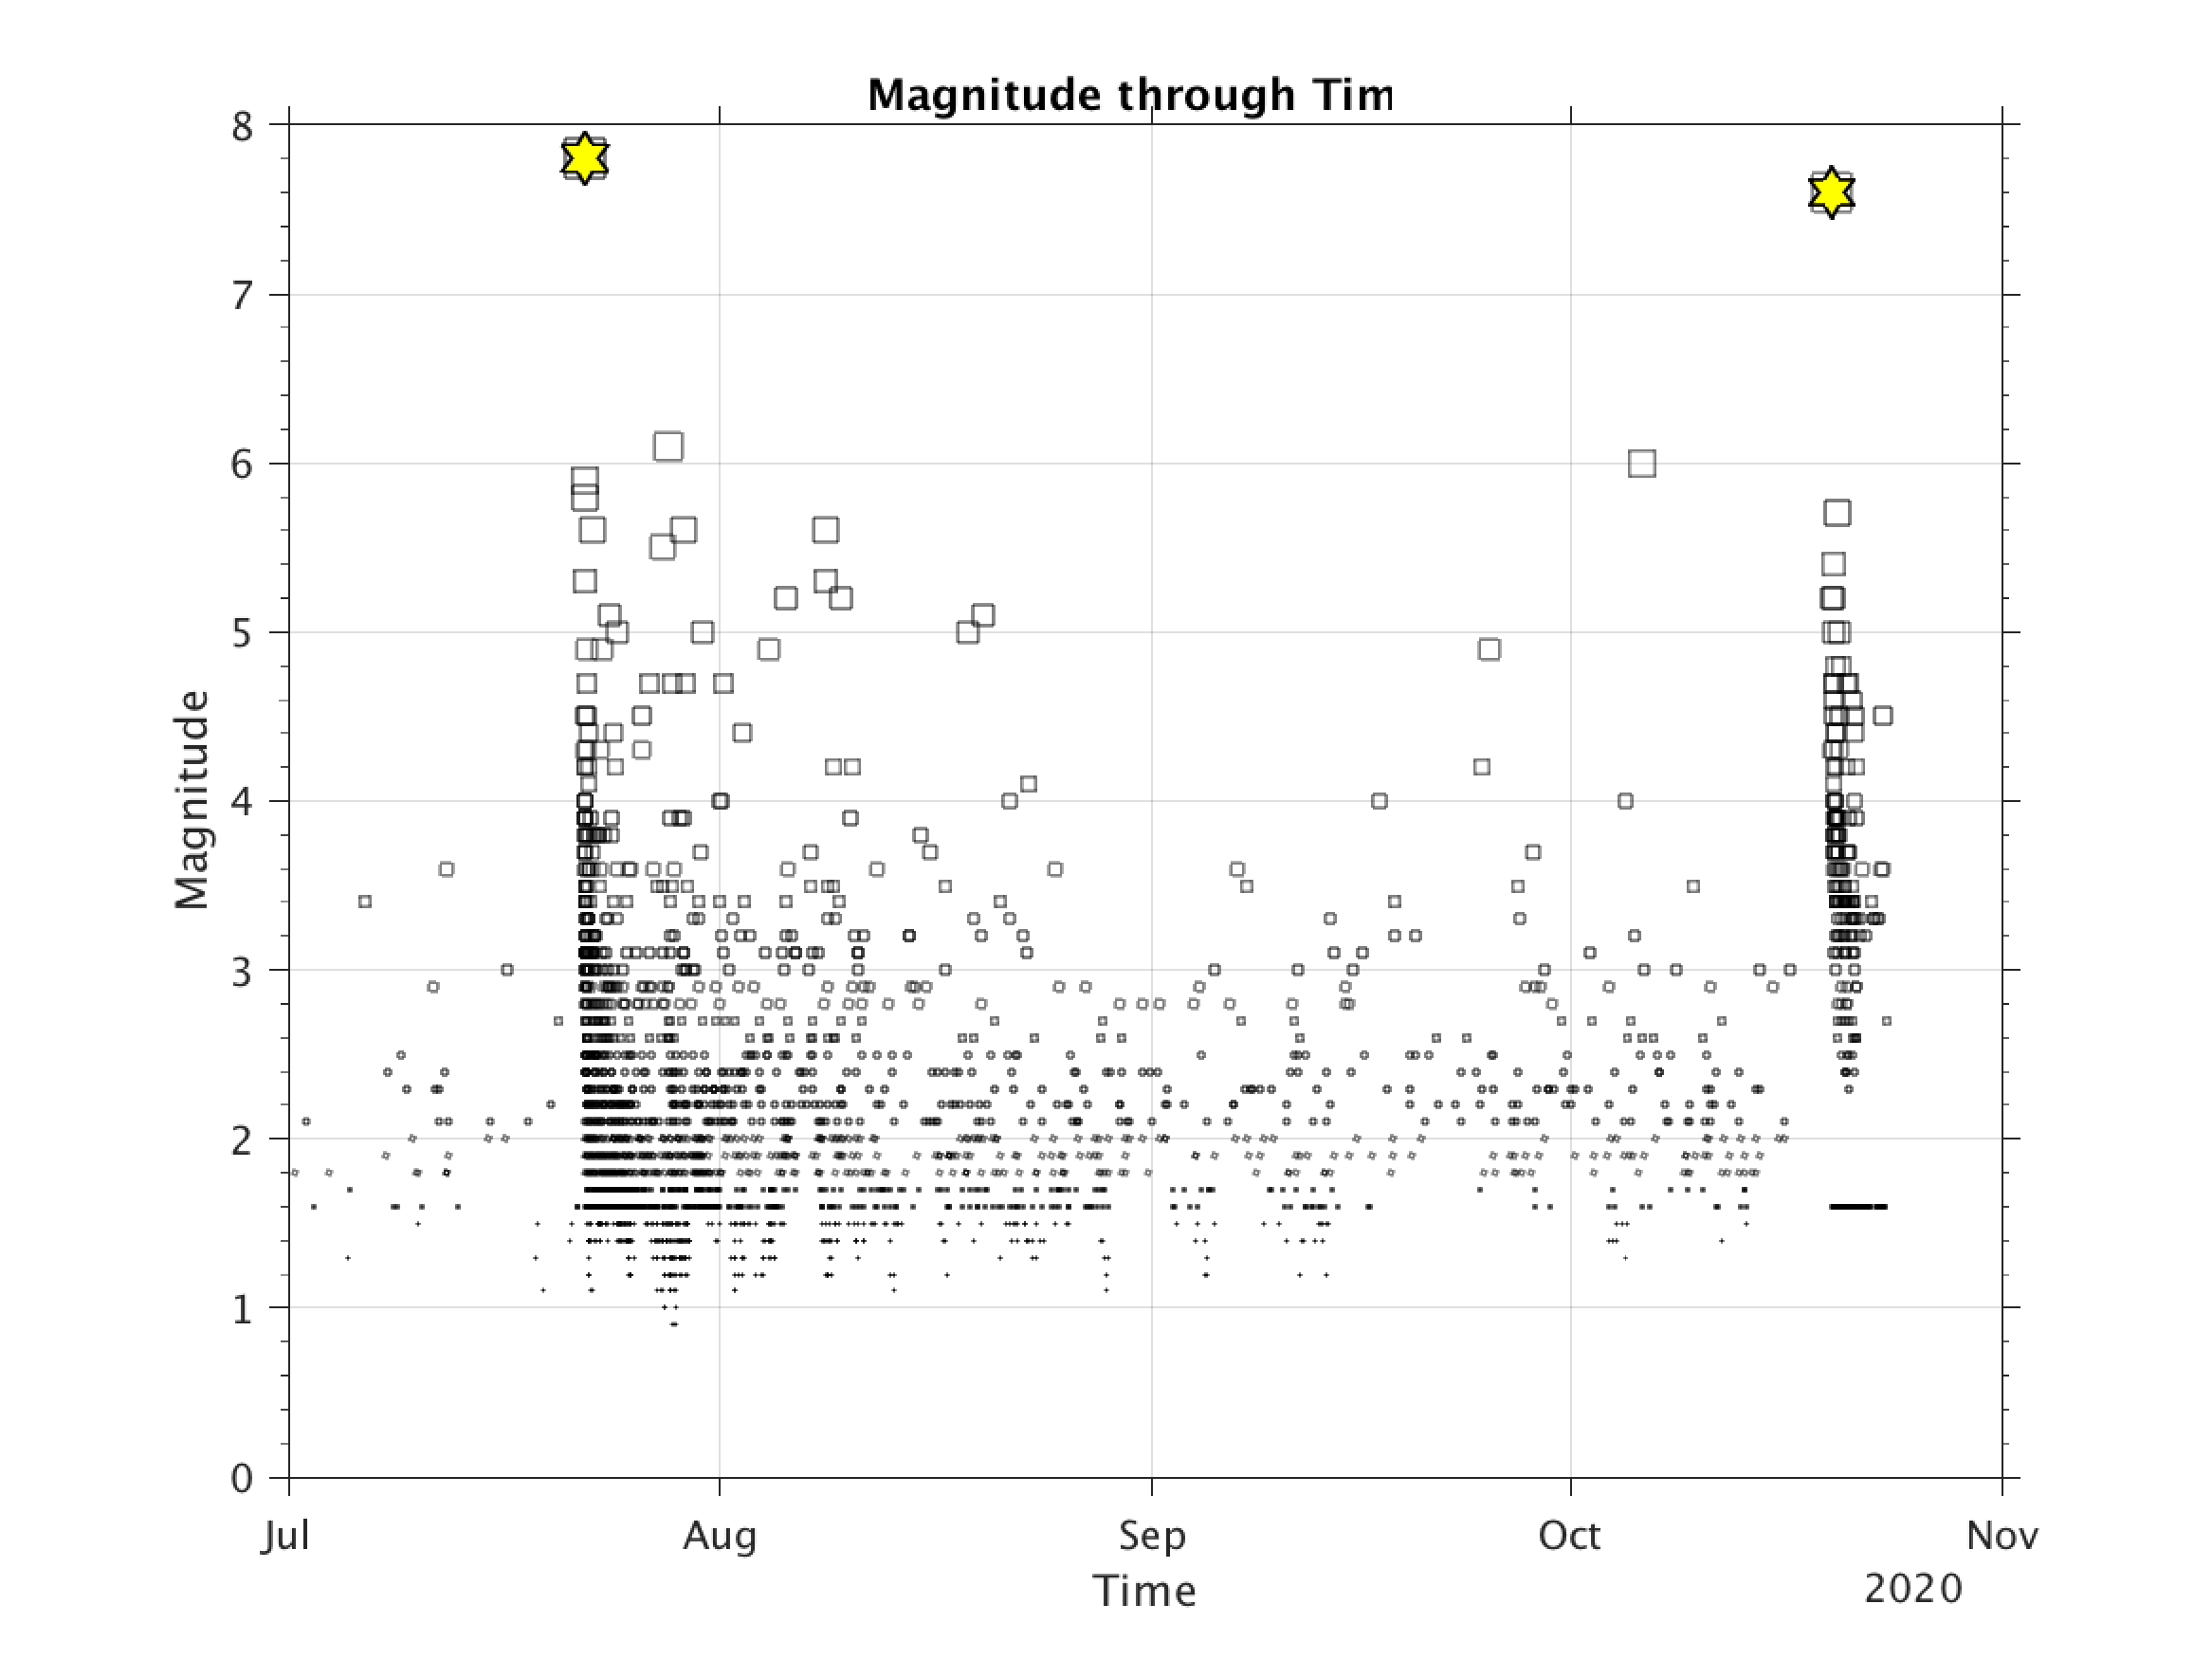
Prior to the October 19 aftershock, we had recorded over 2,200 aftershocks with the largest magnitude of 6.1, and the sequence followed a predictable rate of decrease (Figures 2 and 3). The M7.6 aftershock triggered its own aftershock sequence that increased the overall rate of events once again. Yes, each aftershock generates its own aftershock sequence, but they all merge together into a main event aftershock sequence.
We will be able to learn more about this sequence in the coming days and weeks. It is an intriguing sequence that deserves more attention. It is important to understand how and why significant aftershocks are triggered to fully understand the hazards associated with a given fault.