


When people report to the Earthquake Center that they have felt an earthquake on social media, we encourage them to submit a Did You Feel It? report via the USGS website and here's why.
At a very basic level, we use these felt reports when we create our weekly and monthly seismicity reports to note how many events were felt during that week or month. However, especially for larger earthquakes, the information you provide can directly help to improve our rapid-response products, such as ShakeMap, which are routinely used by emergency managers to assess where shaking was strongest immediately after an earthquake.
When you fill out a felt report, the form asks you a number of optional questions. As you might suspect, these are not random, but have been carefully crafted in order to translate your perception of shaking into a scientific measurement, called earthquake intensity. Intensity is measured on the Modifed Mercalli Scale, with values ranging from I (not felt) to X (extreme). The more information you give, the more accurate the system can estimate the earthquake intensity at your location.
Your answers are combined with others near you to provide a single data point of intensity for your area. Note that even as close partners with the USGS, the Earthquake Center cannot view individual responses or see exact locations of people’s responses; we only receive an aggregated summary of reports within an area of interest. The combined responses can then be used to enhance the ShakeMap by adding real-world data points to places where we do not have seismic instruments.
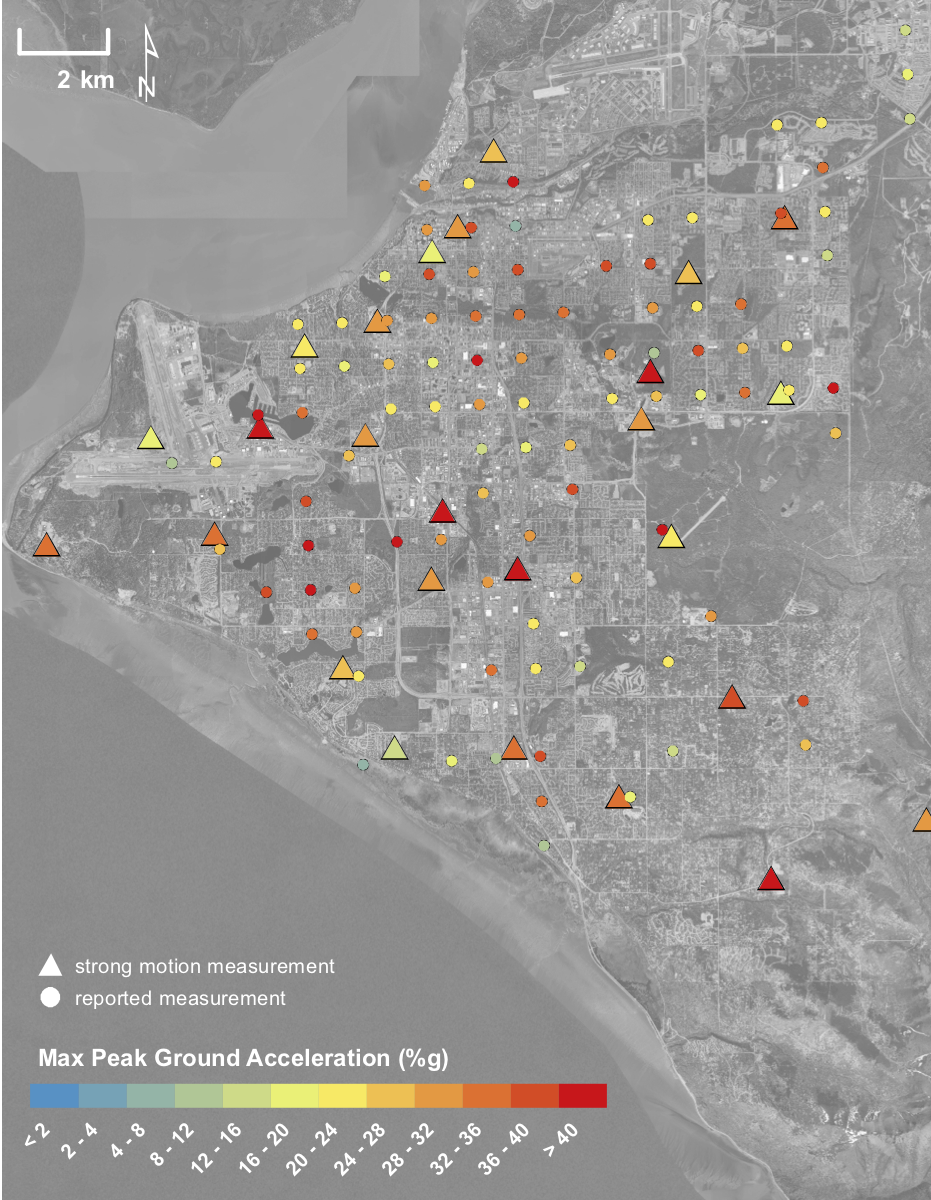
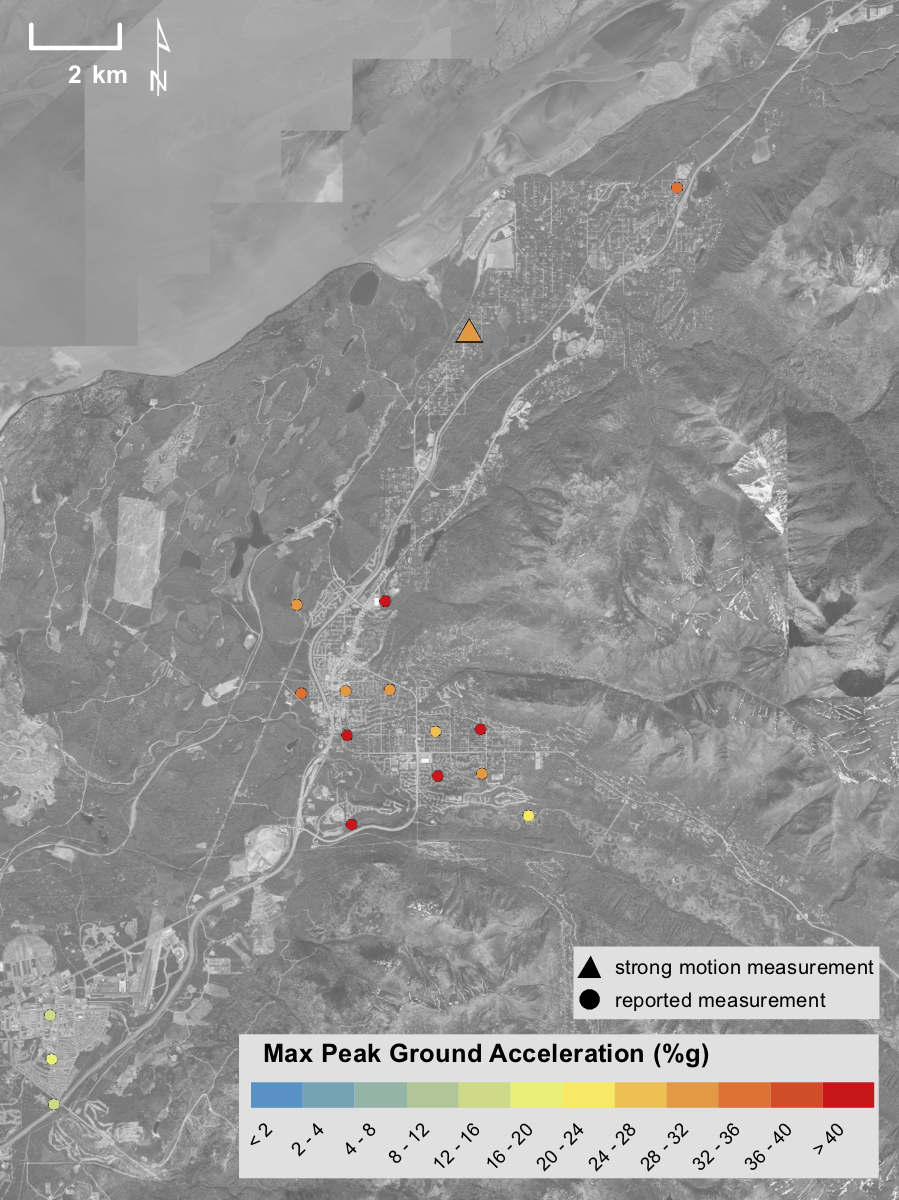
As you might expect, the 2018 Anchorage earthquake is a perfect illustration of how Did You Feel It? reports can improve earthquake products. In figure 1, we show a map of Anchorage. There were over 25 seismic stations operating during the earthquake (triangles), but even still, shaking intensity in much of the city could only be estimated. However, when Did You Feel It? reports are added (circles), a clearer picture of intensity variations can be seen. Looking at Eagle River (figure 2), the difference is even more obvious. During the Anchorage earthquake, there was only one seismic instrument somewhat in the area, so we were unable to accurately assess how strong shaking was in the city. Adding in the Did You Feel It? reports, we can clearly see that strong shaking was widespread throughout the city. Using this additional data, we were able to revise our ShakeMap in those areas, taking into account reported shaking that was higher than our models expected.
For further information on Did You Feel It?, visit the USGS pages for scientific background and an FAQ.