


Because earthquakes tend to grab the most attention, the majority of the seismic record—the noise, or “background” to earthquakes—is commonly ignored. These tiny squiggles reflect the low- and high-frequency vibrations that continuously pass through the earth, and tell the story of the environmental sources of these vibrations as recorded at seismic stations throughout Alaska.
Using a variety of instruments housed at 110 seismic stations across the state, Alaska Earthquake Center researchers Cade Quigley and Mike West recently determined that wind speed, vegetation, and seasonality all influence how background noise is picked up by seismometers. Their work, published recently in the Bulletin of the Seismological Society of America, points to the forces that can obscure the seismic record of earthquakes. Deciphering the influences on noise might also prove useful in tracking how the signal changes under the influence of altering climate conditions in Alaska and the Arctic.
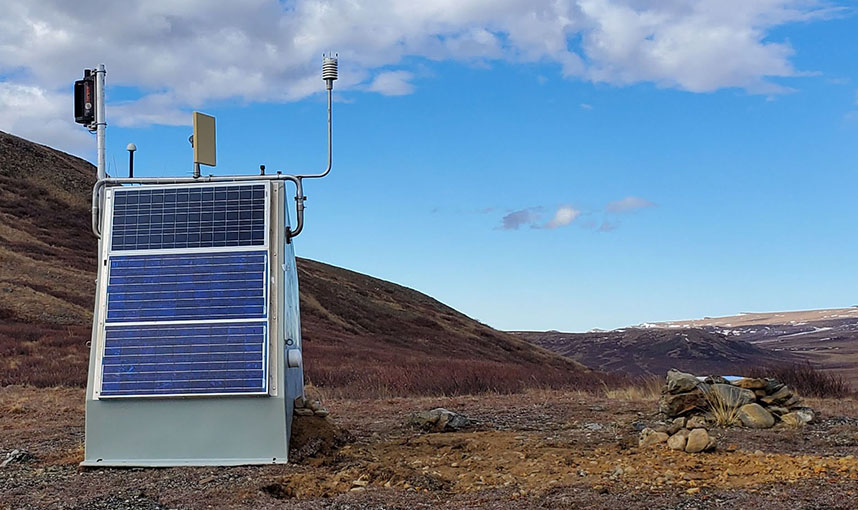
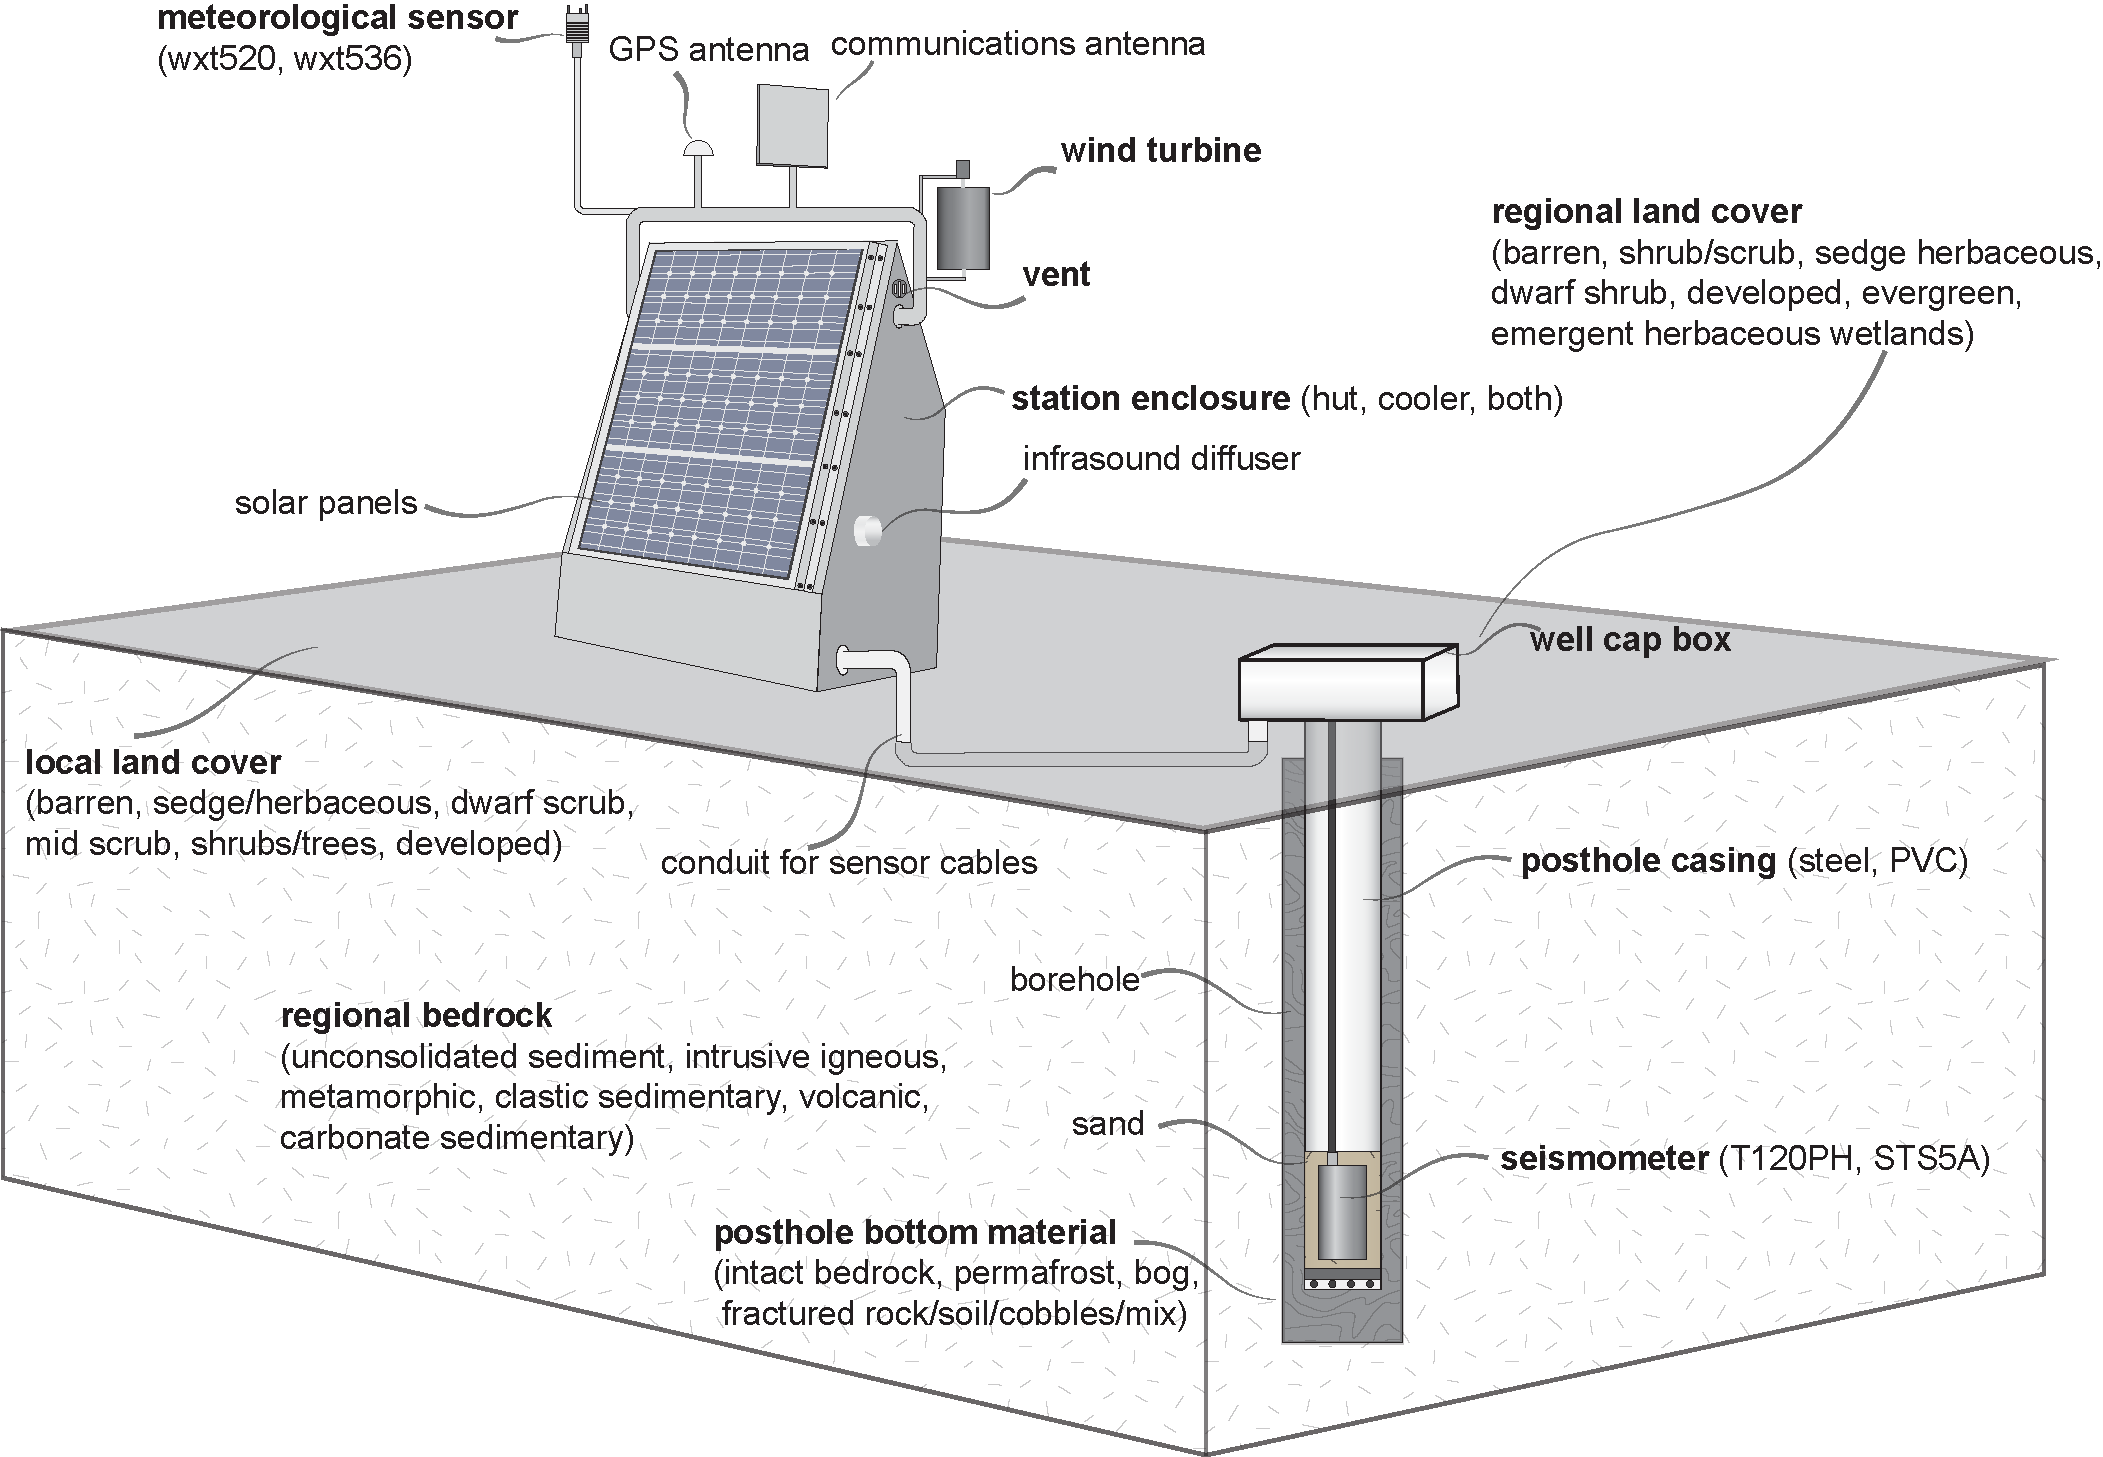
The USArray project, supported by the National Science Foundation, launched the installation of weather instrumentation at Alaska’s seismic stations in 2014, making it possible to investigate how environmental factors create seismic vibrations, and how these signals vary across the state. In 2018, the Alaska Earthquake Center began adopting these stations with their added capacity, which includes measurements of soil temperature, rainfall, wind speed and direction, and atmospheric pressure and temperature (see Figures 1 and 2). Using the expanded network capabilities, Quigley and West developed a method to correlate seismic energy with wind speed for a year’s worth of data, by parsing the data into hour-long segments.
Quigley and West found not only that wind is a dominant source of seismic background noise, but that this background noise can be used to track different environmental factors. They confirmed previous studies suggesting that increased wind speed leads to higher amplitude of background seismic squiggles, or in other words, more noise.
With the rare opportunity offered by having wind and seismic stations at the same site, Quigley and West were able to demonstrate that local conditions around seismic stations can influence how sensitive a station is to wind noise. For example, taller vegetation around a seismic station creates more wind noise. The researchers surmise that the height of the vegetation allows for more surface area for wind to move through, thereby transmitting more energy into the ground near the seismometer.
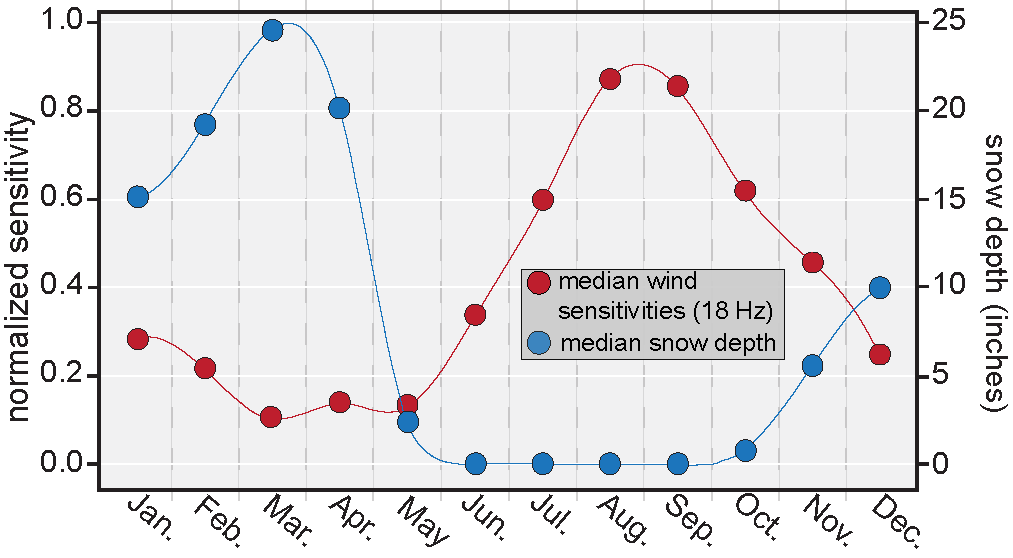
Wind noise also changes through the seasons. The researchers demonstrate that lower-amplitude background squiggles, typically from January to May at 75% of the stations, (see Figure 3) indicate a blanket of snow insulating the ground and vegetation from wind disturbance. Shrub expansion, decreased snow depth and duration, and other changes projected to stem from climate change in Arctic and alpine regions of Alaska will likely lead to more wind noise in seismic records.
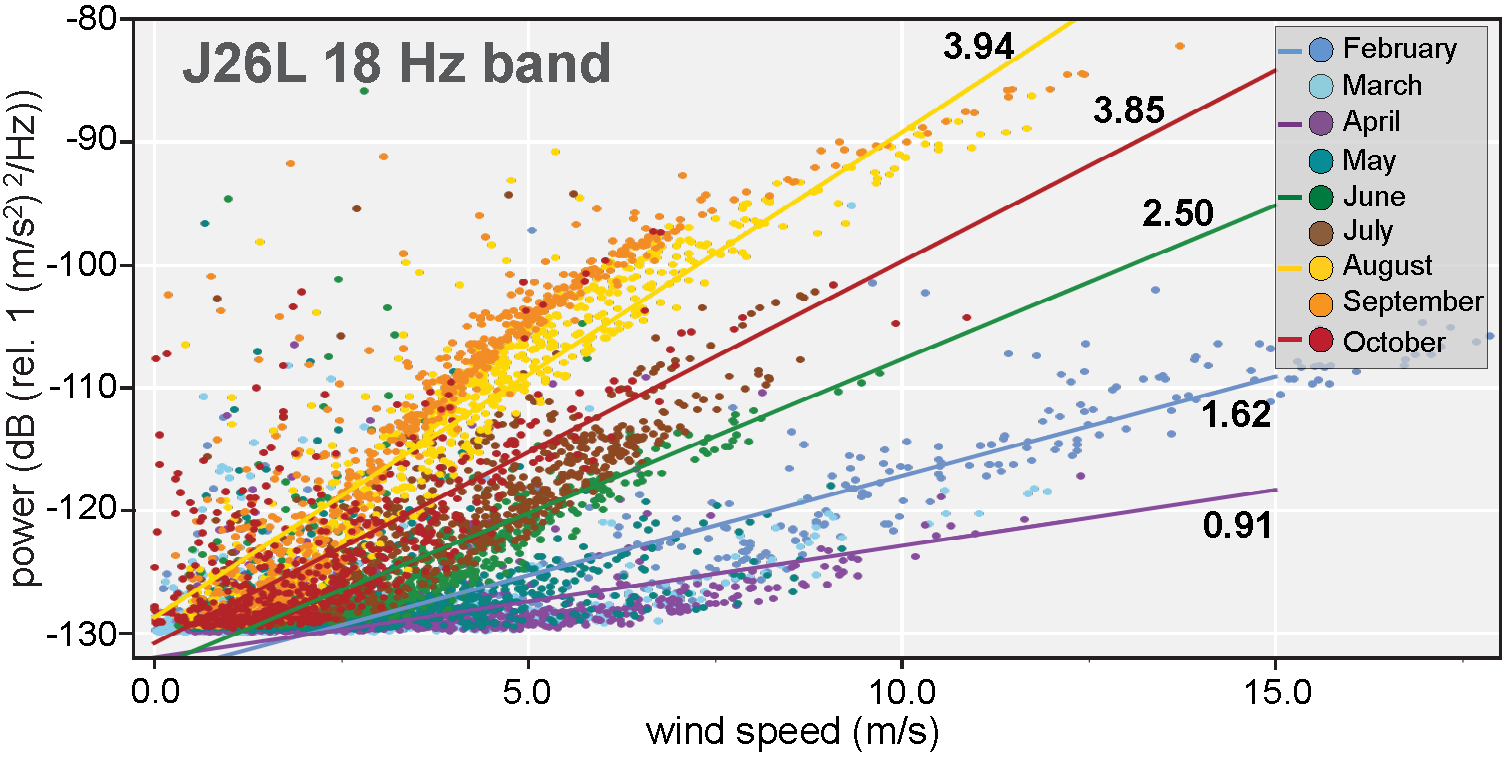
While the study findings on wind-induced noise offer a potential resource for monitoring climate conditions and changes across Alaska, they also pose a challenge to earthquake monitoring. Wind noise is notably present in the high-frequency (>1 Hz) portion of the seismic spectrum (see Figure 4). So, too, are parts of the seismic signal, such as those needed for earthquake early warning. By honing in on the parts of the seismic signal that pertain to wind, seismologists may be able to remove this noise from seismic data to improve earthquake detection. They may also be able to reduce background noise by shielding seismometers from the known factors that make the ground vibrate.
This study is among the early works that explore the crossovers made possible by the multiple instrument types housed at our expanded network of seismic stations.