
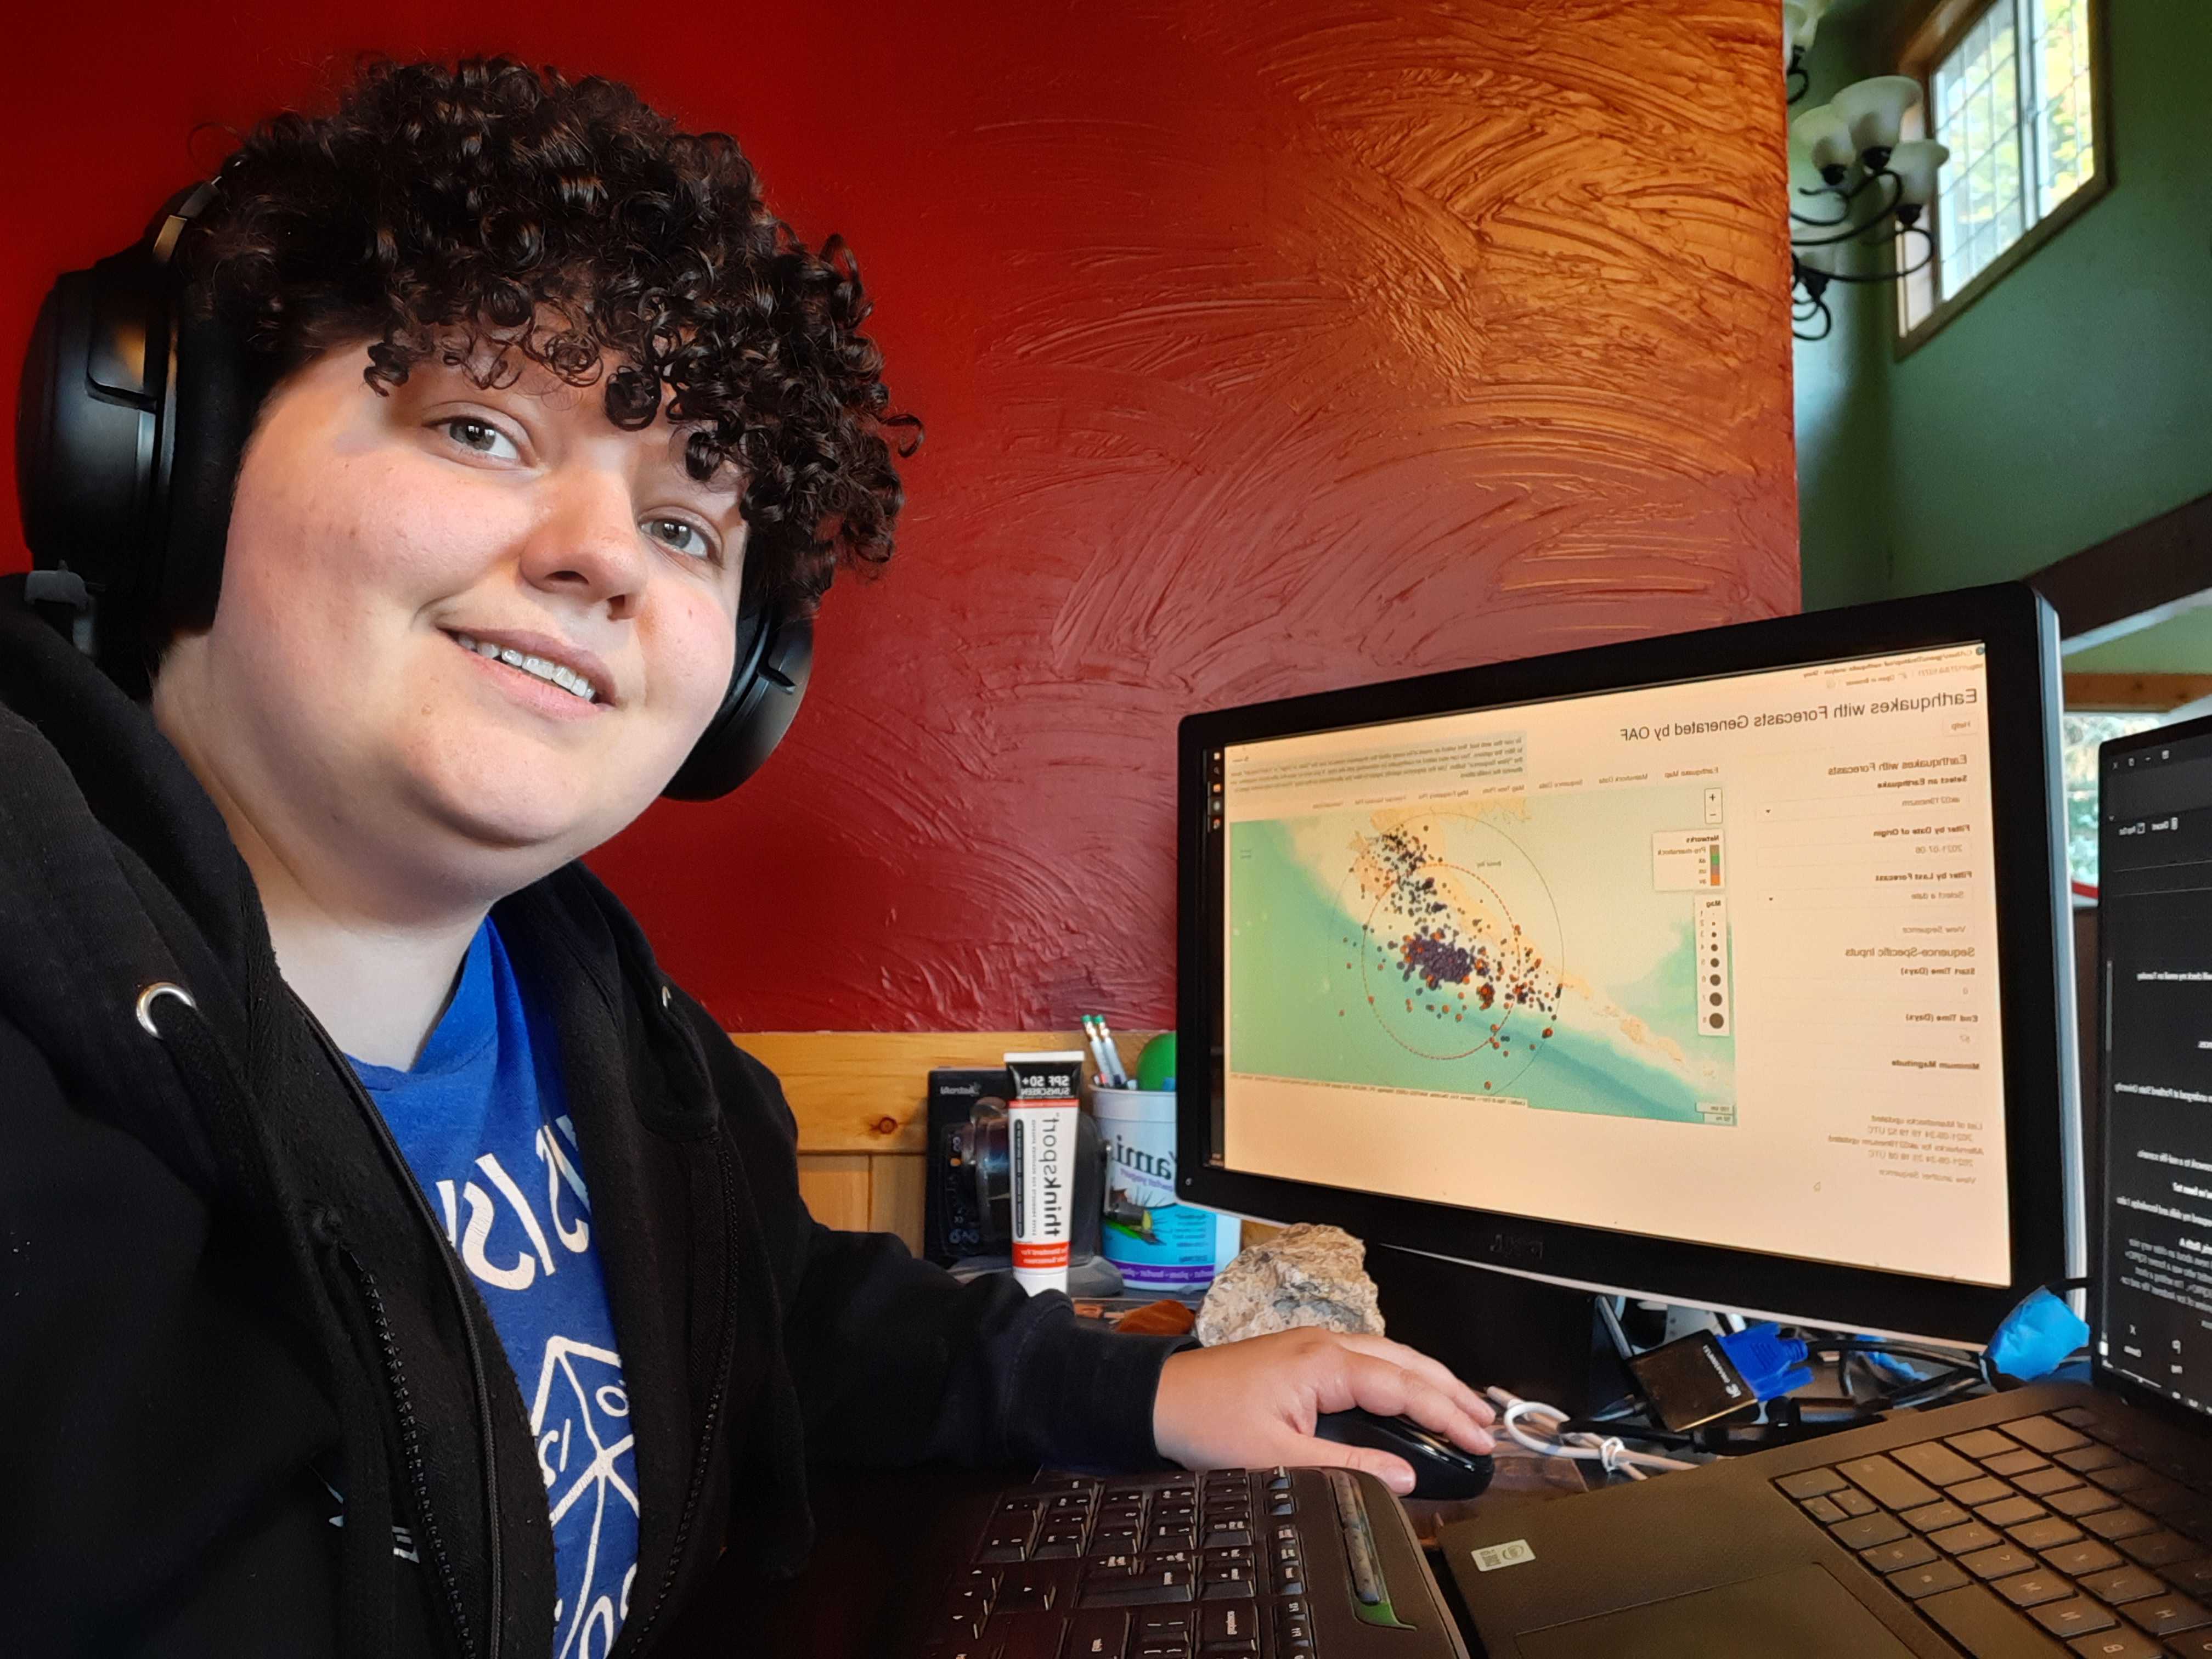


Gabe Paris is part of the Earthquake Center’s Systems Team that helps keep data flowing from our field stations and shapes it into products for researchers and others interested in Alaska’s seismic activity.
I’m a scientific software developer. My tasks vary, from archiving data sent to us from our seismic stations across the state, to maintaining our in-house procedures for collecting, processing, and storing data.
My first project was to create the images that scroll across the top of the Center’s website home page. I combined ideas from my Earthquake Center peers to create the new visuals with the aim of providing quick information about seismic activity across Alaska.
Another project was writing code to create on-demand reports of our seismic data. It allows someone to view the number of seismic events by their type (tectonic, glacial, volcanic, and explosion), by depth, by whether it was felt, and by time. The reports give us tools to evaluate the quality and consistency of our data. This project streamlined our quality-control procedures to ensure that the highest-quality data are available for others to use.
I received my bachelor’s degree in geology from Portland State University in Oregon. I have special interests in planetary science and seismology.
I didn’t consider earthquake science as a potential career until spring 2021, when a friend shared information about U.S. Geological Survey (USGS) undergraduate internships. I was accepted into the program in a position that combined data analysis, geology, and programming to create tools to analyze aftershock sequences to improve USGS aftershock forecasting. Barely two days after I started, a magnitude 6 earthquake occurred near Antelope Valley, California. About two weeks later, I presented the first figures I made, based on that earthquake, to the Northern California and Nevada seismic networks. During the course of my internship, I used the data from the M6 California earthquake and the July 28, 2021 M8.2 Chignik Earthquake offshore of Alaska to refine the software. I presented the software at three conferences. A year later, I published a paper, as lead author, titled, “An Interactive Viewer to Improve Operational Aftershock Forecasts,” in Seismological Research Letters.
During my internship, I decided that earthquake science was the career for me, and in late winter of 2022 I was encouraged to apply to the Alaska Earthquake Center. I first applied for one of the field technician positions, since I enjoy geologic field work, and I later applied for the scientific software developer position on a recommendation (a special thanks to the Earthquake Center’s Heather McFarlin!). I started in the developer position in July 2022.
Although no one can predict the exact time or place earthquakes will occur, after a major earthquake we can use a mathematical equation to estimate the expected number of aftershocks of magnitude 3 or higher, and the probability of earthquakes of magnitude 6 or higher, as the sequence continues.
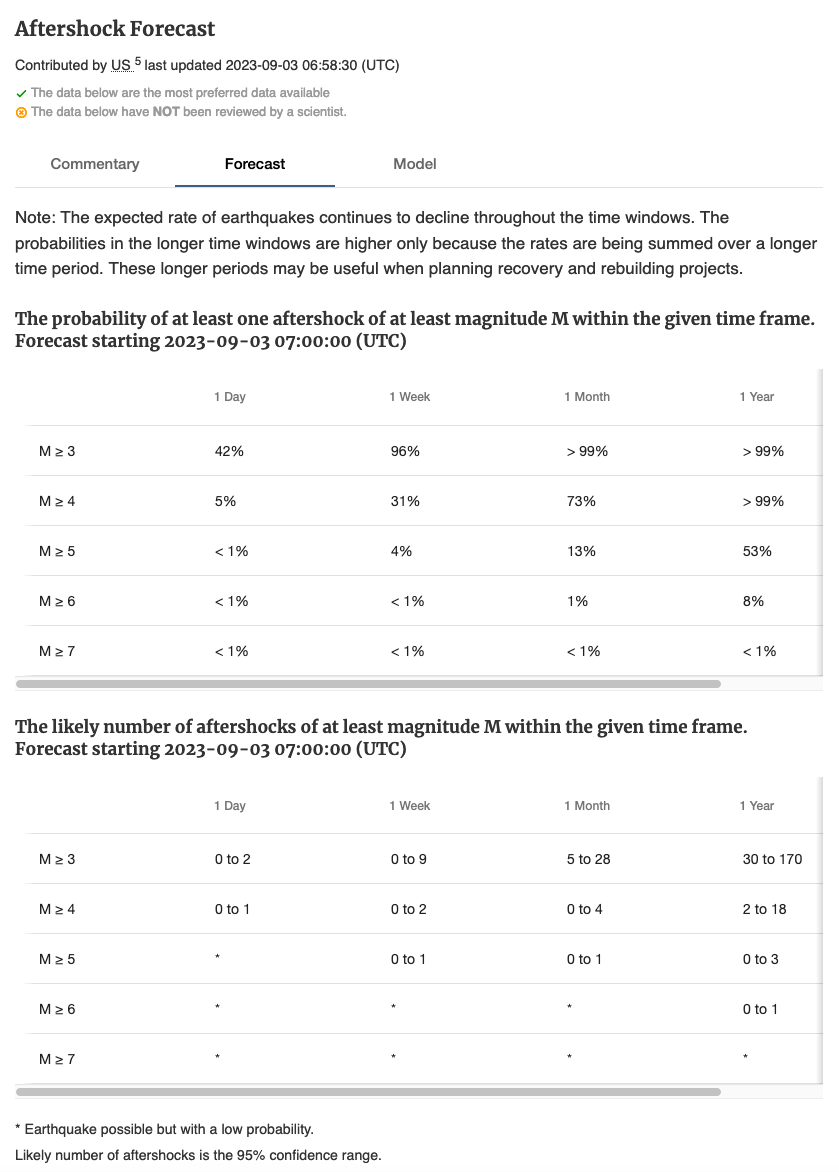
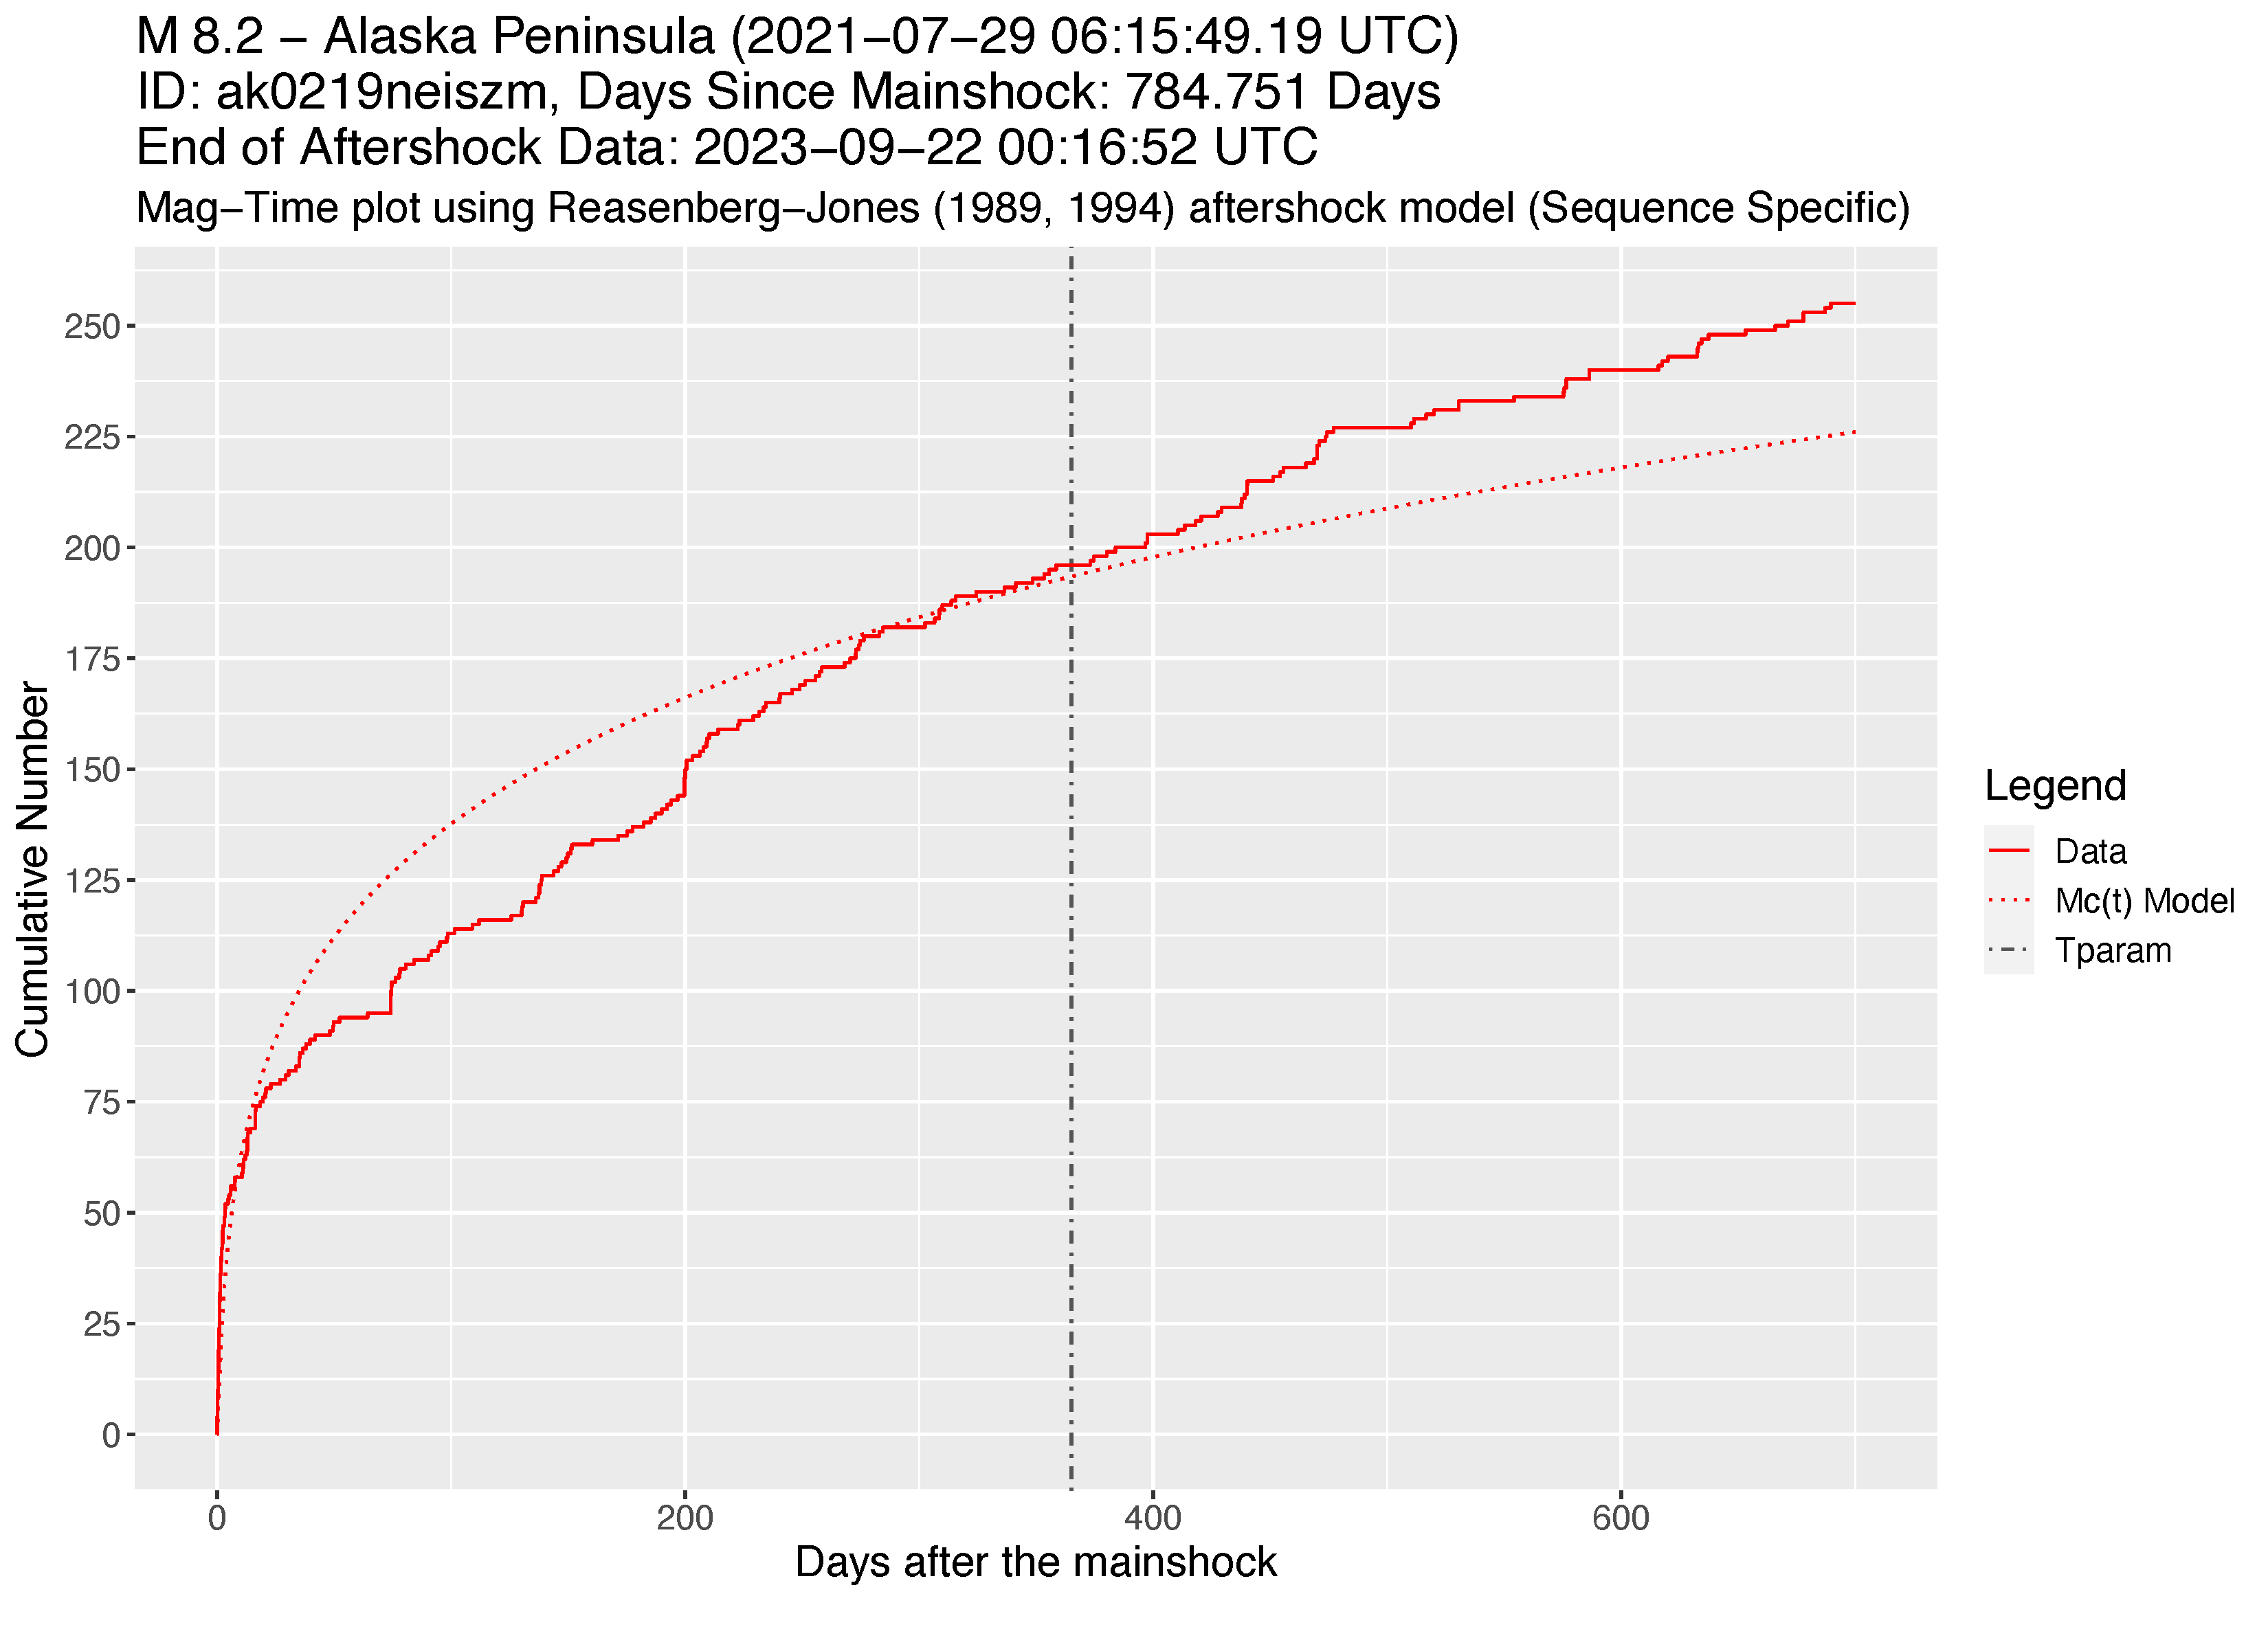
About 20 minutes after an earthquake of magnitude 5 or above occurs in the U.S. or U.S. territories, the USGS issues an aftershock forecast that estimates the chance of more earthquakes. Each forecast contains the probability of more earthquakes in the next day, week, month, and year (see Figure 1). They update the forecast about 75 times during the first year. Most of the forecasts are automatically calculated from Earthquake Center and USGS seismic data and then issued, but some forecasts require manual updating because they don’t exactly match the observed earthquake sequence. For example, a seismologist studying Figure 2 would see that the forecast only fits the data shortly after the mainshock, where the two lines closely overlap. The longer-term forecasts need to be updated to help the forecast fit the data. It is important to identify the sequences whose forecasts will need hands-on attention, so that the USGS can provide accurate information to the public.
We summarized the importance of this tool in our paper: “It is important to maintain the accuracy of the forecasts because emergency managers and infrastructure operators rely on them to make well-informed decisions during an earthquake sequence. Accurate forecasts also properly inform the public about the level of shaking they may experience and increase public awareness of potential aftershock dangers, such as building damage.”
I love being able to problem solve. We are modernizing many of the codes that make Earthquake Center operations possible. I get to learn more about how earthquake features are measured and how data are processed for public use. I am grateful to be in a position where I am constantly learning.
Note: The software tool to study aftershock behavior and the performance of the Operational Aftershock Forecasting system is available at DOI: 10.5066/P9PZTYEN.