


2020 M7.8 Simeonof Earthquake and M7.6 aftershock
Preliminary tilt data
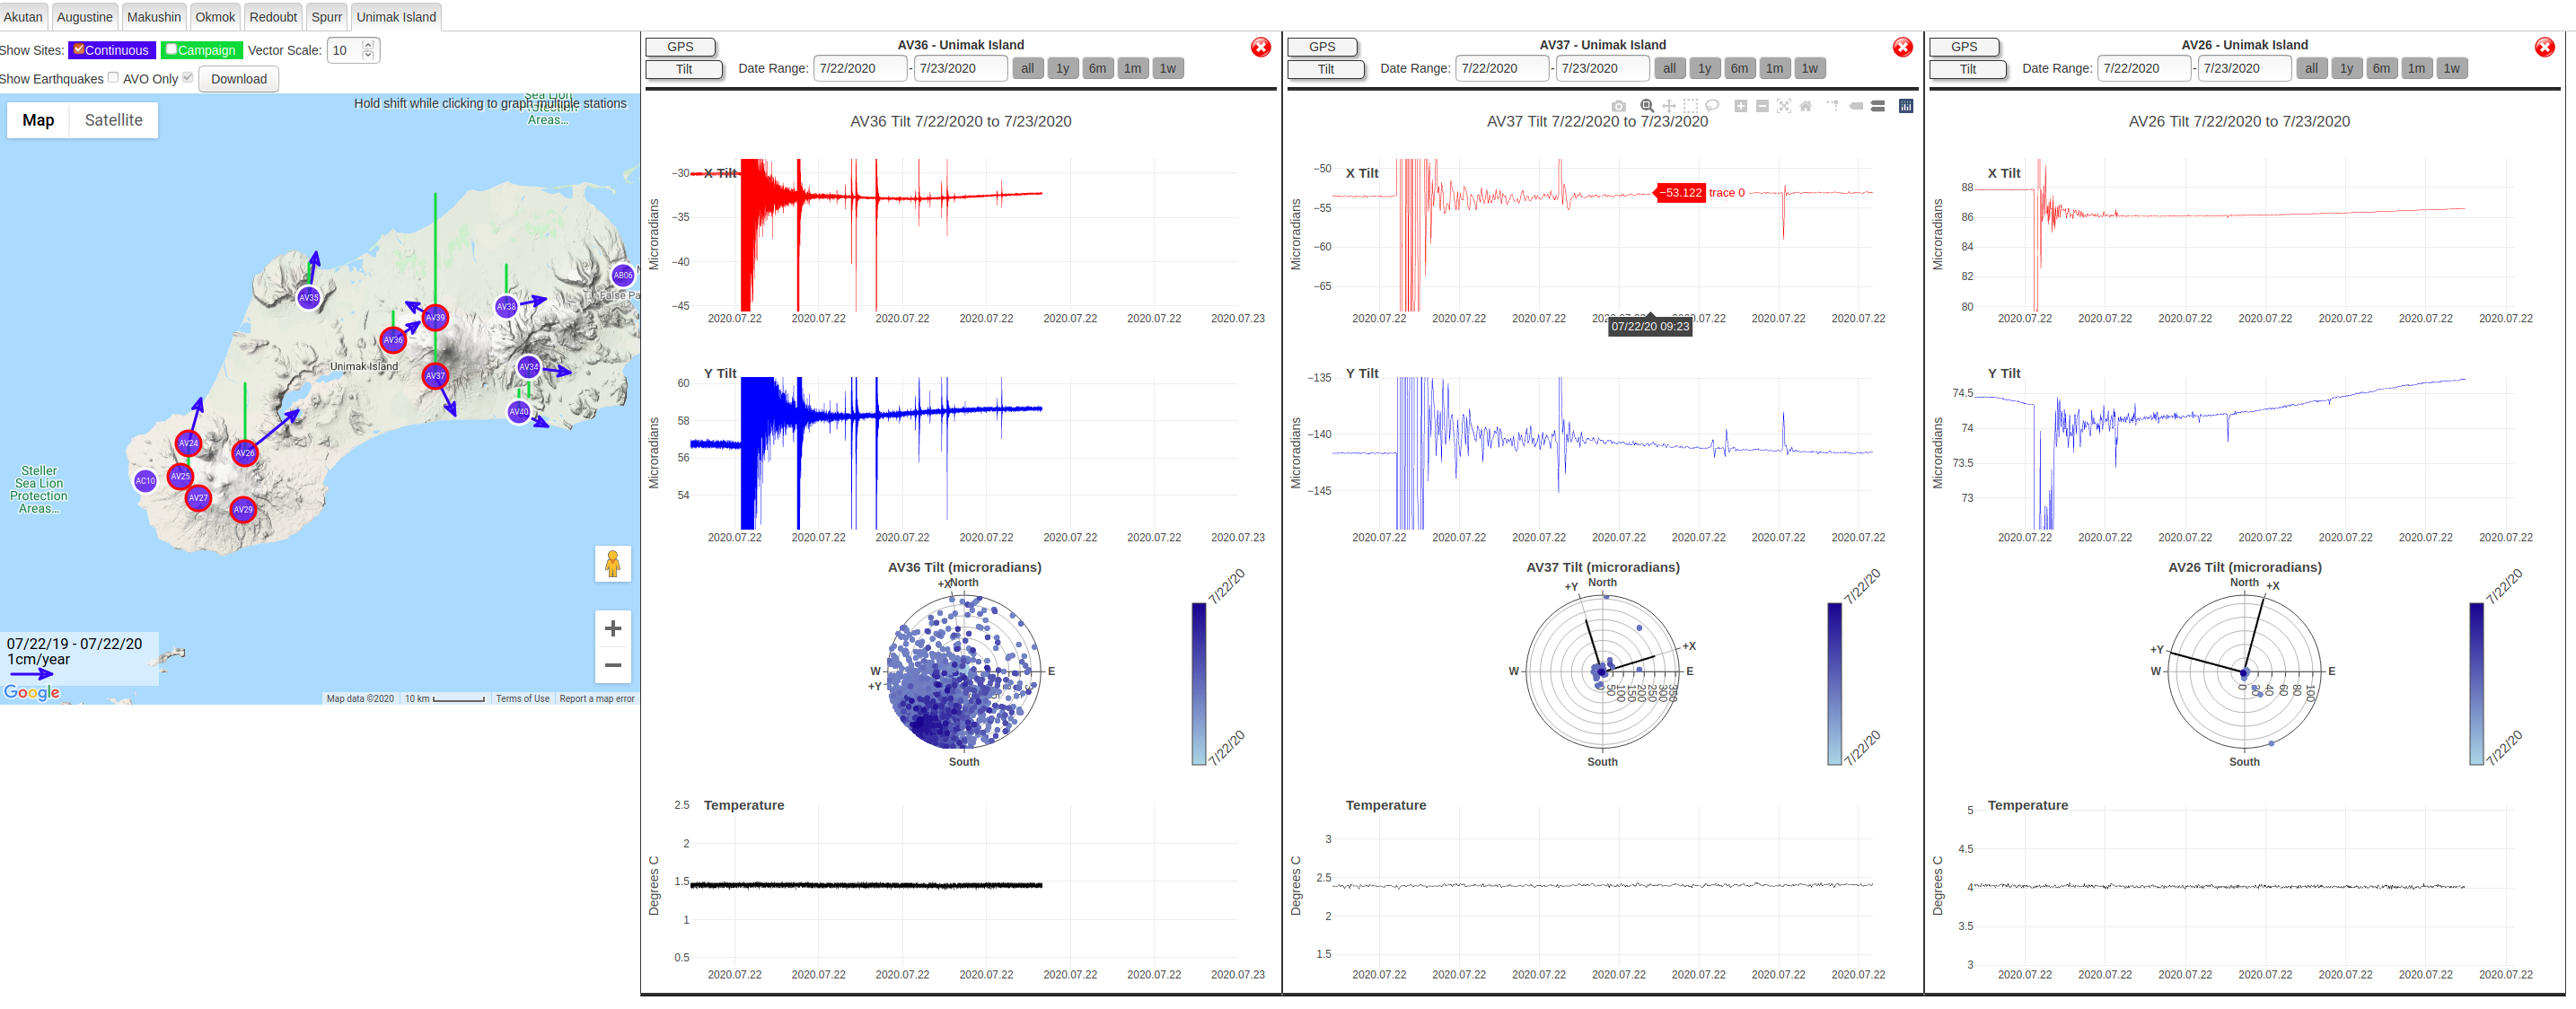
The figure below shows the Simeonof Earthquake captured by tilt instruments on Unimak Island, which are more than 360 km from the epicenter. The red and blue time series show several hours of data, but not the full dynamic range as the interesting signals here are the rapid offset in the tilt series after the mainshock, and some slow, longer period signal, which last several hours and could be a poroelastic response of the ground as this seems very site specific. AV36 samples at 1 sample per second, AV26 and AV27 at 1-minute intervals, explaining the difference in data resolution and the many small aftershocks captured in the AV36 time series. This graphic and its interpretation was provided by Ronni Grapenthin, UAF Associate Professor of Geodesy.
InSAR + GPS offset plot
This figure, provided by Ronni Grapenthin and Logan Fusso, shows two types of permanent ground motion measurements following the M7.8 Simeonof, Alaska, earthquake (July 22, 2020): satellite interferometric phase changes (InSAR) are shown in the rainbow fringe patterns from a descending Sentinel 1 pass; GPS data are shown as vectors indicating horizontal (black) and vertical (white) co-seismic offsets. Due to the few, disconnected land areas, it is difficult to interpret the InSAR results and determine absolute motion from these. We do see clear fringe patterns on the islands, each of those fringes going from purple to red is equivalent to about 5.5 cm of motion in the line of sight of the satellite.
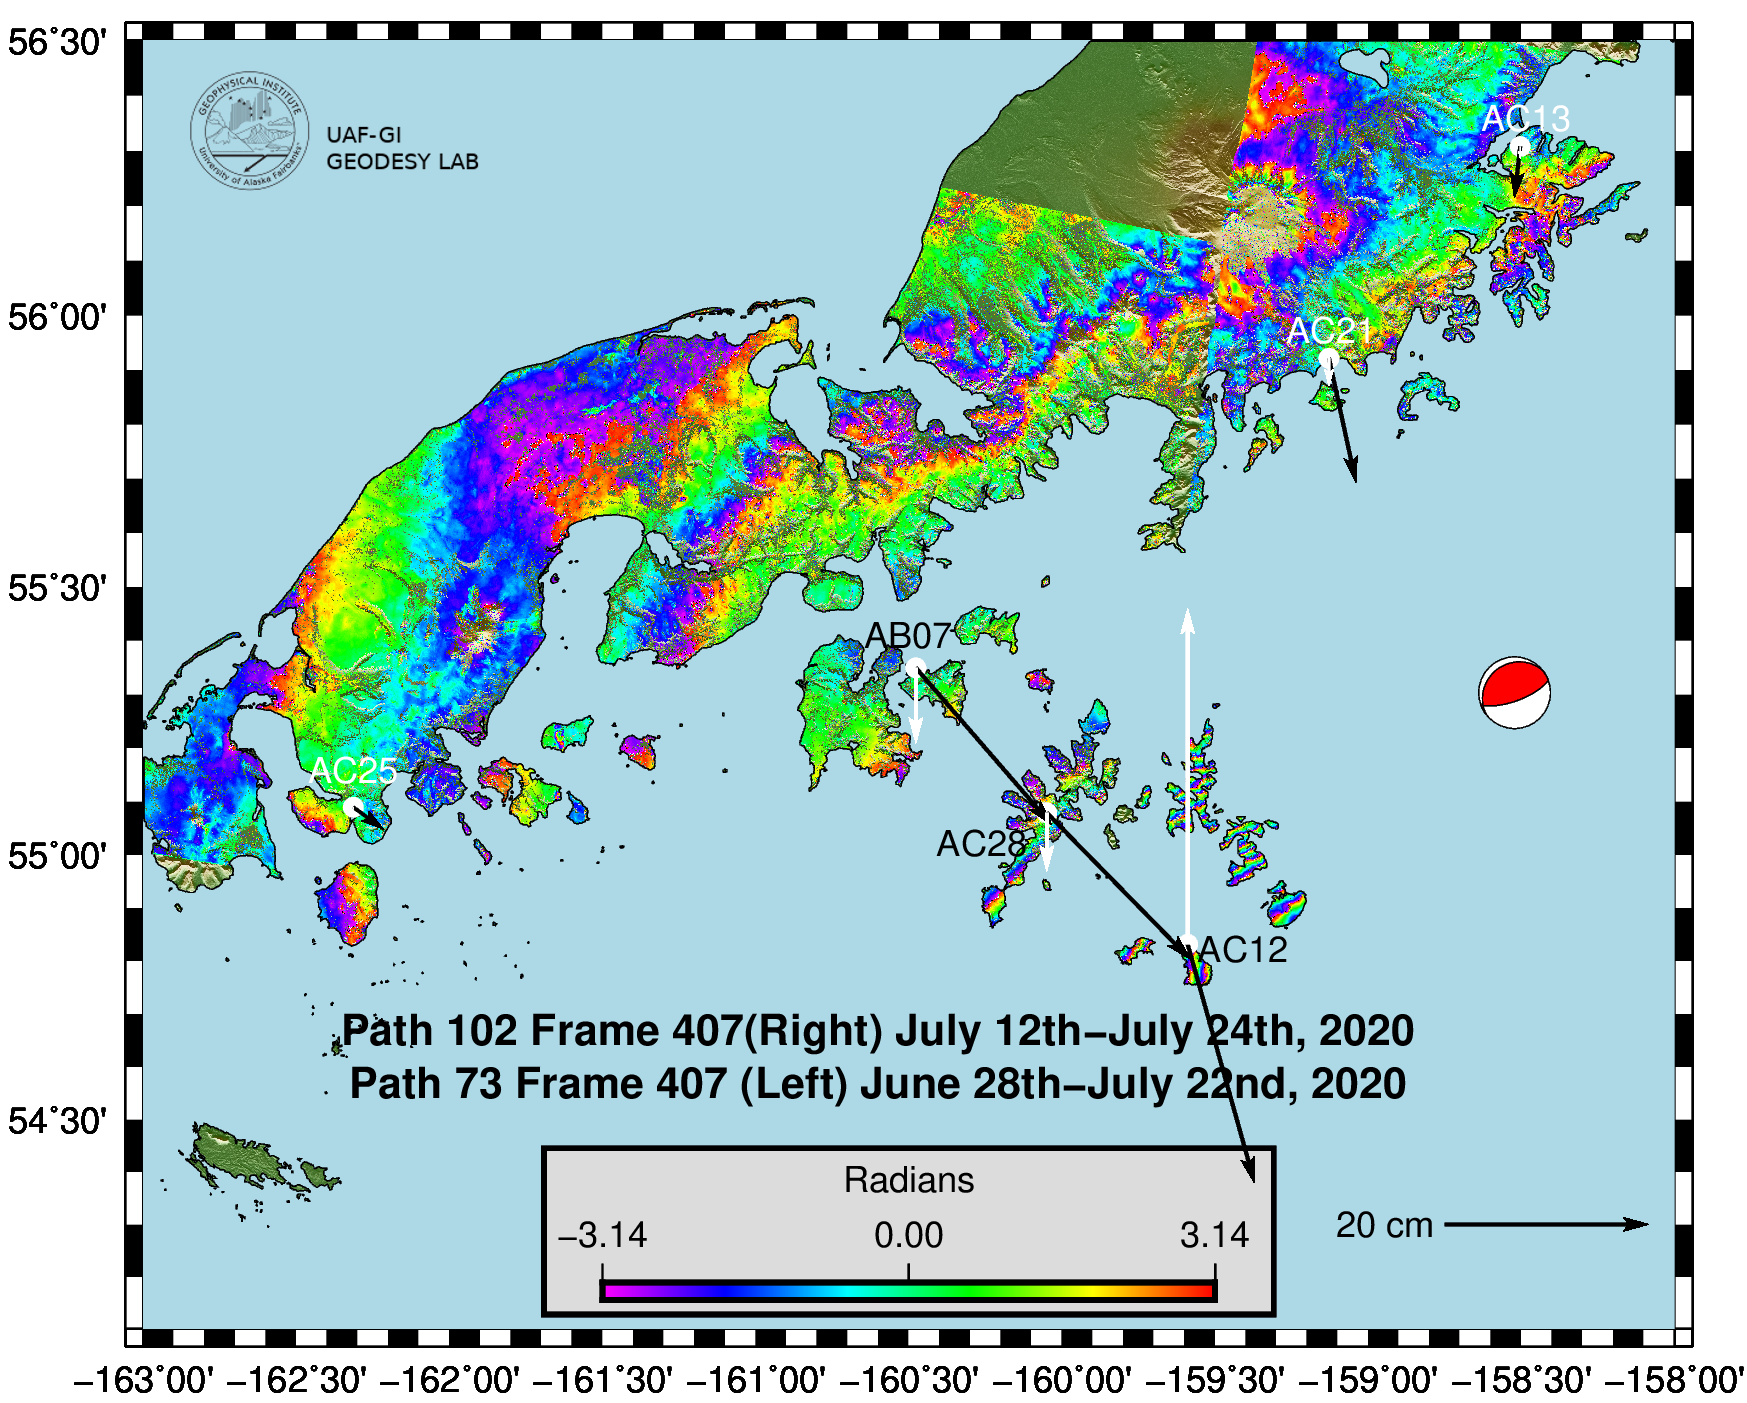
On Chernabura Island, the GPS site AC12 shows the largest permanent deformation with significant uplift of about 33 cm and about 25 cm of horizontal motion. The high number of fringes on the island suggest that absolute motion differs across this small area. On Nagai Island, where the GPS site AC28 is located and moved about 20 cm horizontally and 6 cm down, we observe a single fringe or reduced deformation as we move away from the area of highest slip on the fault. AB07, near Sand Point, shows similar horizontal motion and slightly larger subsidence at 7.5 cm, while the InSAR data are showing a somewhat broader signal across these islands. The fringes in the northern part along the mountains are likely somewhat impacted by water vapor in the atmosphere (including around Mt. Veniaminof), but this signal still contains significant (horizontal) ground motion between the values observed at AC25 (3.6cm horizontal) and AC21 (12 cm), near Perryville.
The GPS observations indicate that the “hinge line” crosses somewhere between AC12 and AC28. Here, the overriding plate motion changes from uplift, near the trench, to subsidence, further away, during earthquake slip.
High-rate GPS time series
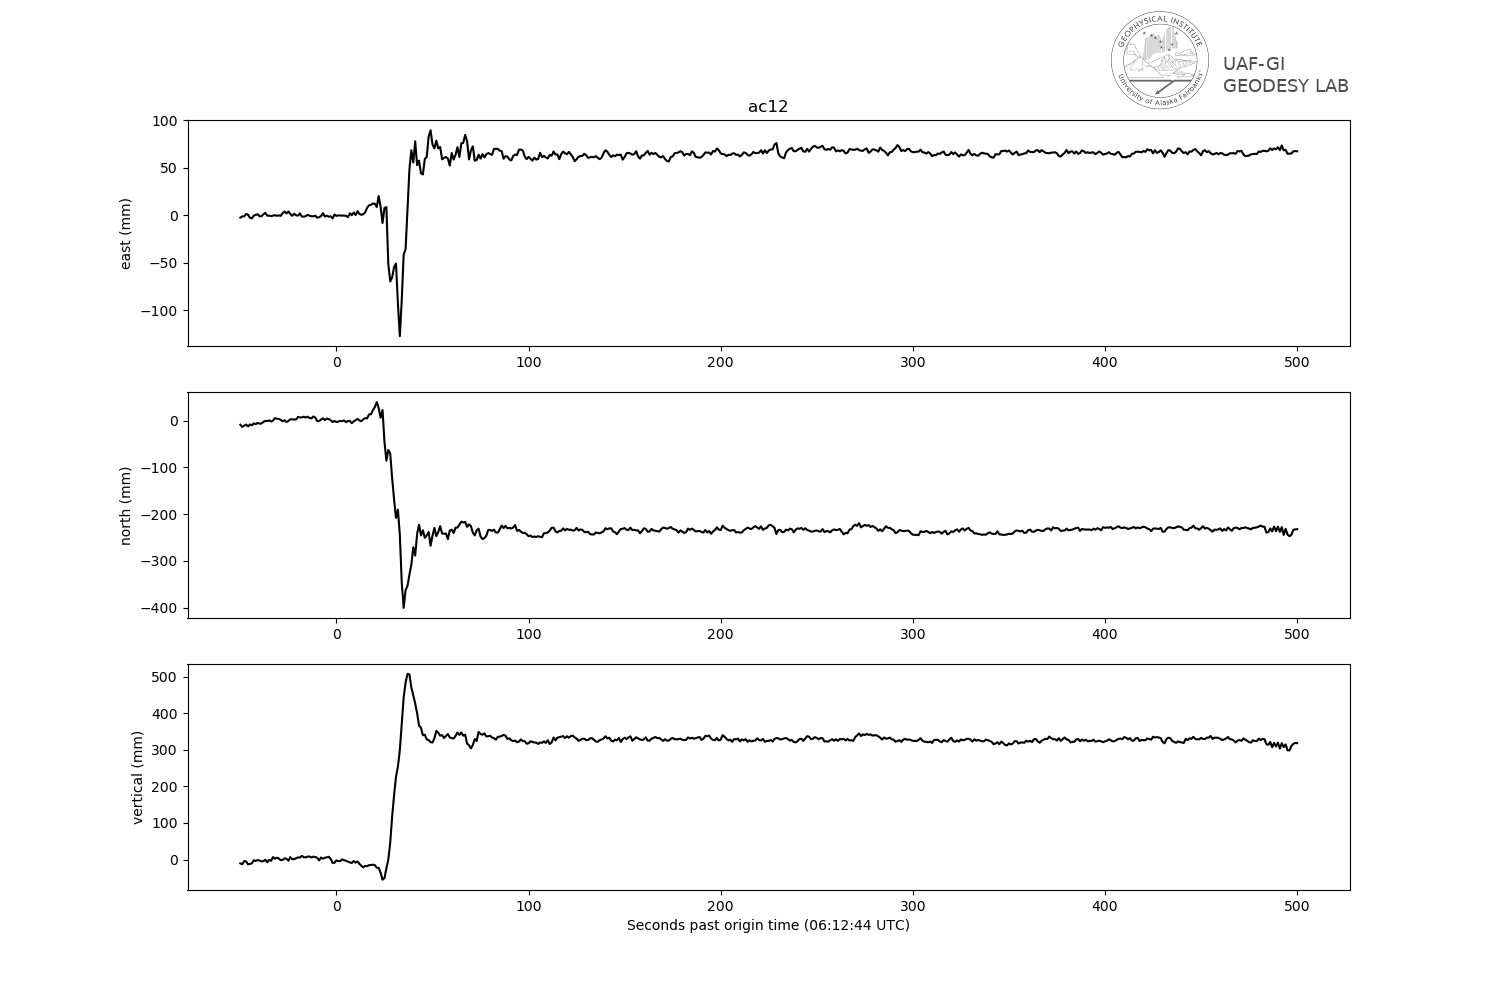
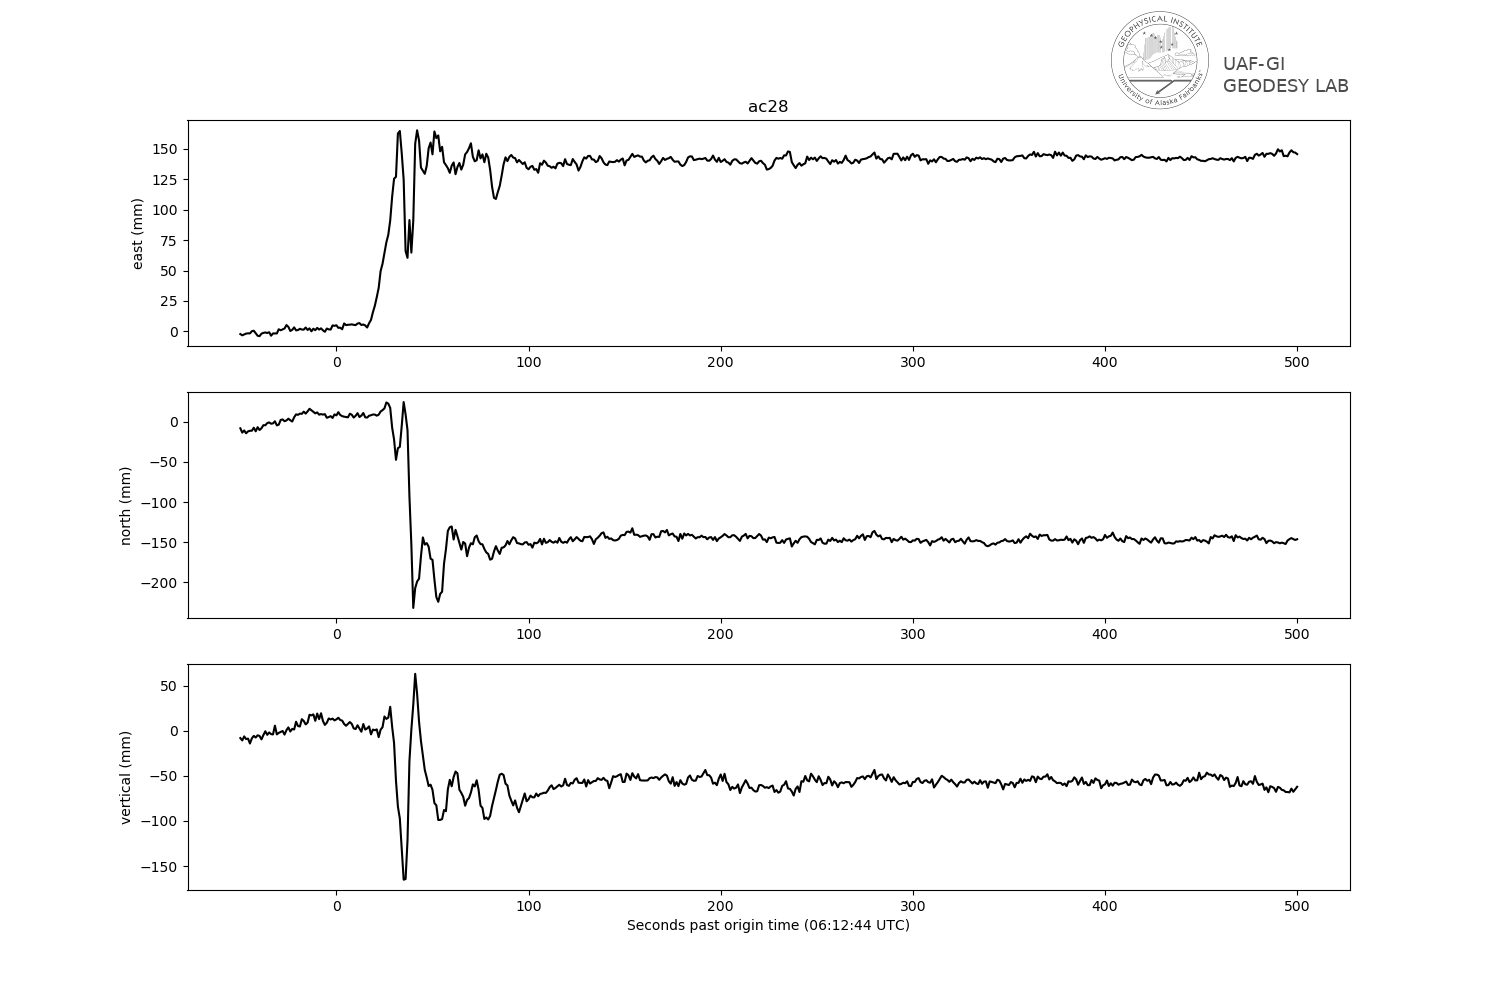
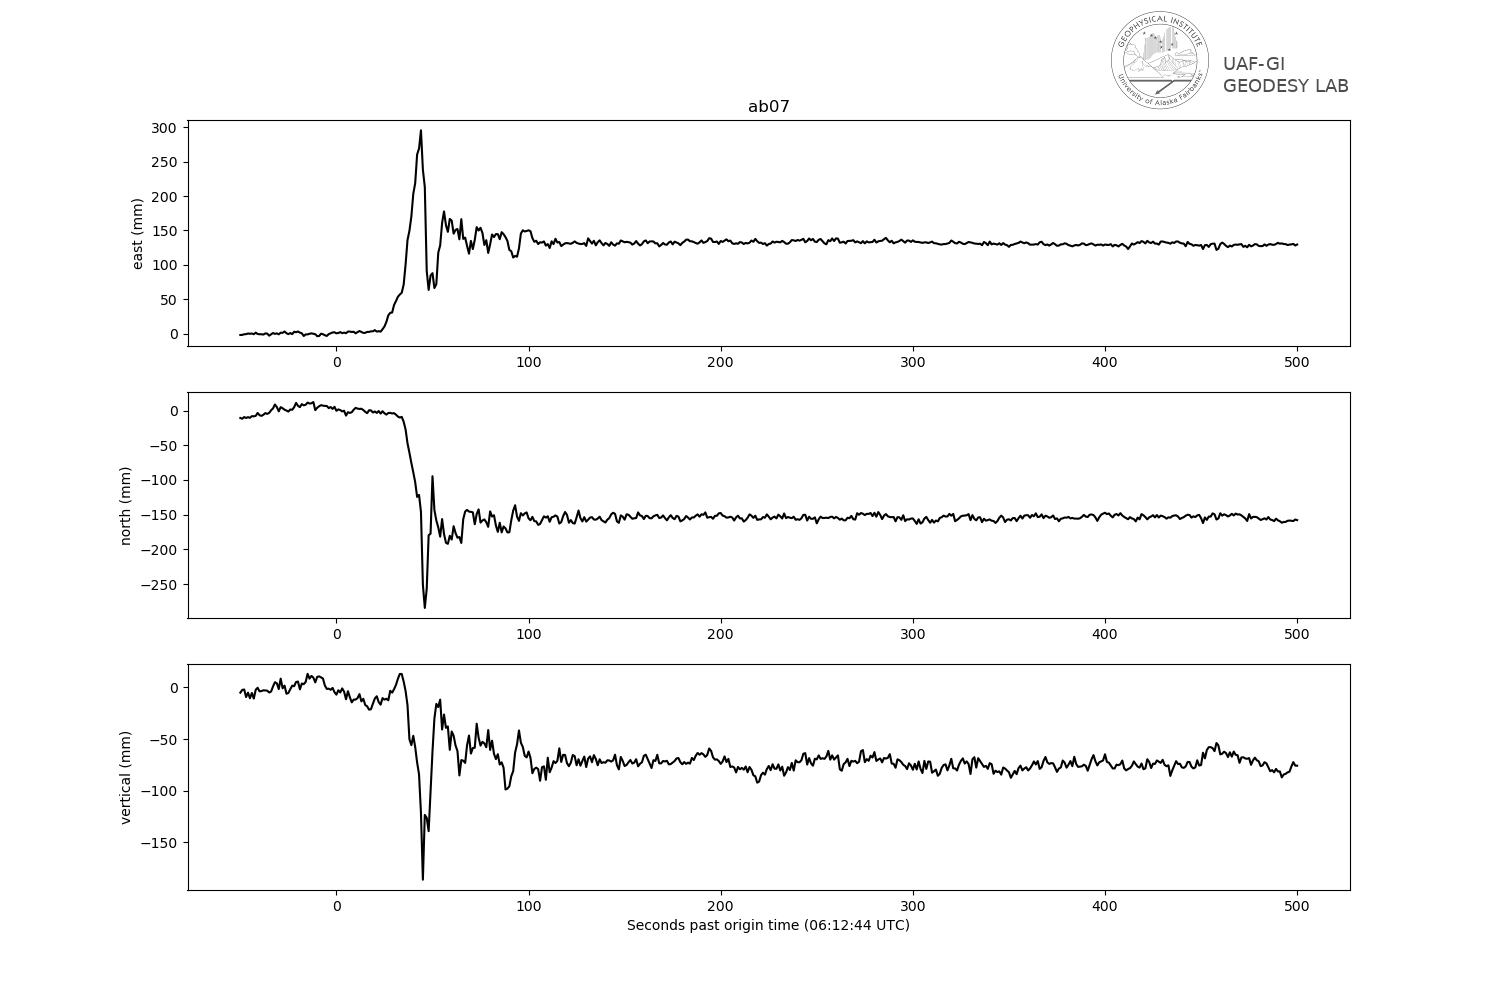
Here are three sample time series of ground motion from high-rate GPS, measured in east, north, and vertical directions, for the sites on Chernabura (AC12), Nagai (AC28) and Popof (AB07, near Sand Point) Islands. Two main things are of note: (1) the stations all show a permanent offset (which has been extracted from these time series and been plotted on the map above). This is a permanent change of the Earth's shape. (2) We see dynamic motion that may be in the opposite direction of the permanent offset, but generally is much larger than the permanent offset. This is actual ground motion due to S-waves and surface waves generated by the earthquake. Once these pass, only the permanent motion is left. Notably, AC28 and AB07 experience more and longer shaking than AC12, which is experiences the largest offset. This is likely because of site effects - softer soil or sediments can trap energy and cause much larger shaking than bedrock sites. We can also see that the time at which this change occurs depends on the distance from the slipping fault. Graphic and analysis provided by Ronni Grapenthin and Logan Fusso.
PGD magnitude
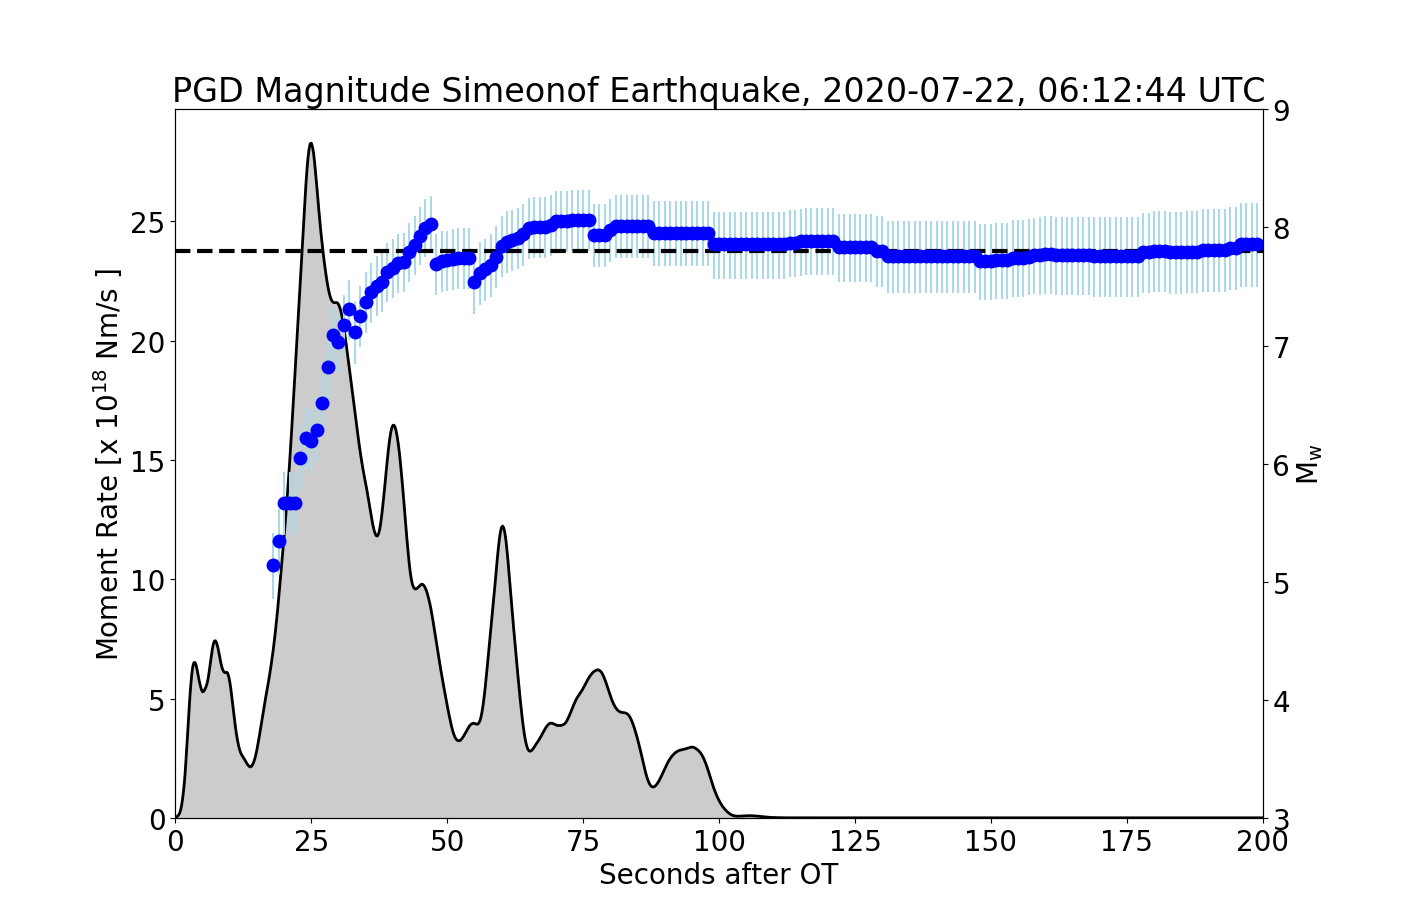
This figure shows two plots: the USGS moment rate function in gray, which represents the energy release over time as the fault slips, and a magnitude time series (blue dots) derived from the high-rate GPS data shown above. To get to magnitude from GPS ground motion, we use all three displacement components from the GPS to calculate total ground displacement time series. We then use a scaling relationship from Melgar et al. (2015) to map the highest ground displacement up to the current time to magnitude. Over time, more stations become available (sometimes visible as steps as there is little to no displacement yet) and the dynamic and static offsets manifest. With that, the magnitude grows. After about 100 seconds we arrive at a very similar magnitude to that derived from seismic data (dashed line). The vertical bars represent upper and lower magnitude limits based on the uncertainties in the scaling relationship. This processing assumes no telemetry delays and real time GPS noise. Graphic and analysis provided by Ronni Grapenthin and Logan Fusso.
Preliminary infrasound data
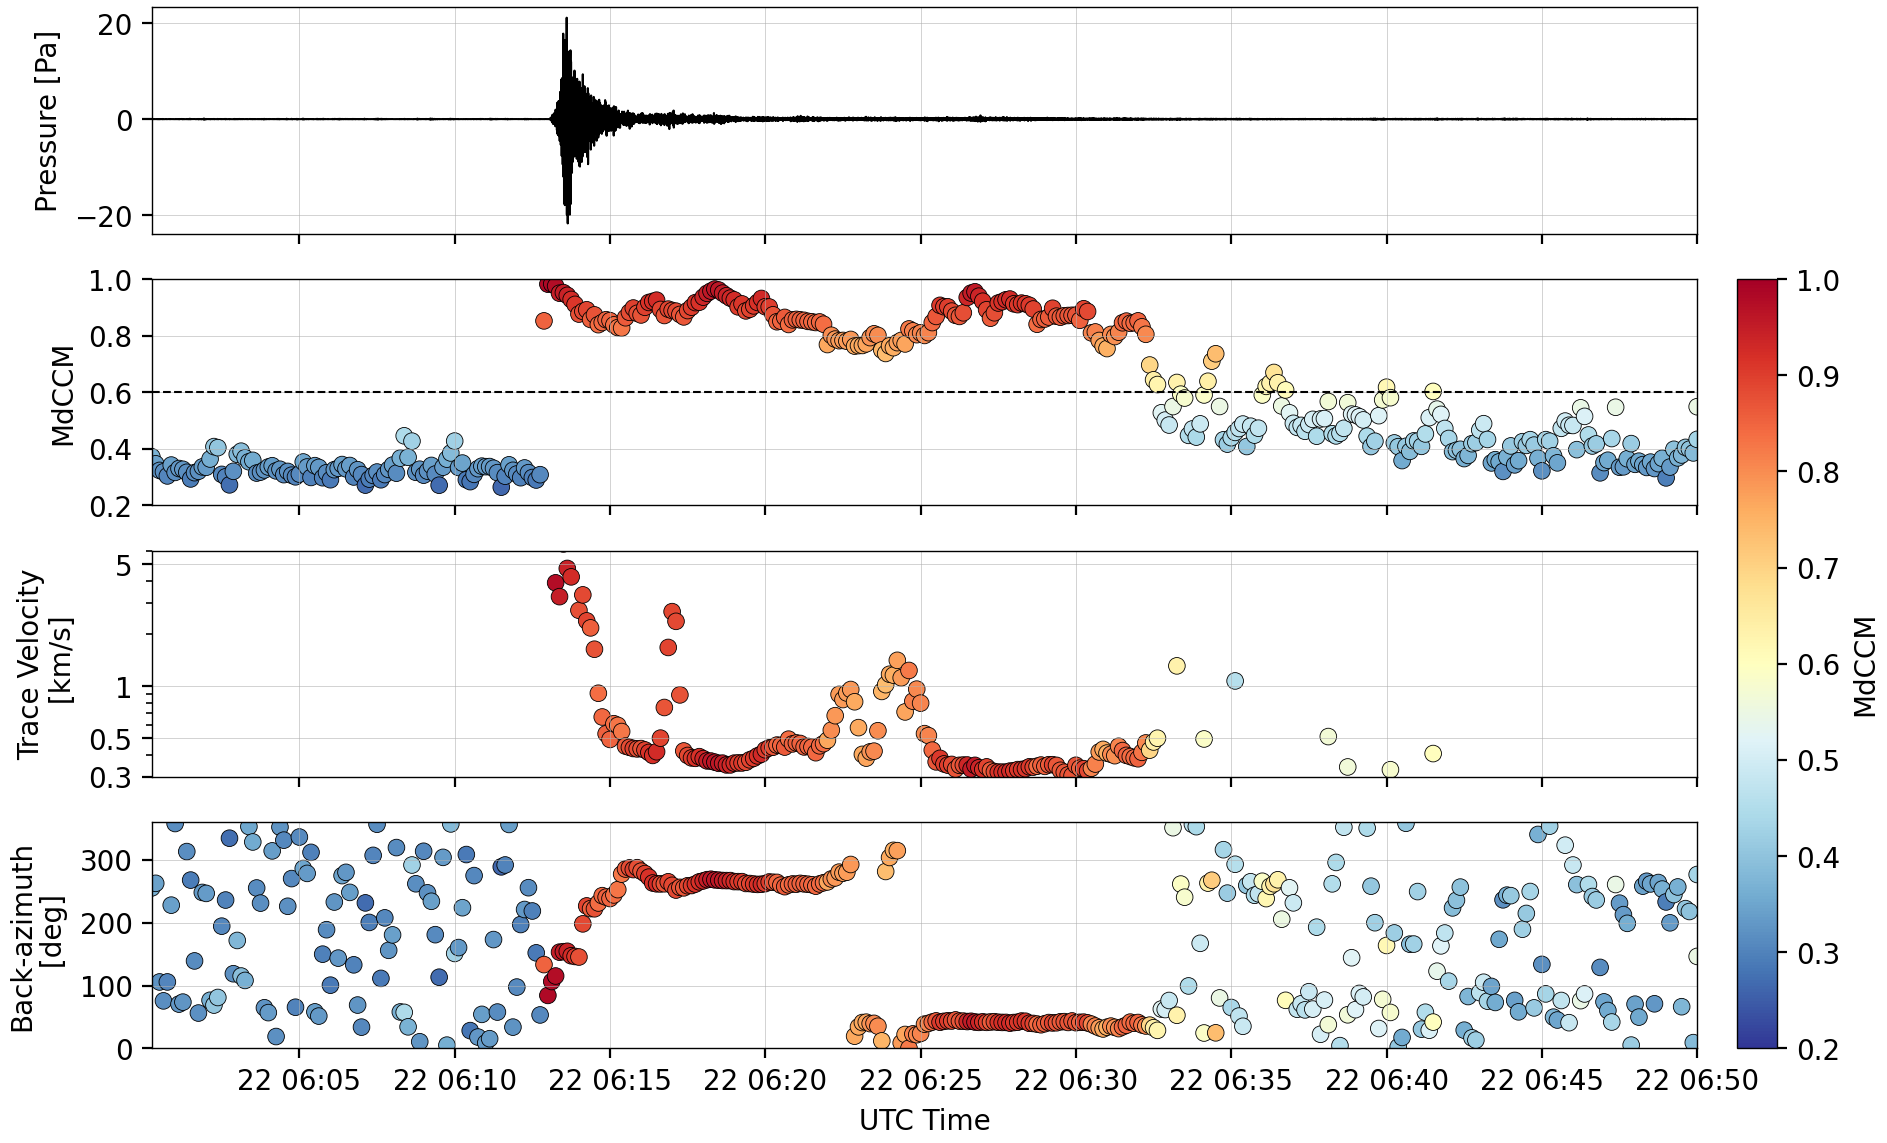
Infrasound array processing results from the Alaska Volcano Observatory infrasound array located in Sand Point. The top panel shows the infrasound waveform (pressure) followed by the peak correlation between sensors (MdCCM), wave velocity across the array (trace velocity), and bearing to the source (back-azimuth). The signal starts around 06:13 UTC with strong seismic waves traversing the array, followed by acoustic waves originating from multiple back-azimuths. The acoustic waves are likely generated by strong shaking of mountain ranges. This graphic and its interpretation was provided by UAF Professor David Fee with the Alaska Volcano Observatory and Wilson Alaska Technical Center.
Website news stories on this event
M7.8 earthquake near Simeonof Island
M7.8 Simeonof Earthquake Recorded Globally
The unusual M7.6 aftershock of the M7.8 Simeonof earthquake
Partner organizations with event pages
USGS Simeonof event page
USGS M7.6 aftershock event page
UNAVCO event response
SARVIEWS Hazards website
We will continue to update this page as we learn more