


Our staff spend much of their time each summer working in the field on the stations that make up our seismic network, but the work of maintaining these stations is not limited to the summer or even to the field. Much of the important work is done ahead of time, in the comfort of the lab, where we review our diagnostics for clues that can tell us what is wrong at a station before we get there. This diagnostic "state-of-health" data comes in alongside the seismic data, over the same communication links.
The state-of-health information consists of a dozen or more data channels that describe voltage, current, temperature, and other parameters reported by radios, dataloggers, charge controllers, and other equipment. A knowledgeable technician can use this information to tell a story about what is happening at the station, without ever leaving the lab.
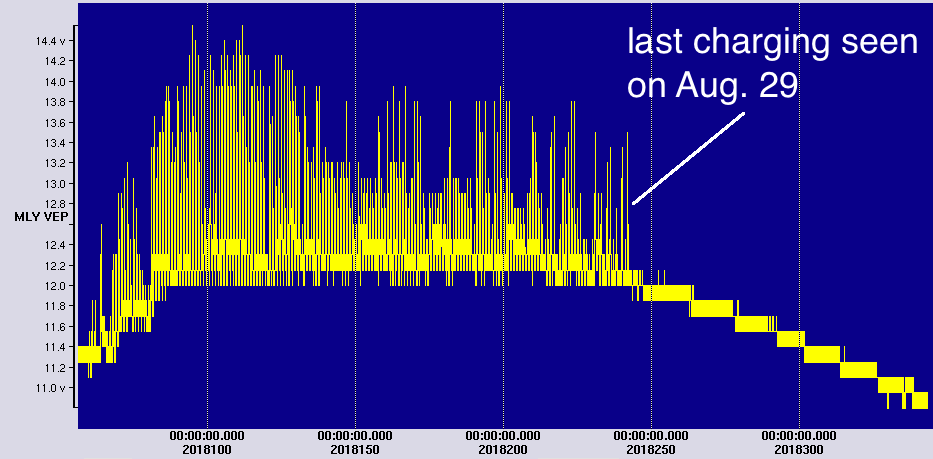
For example, Figure 1 shows how the battery voltage varied over a year at a station near Manley Hot Springs. Every day the battery voltage rises as the sun charges the batteries, and every night the voltage drops as it gets dark. This plot shows that in late August, the daily increase in voltage stopped abruptly. We know that the sun did not stop shining, and we know based on diagnostics from past years that the voltage should trend down as the days become shorter, but that we should still see daily increases into October or November. This change in the charging pattern is a clue that suggests there is a problem with the solar charging system, and that is what our technicians found when they visited the site.
The utility in the diagnostic information is not just in how we can use it to identify the potential cause of an outage—it is also very useful to be able to rule things out. The story that the diagnostics tell allows us to narrow the scope of our work in the field, saving time and money.
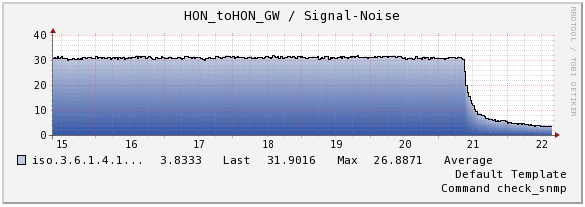
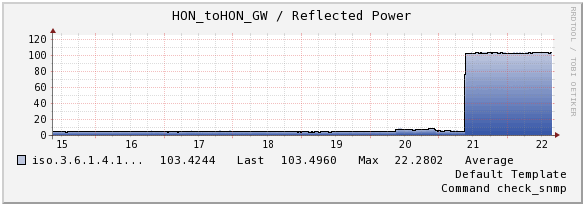
Figure 2 shows the Signal-to-Noise Ratio (SNR) reported by the radio at a repeater site near the Parks Highway. It shows that the SNR was high until the 21st, when it fell rapidly. There are a few reasons why this might happen, and the information in Figure 3 provides another clue. It shows that the power reflected back to the radio through the transmission line connected to the antenna increased marginally on the 20th, then rose rapidly on the 21st, coinciding with the SNR change. This informs our planning by telling us that we will likely find a problem with a cable, the antenna, or a connector between them. Along with stable power diagnostics during the same period, it also tells us that we probably won't find a problem with the power system and should not spend time planning a power system repair. In the field, we found that the weight of snow had pulled a poorly-routed cable out of the connector on the antenna. They were able to replace the cable and install the new one in a safer place.
These are small improvements, but over time they amount to higher reliability of the network. We are looking for ways to improve our diagnostic capabilities, and we expect that these types of improvements will lead to more consistent performance of our stations.