


Knowing where to go during an evacuation is crucial to survival when you are in a tsunami hazard zone. But how do emergency managers and planners decide where the safe zones are and where to stage assembly areas in a community?
For many years the Alaska Earthquake Center has been delivering tsunami inundation maps to coastal communities in Alaska. These maps show the maximum estimated extent of flooding following a tsunami. The inundation map is just a first step in helping at-risk coastal residents. A significant component of tsunami risk reduction is educating residents about potential tsunamis and preparing them for such events.
Preparing a community for future tsunamis requires not only an understanding of the hazards faced, but how residents are exposed to those hazards. This can be difficult to estimate because people in different parts of a community are exposed to different aspects of the hazard, and some residents may be more vulnerable mobility issues, language or cultural limitations, or how well they are prepared to evacuate.
One resource currently in development to assist communities in Alaska is pedestrian evacuation modelling. These models are generated using a tool developed by the USGS to determine how long it would take for pedestrians to reach safety after a rapid-onset natural disaster, such as a local tsunami or flash flood. Time estimates include factors such as elevation (i.e. how steep the path is), land cover (maintained road, sand, grass, forest, buildings, rivers, etc.) and travel speed of the evacuee (walking, running or driving).
The primary goals of the models are: 1. To understand whether or not residents would be able to reach safety in time based on the hazards the community faces. 2. Determine what landscape or urban features would prevent successful evacuation, for example fences. 3. To establish where and how many assembly areas are needed for a given community. 4. To help emergency managers and first responders identify primary evacuation routes to ensure proper maintenance, lighting and evacuation signs. The full methodology is described in this paper.
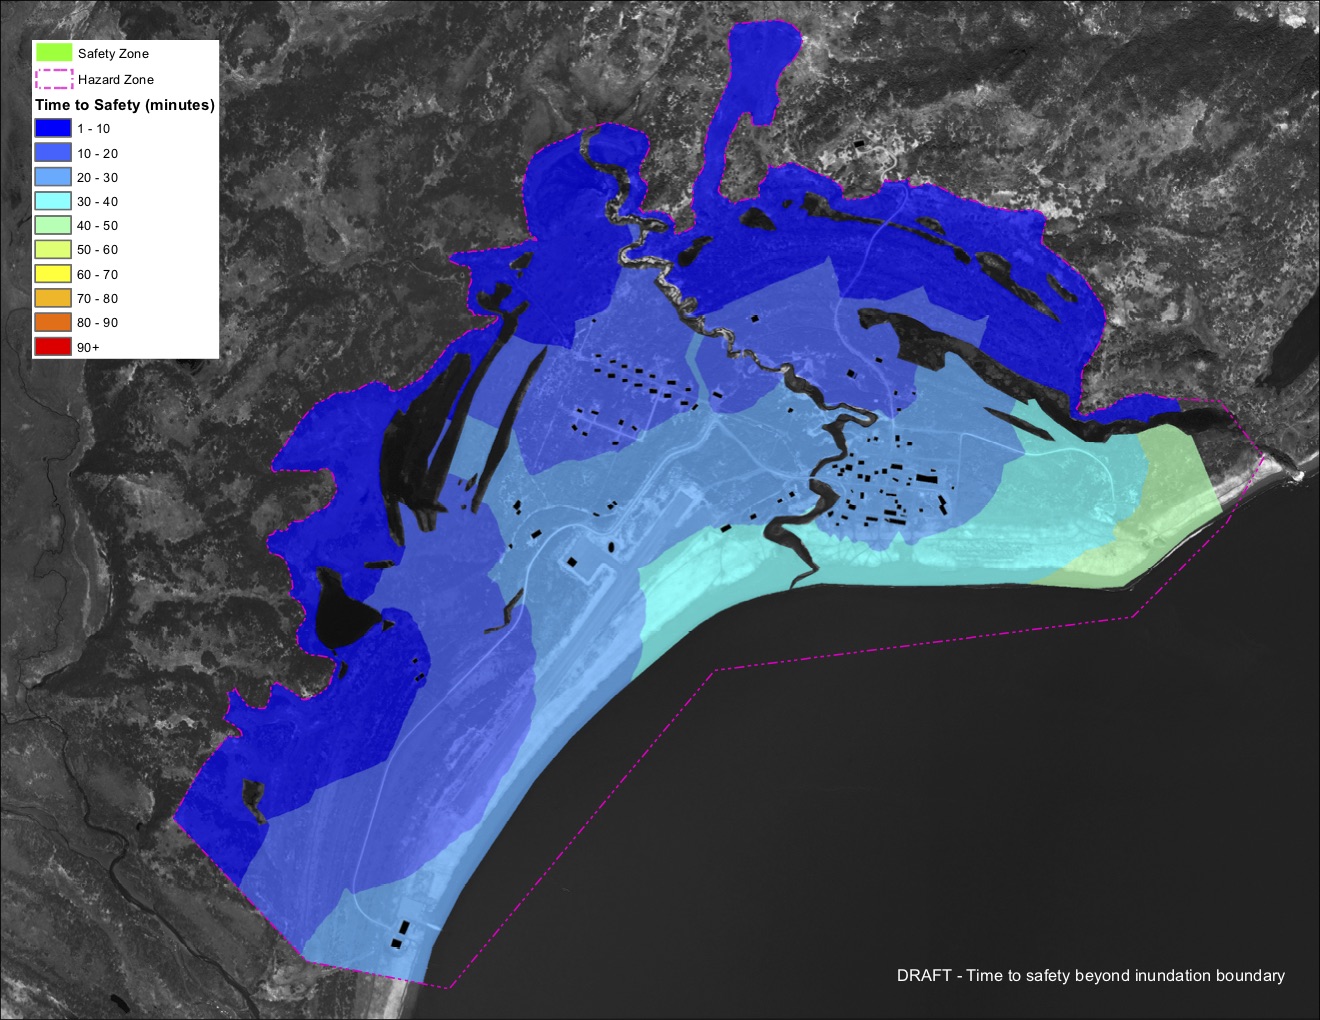
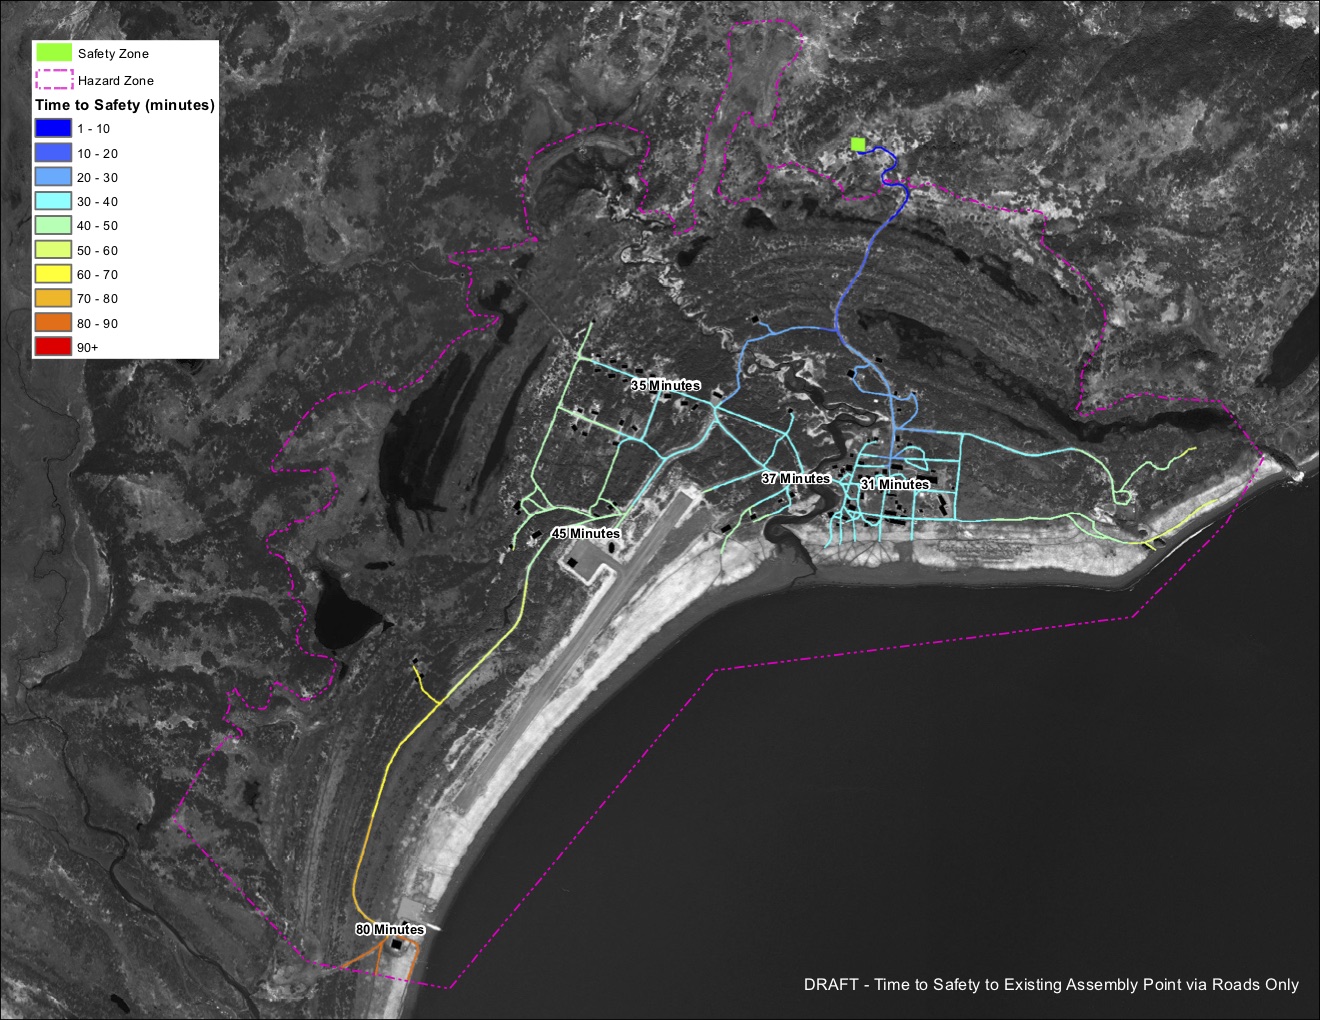
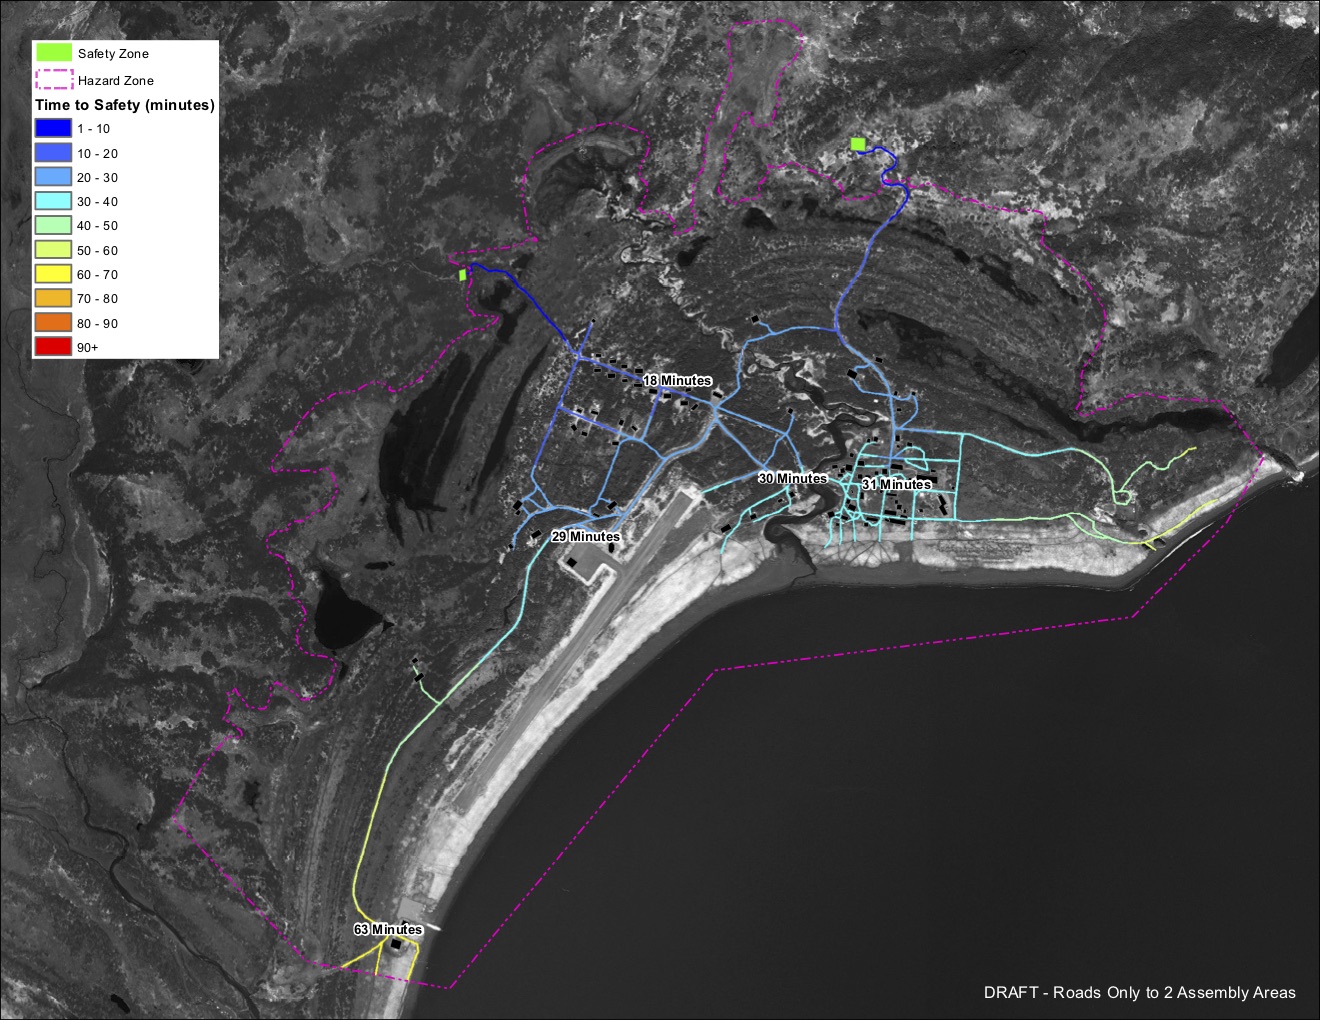
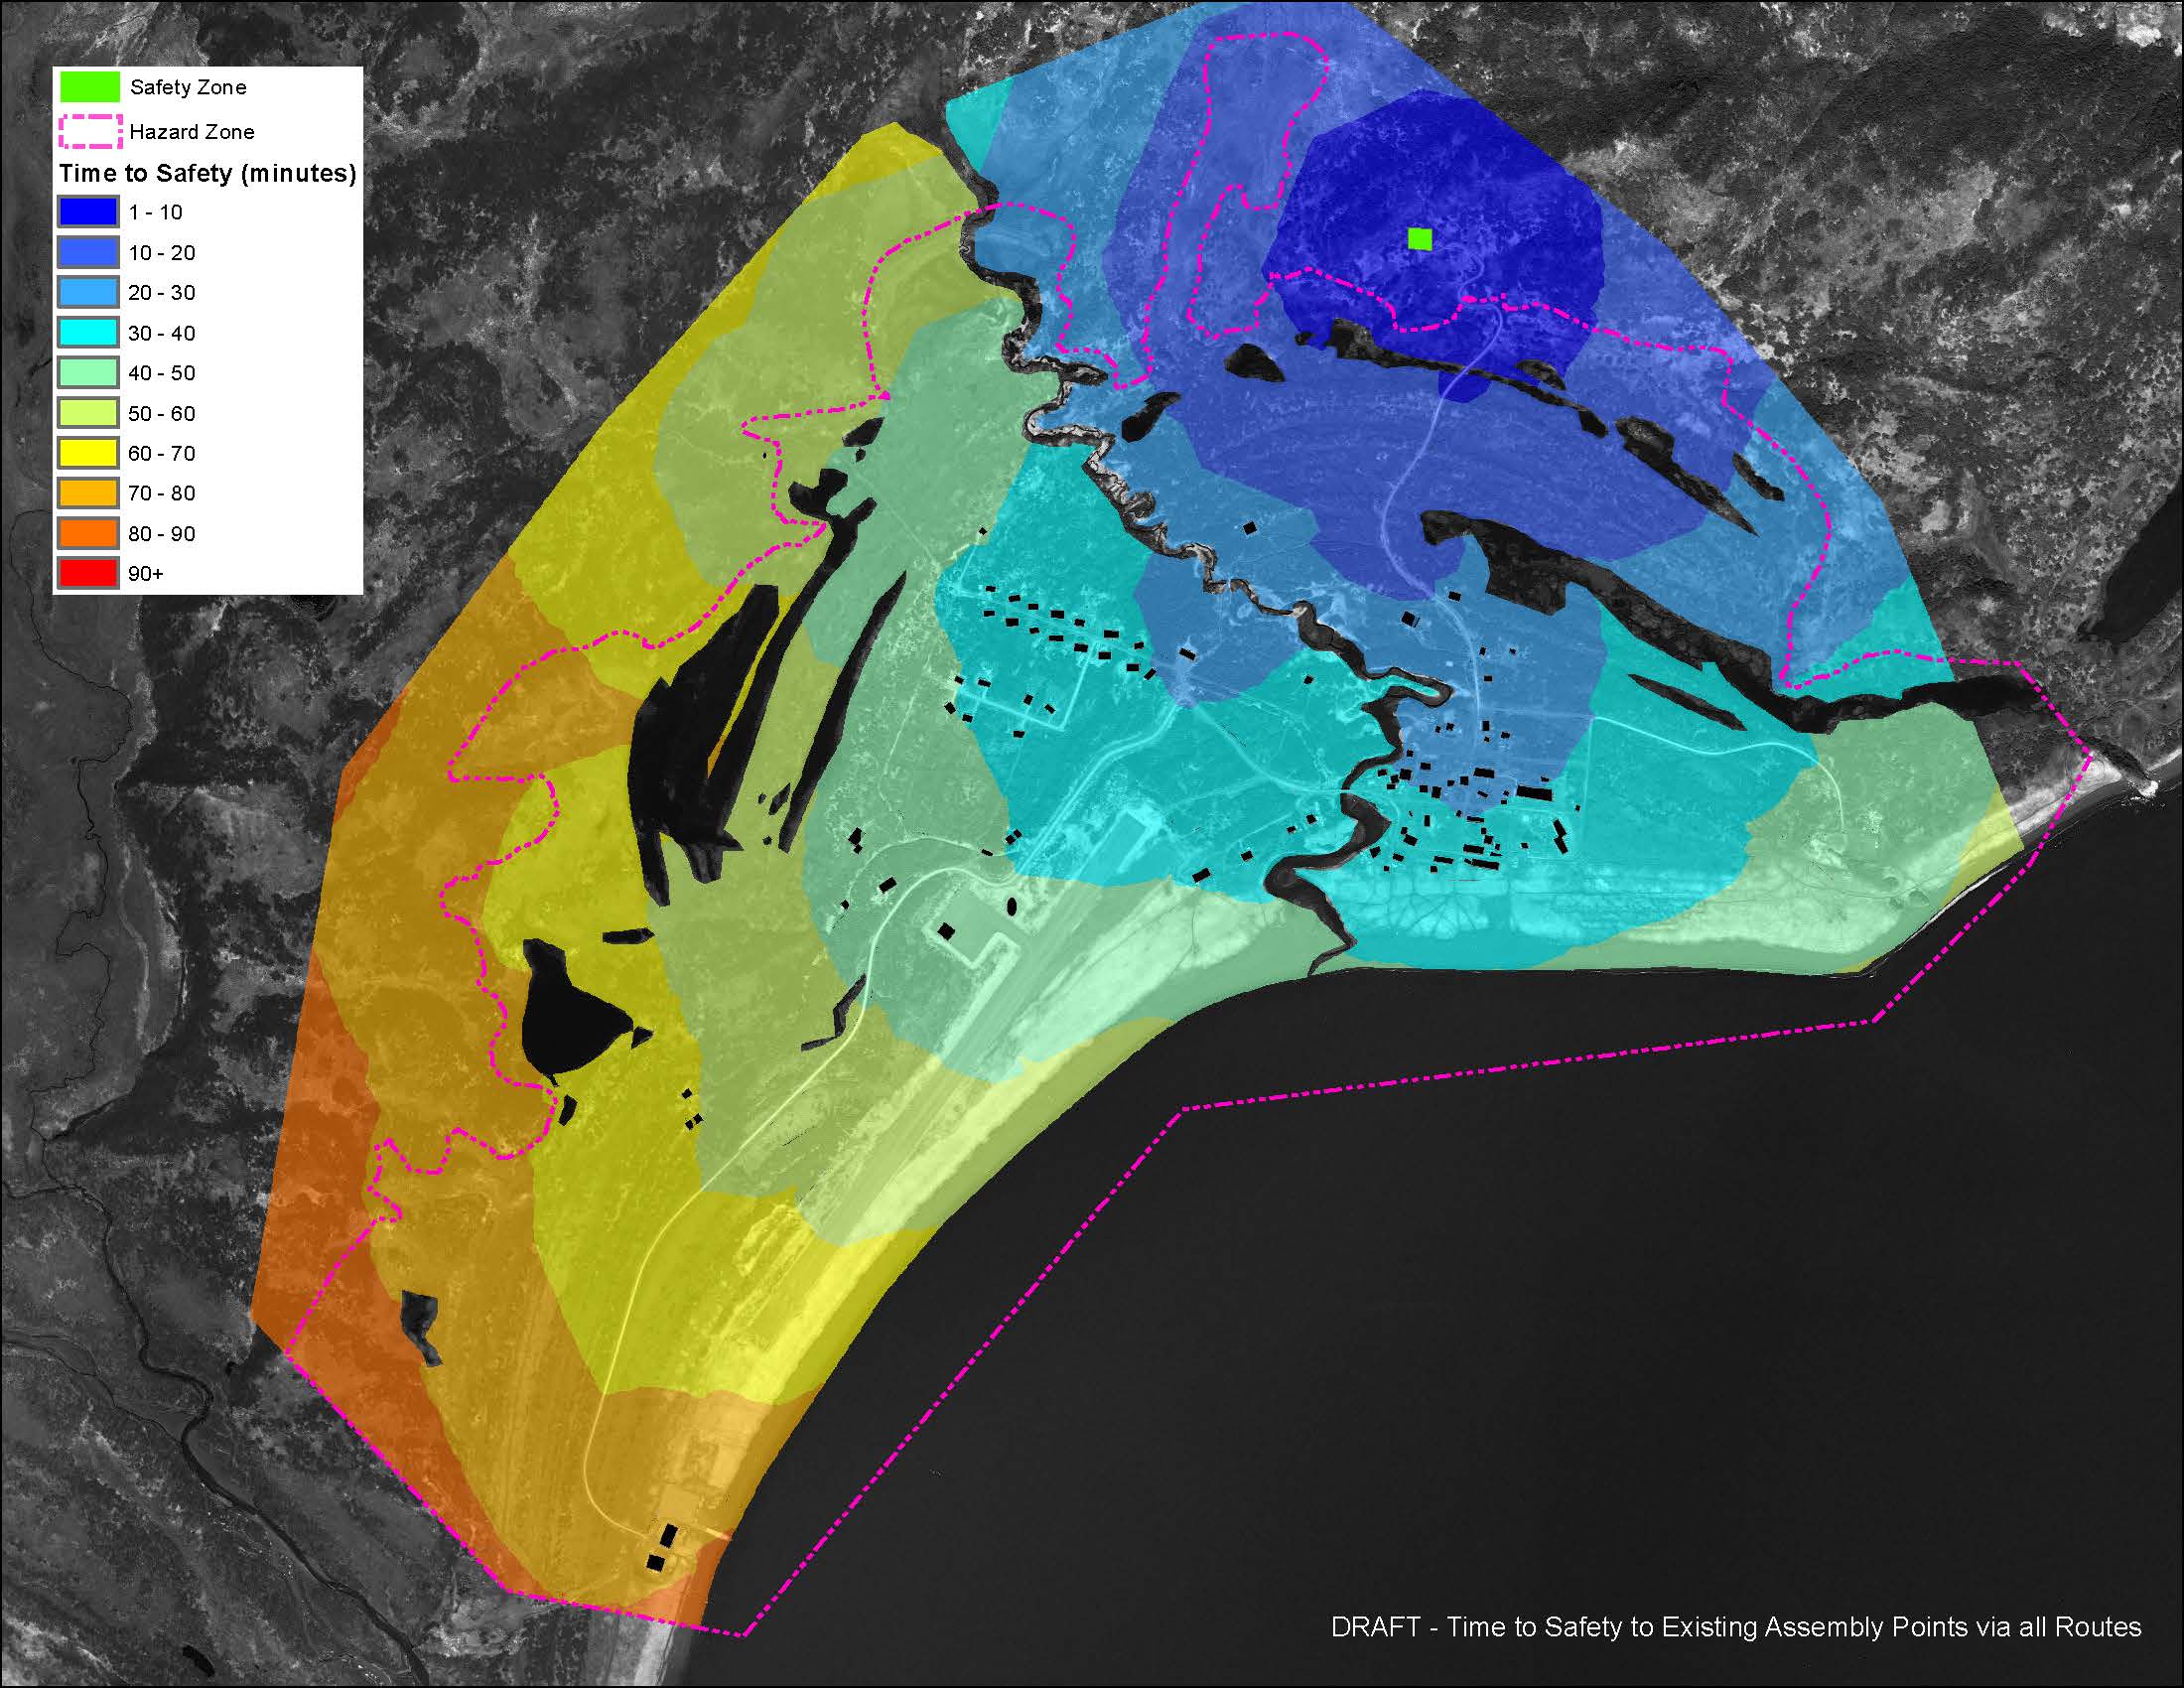
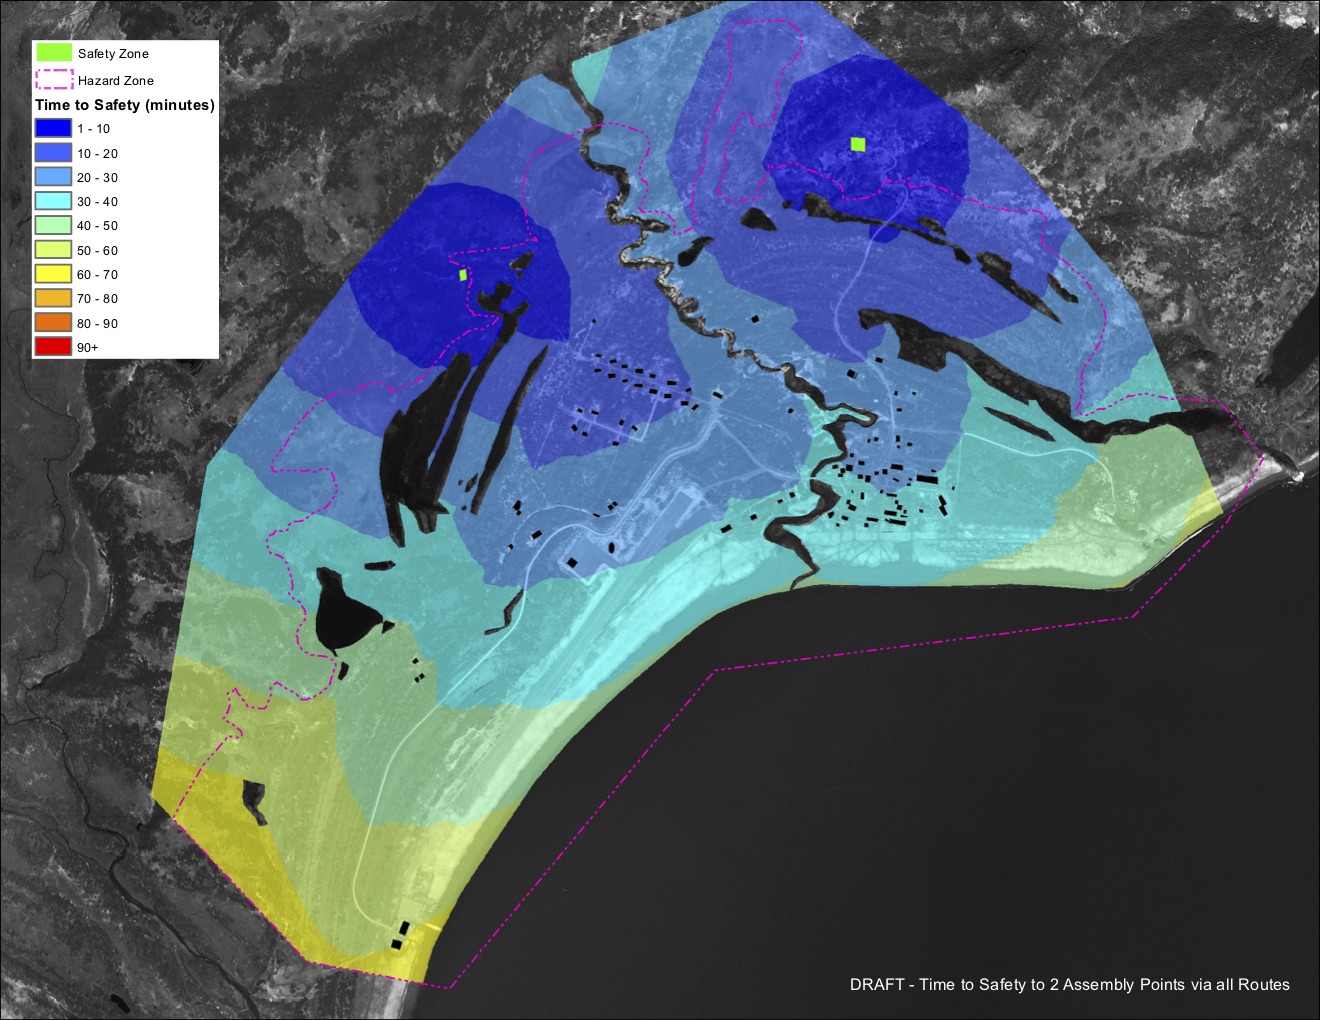
The hazard boundaries determined by the tsunami inundation mapping project are used in determining the safe zone in the evacuation models. The following illustrative DRAFT models show various scenarios for evacuation by walking at a “slow walk” (about 2 miles per hour). Figure 1 shows time estimates for pedestrians in the hazard zone to reach safety while travelling any path over any terrain. Figure 2 shows time estimates for pedestrians walking at the same pace along roads only. Figure 2 is modeled assuming there is only one road that leads beyond the hazard zone. Figure 3 shows the difference adding a second road and assembly point would have on evacuation times. Figures 4 and 5 show the travel time to one and two assembly areas, respectively, via any path over any terrain.
Before the draft maps are published they are tested for accuracy. Communities are visited and a subset of road-based routes are walked and timed, then compared to the model results.
This illustrative example would show emergency managers in this community that a second assembly point in the west would cut evacuation time upwards of ten minutes for certain areas. It would then be up to the emergency managers to assess the amount of evacuation time needed, and to determine if a second assembly point would be beneficial to the community based on the existing threat.
Currently this kind of evacuation modeling and mapping has been done in four Alaska communities: Chignik Bay, Homer, King Cove, and Unalaska/Dutch Harbor. Mapping for three additional communities, Whittier, Kodiak and Perryville, is currently underway.
*DISCLAIMER: The developed pedestrian travel-time maps have been completed using the best information available and are believed to be accurate; however, their preparation required many assumptions. Actual conditions during a tsunami may vary from those assumed, so the accuracy cannot be guaranteed. Areas inundated will depend on specifics of the earthquake, any earthquake-triggered landslides, on-land construction, tide level, local ground subsidence, and may differ from the areas shown on the map. Information on this map is intended to permit state and local agencies to plan emergency evacuation and tsunami response actions. The Alaska Earthquake Center and the University of Alaska Fairbanks make no express or implied representations or warranties (including warranties of merchantability or fitness for a particular purpose) regarding the accuracy of neither this product nor the data from which the pedestrian travel time maps were derived. In no event shall the Alaska Earthquake Center or the University of Alaska Fairbanks be liable for any direct, indirect, special, incidental or consequential damages with respect to any claim by any user or any third party on account of or arising from the use of this map.