

These plots show the long-period seismic energy near northwestern Prince William Sound. The map view (left) displays color gradients of seismic coherency, where red colors suggest higher seismic coherency, potentially indicating a landslide or an M3+ earthquake. The waveforms (right) are ordered and time-shifted by distance from Barry Arm. When seismic energy originates close to Barry Arm, the traces align in time and are larger at the top of the display.
Examples
Normal background. There are no areas of coherence on the map. There are a few noisy seismic traces, but no consistency across the network. 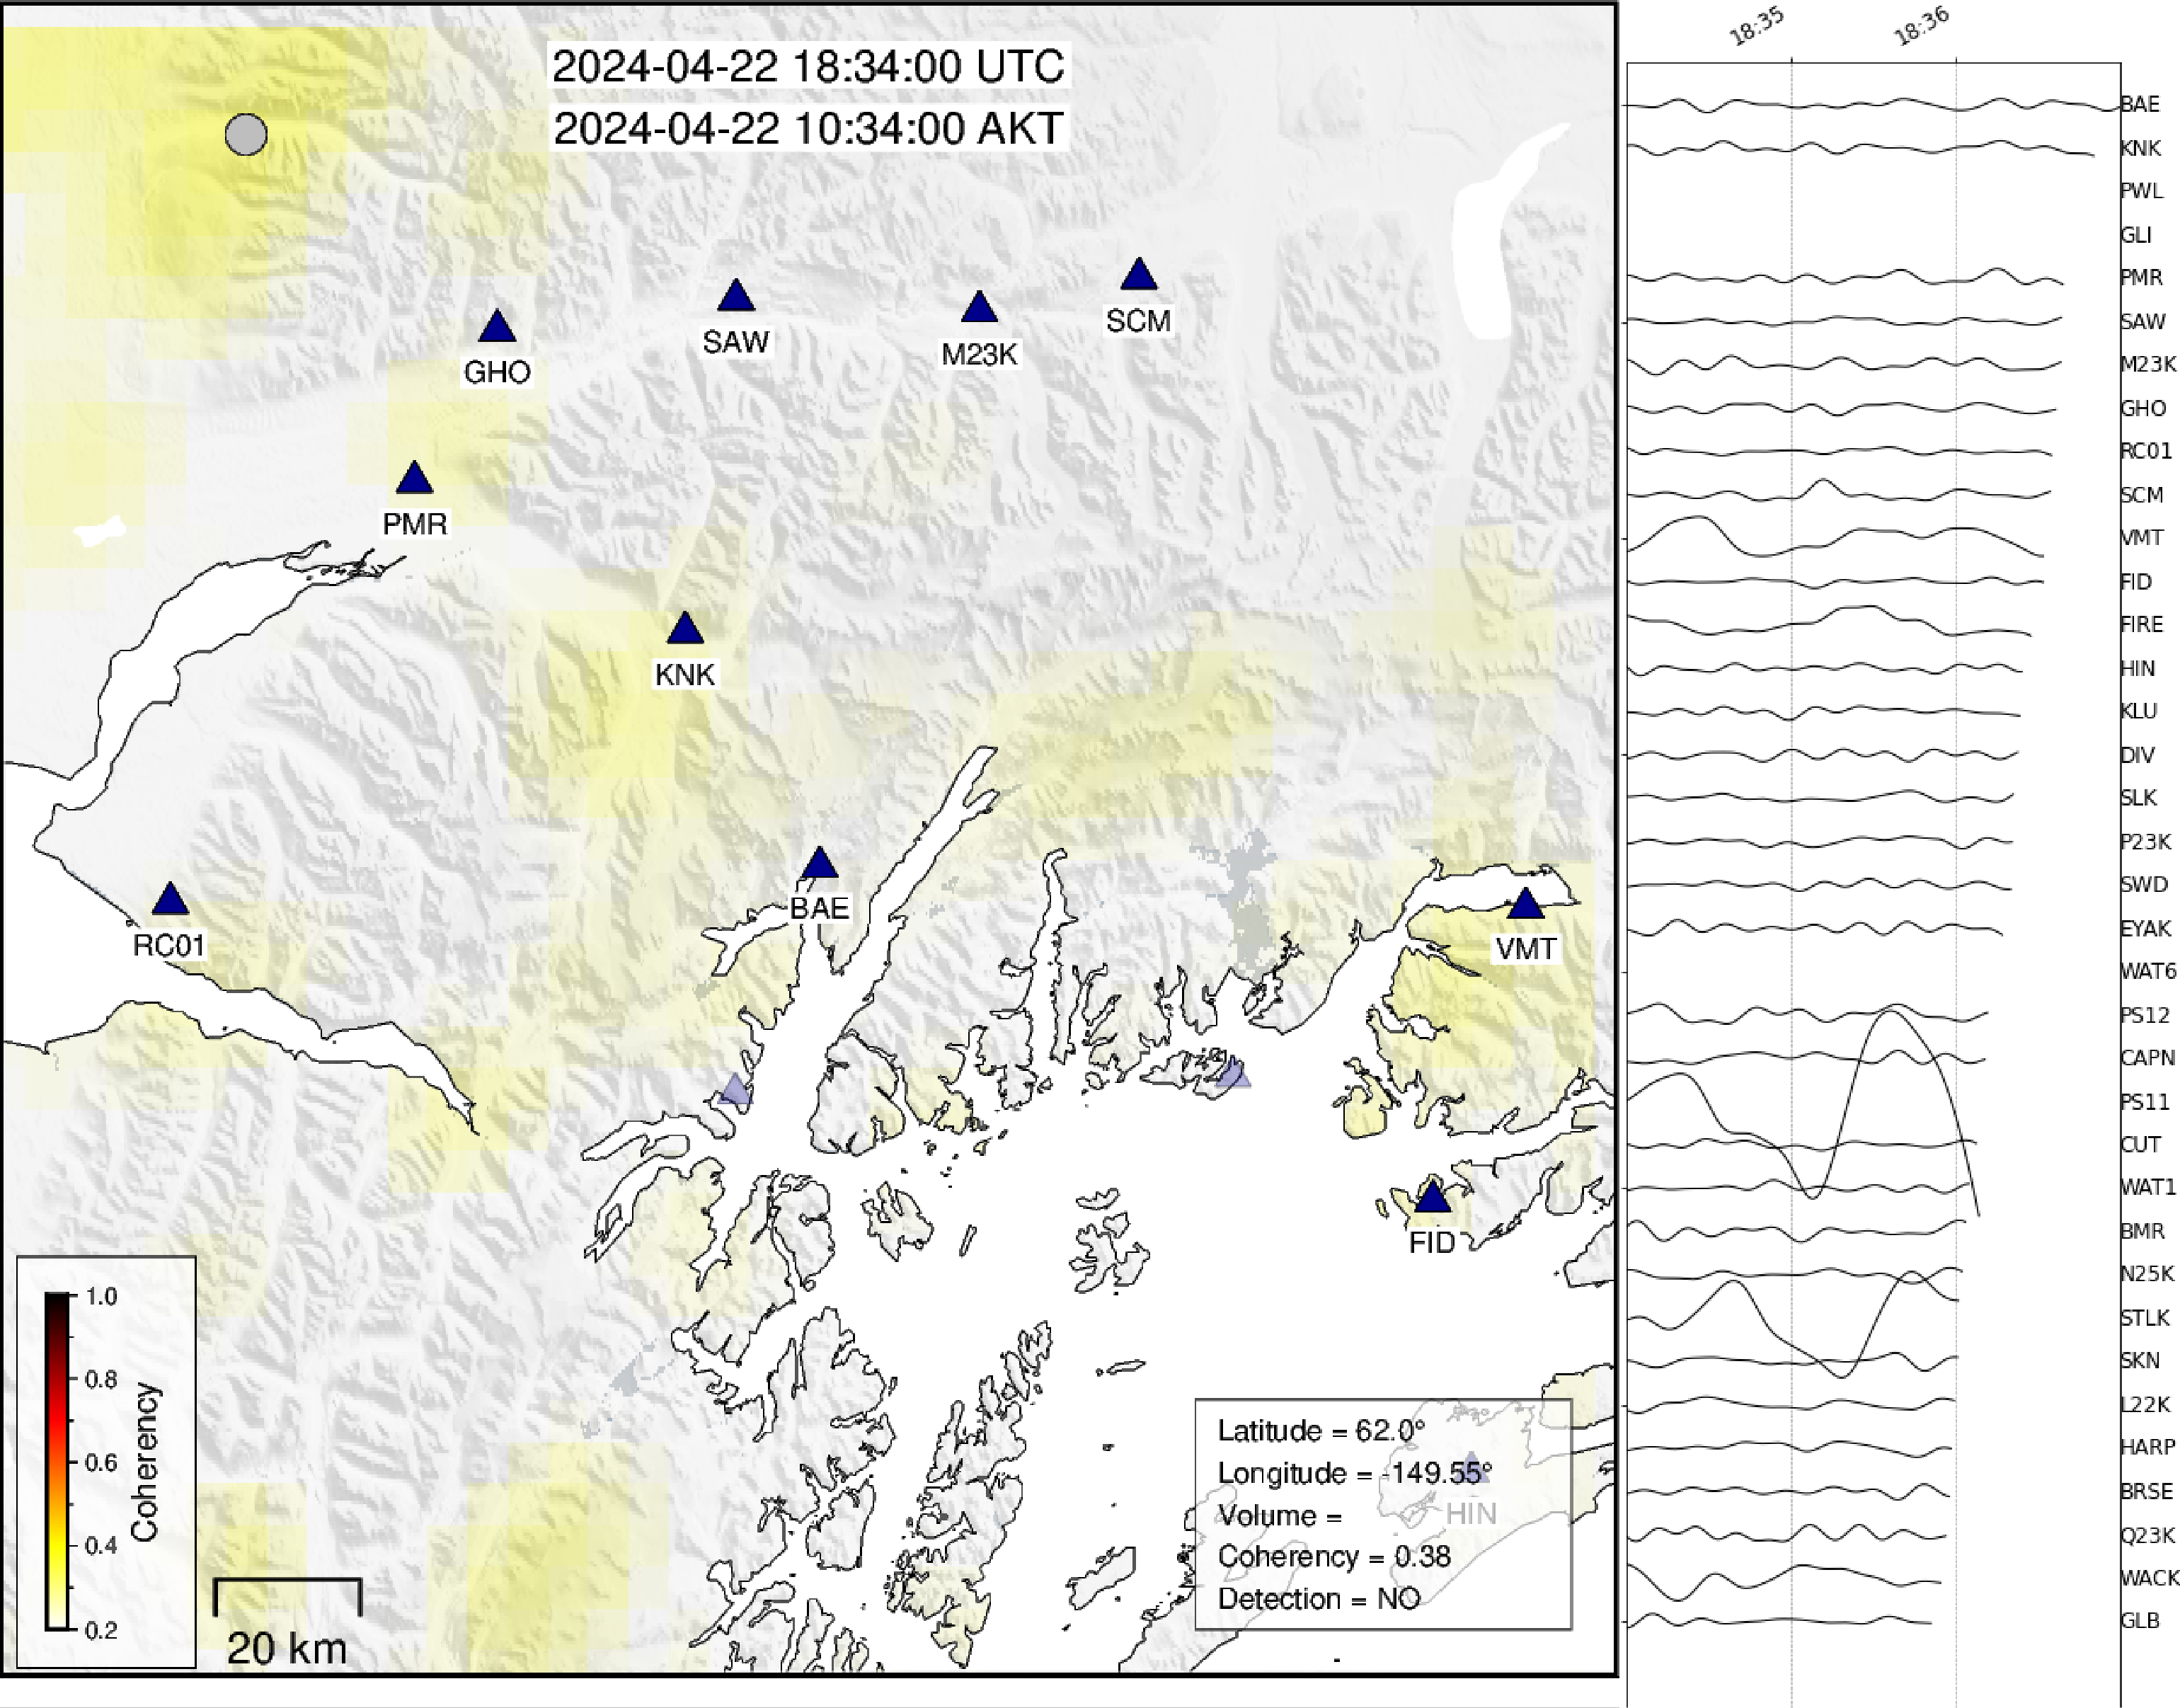
Landslide 15km from Barry Arm. Waveforms align in time relatively well and have larger amplitudes close to Barry Arm, decaying with distance. Landslide energy is highligted in purple. 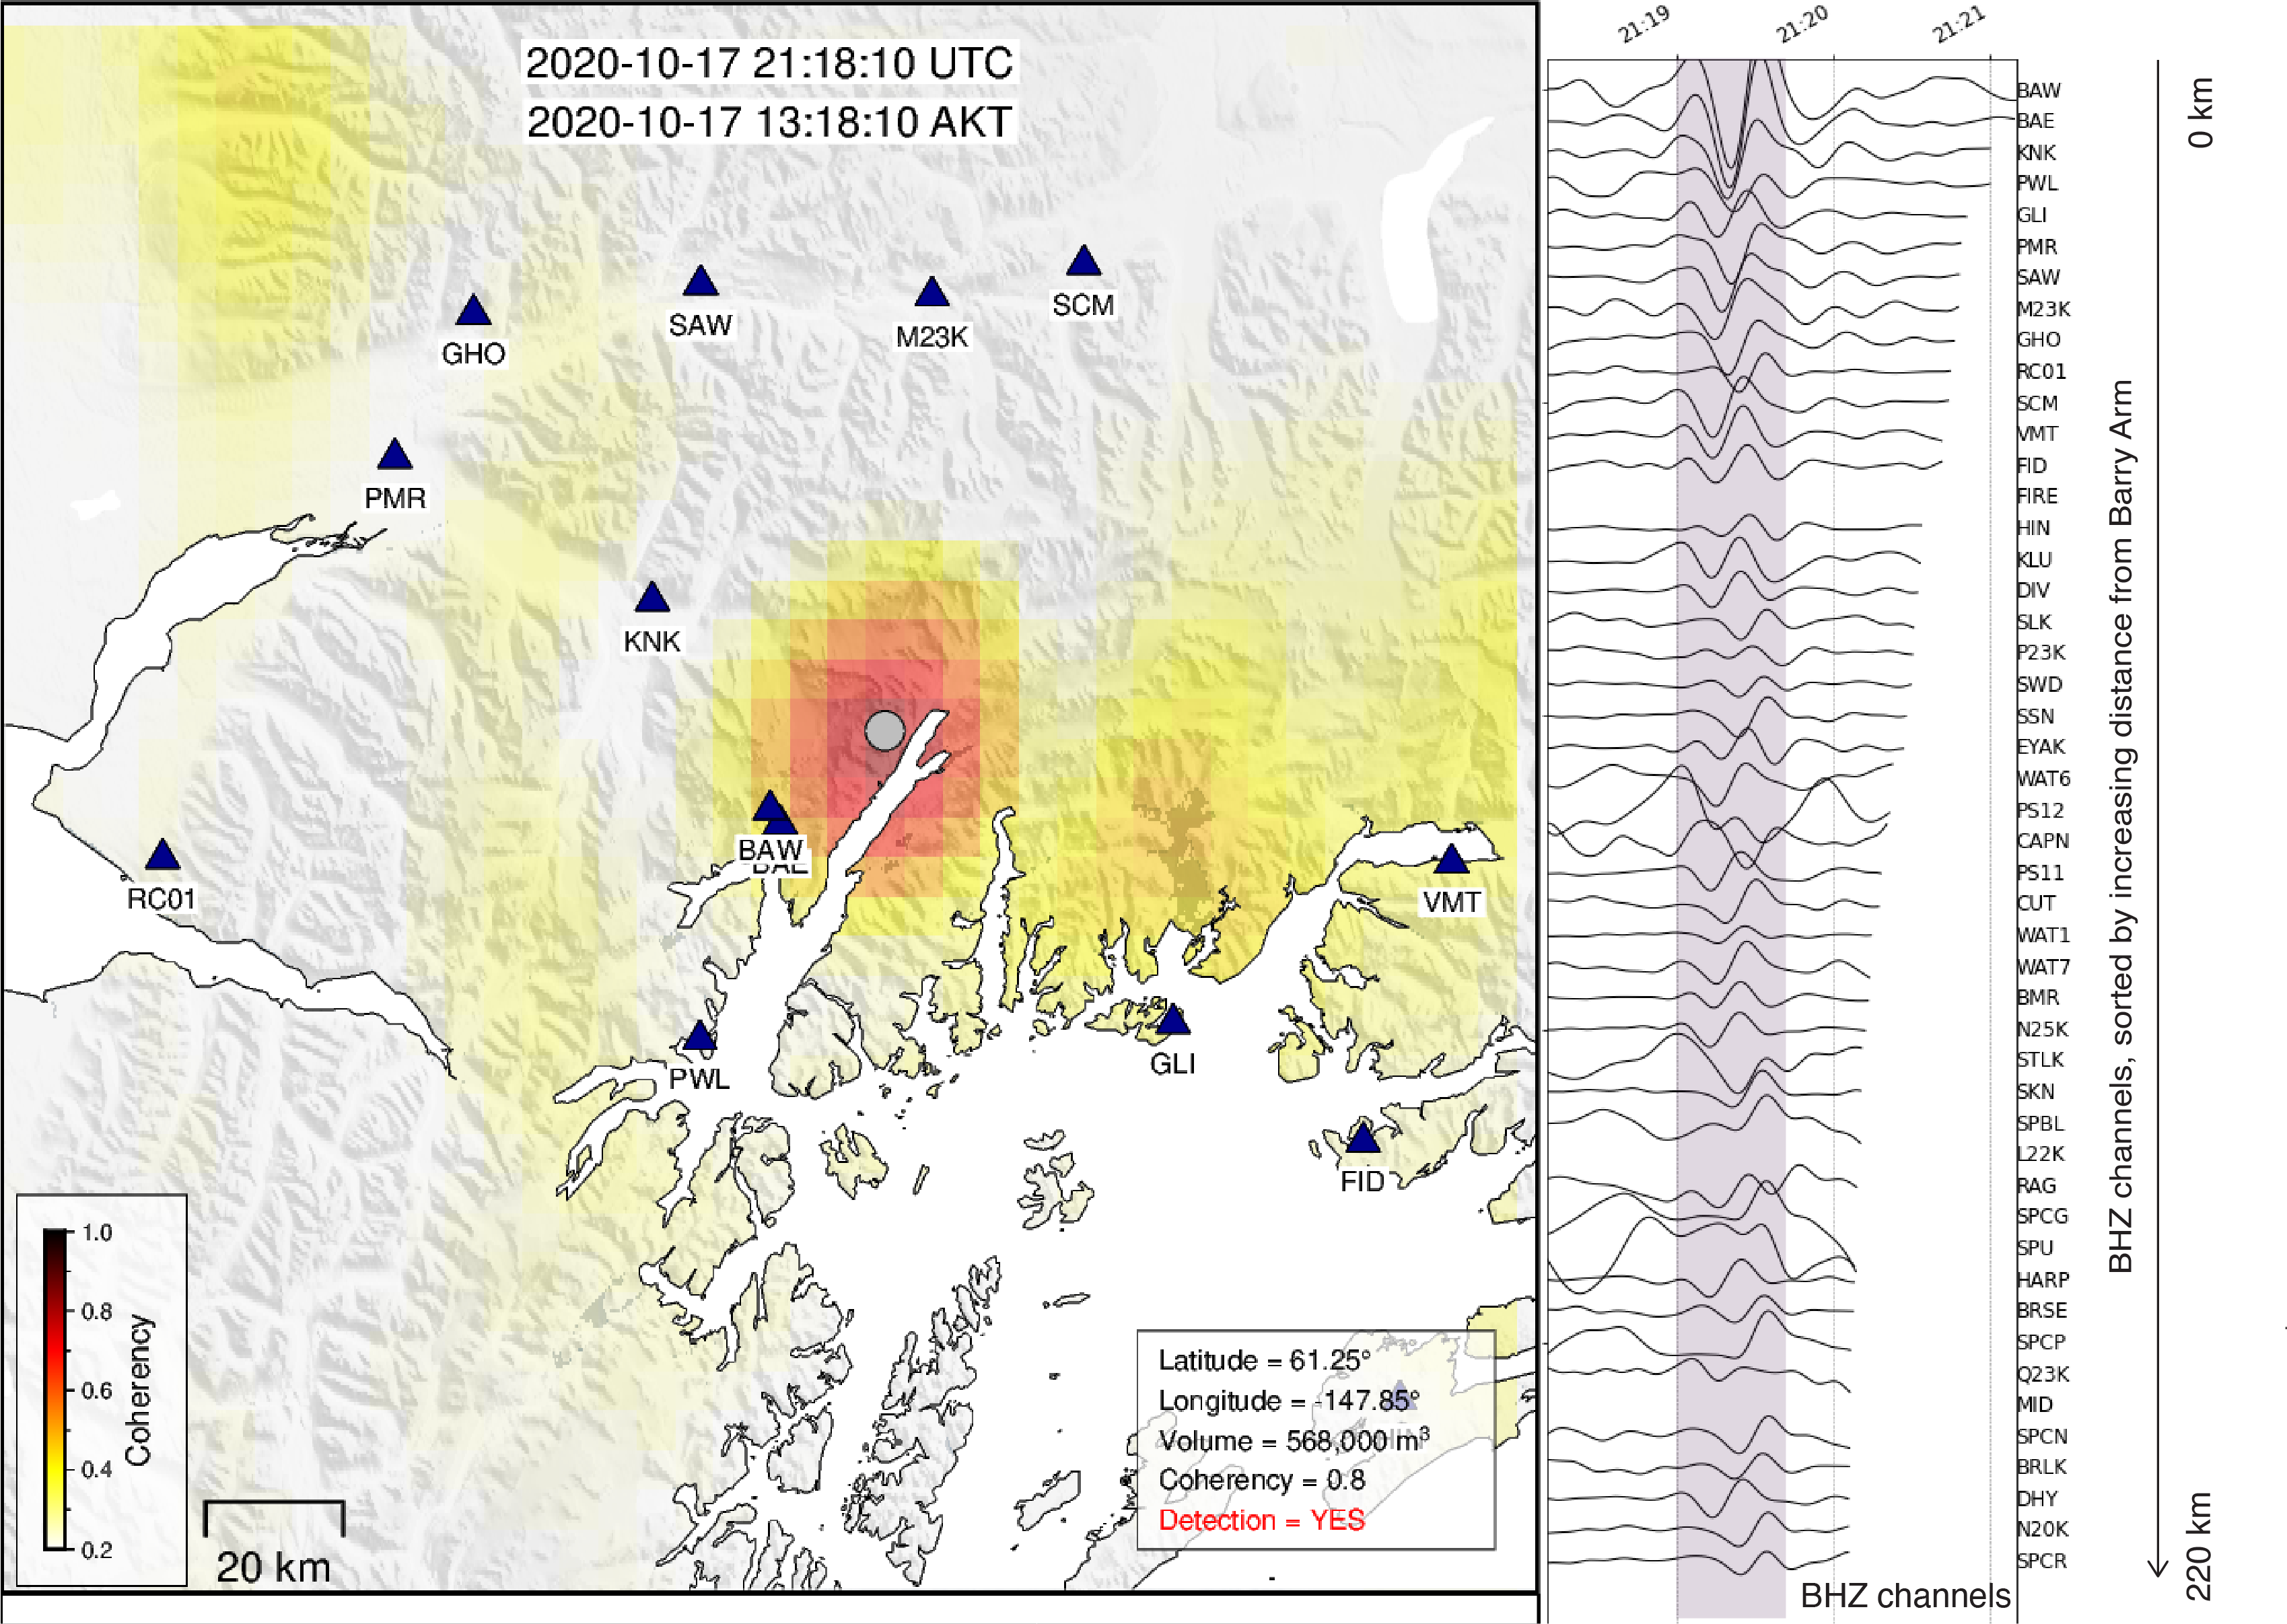
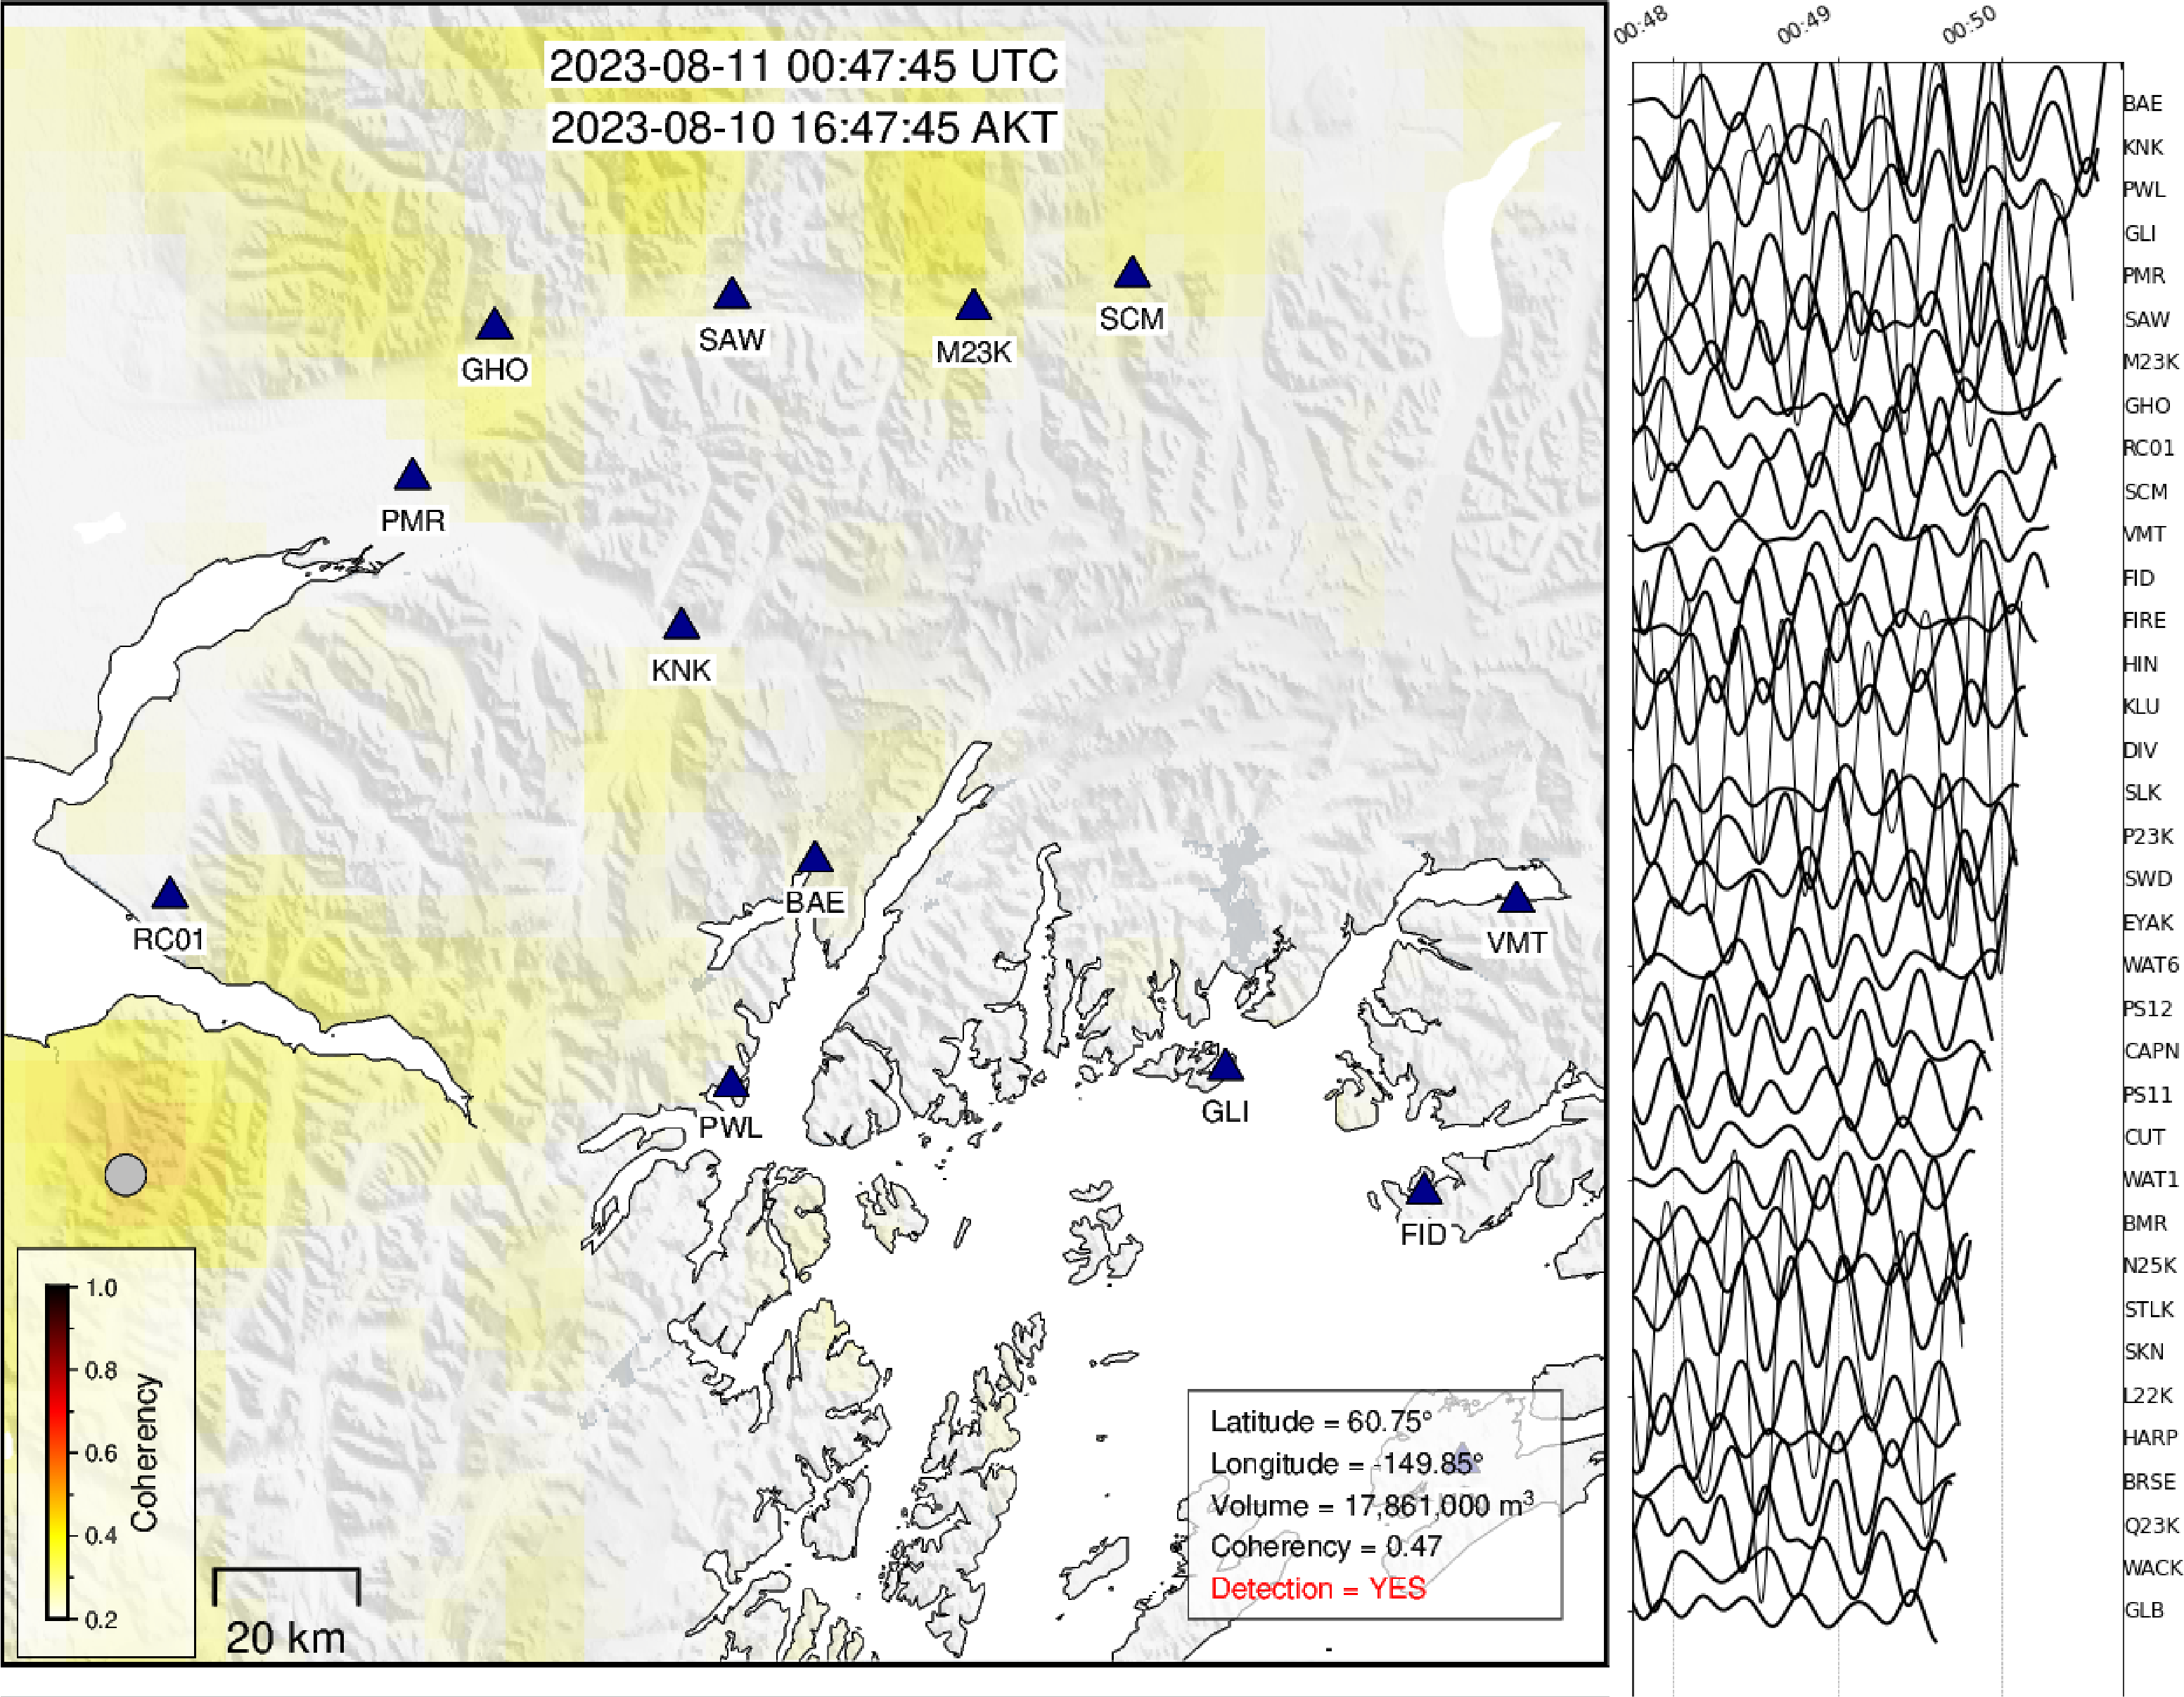
M3.7 earthquake. Waveforms align in time, but neither location nor amplitude decay suggests a Barry Arm source. 
Teleseism. There is faint coherence across the region. However, waveforms have the same amplitudes and show no clear alignment.