


If you were one of the thousands of people visiting our website this morning or using one of the numerous services that repost our data (various phone apps, USGS, etc.) you may have seen listings for two magnitude 5 earthquakes at the same time near Tanana at around 9am. The second epicenter is what we refer to—with some dissatisfaction—as a phantom event. Or a duplicate.
In the initial minutes after an earthquake, the information you see is produced solely by computer algorithms without the careful review of a seismologist. We choose to put this information live, in the interim, while our seismologists review a more careful solution.
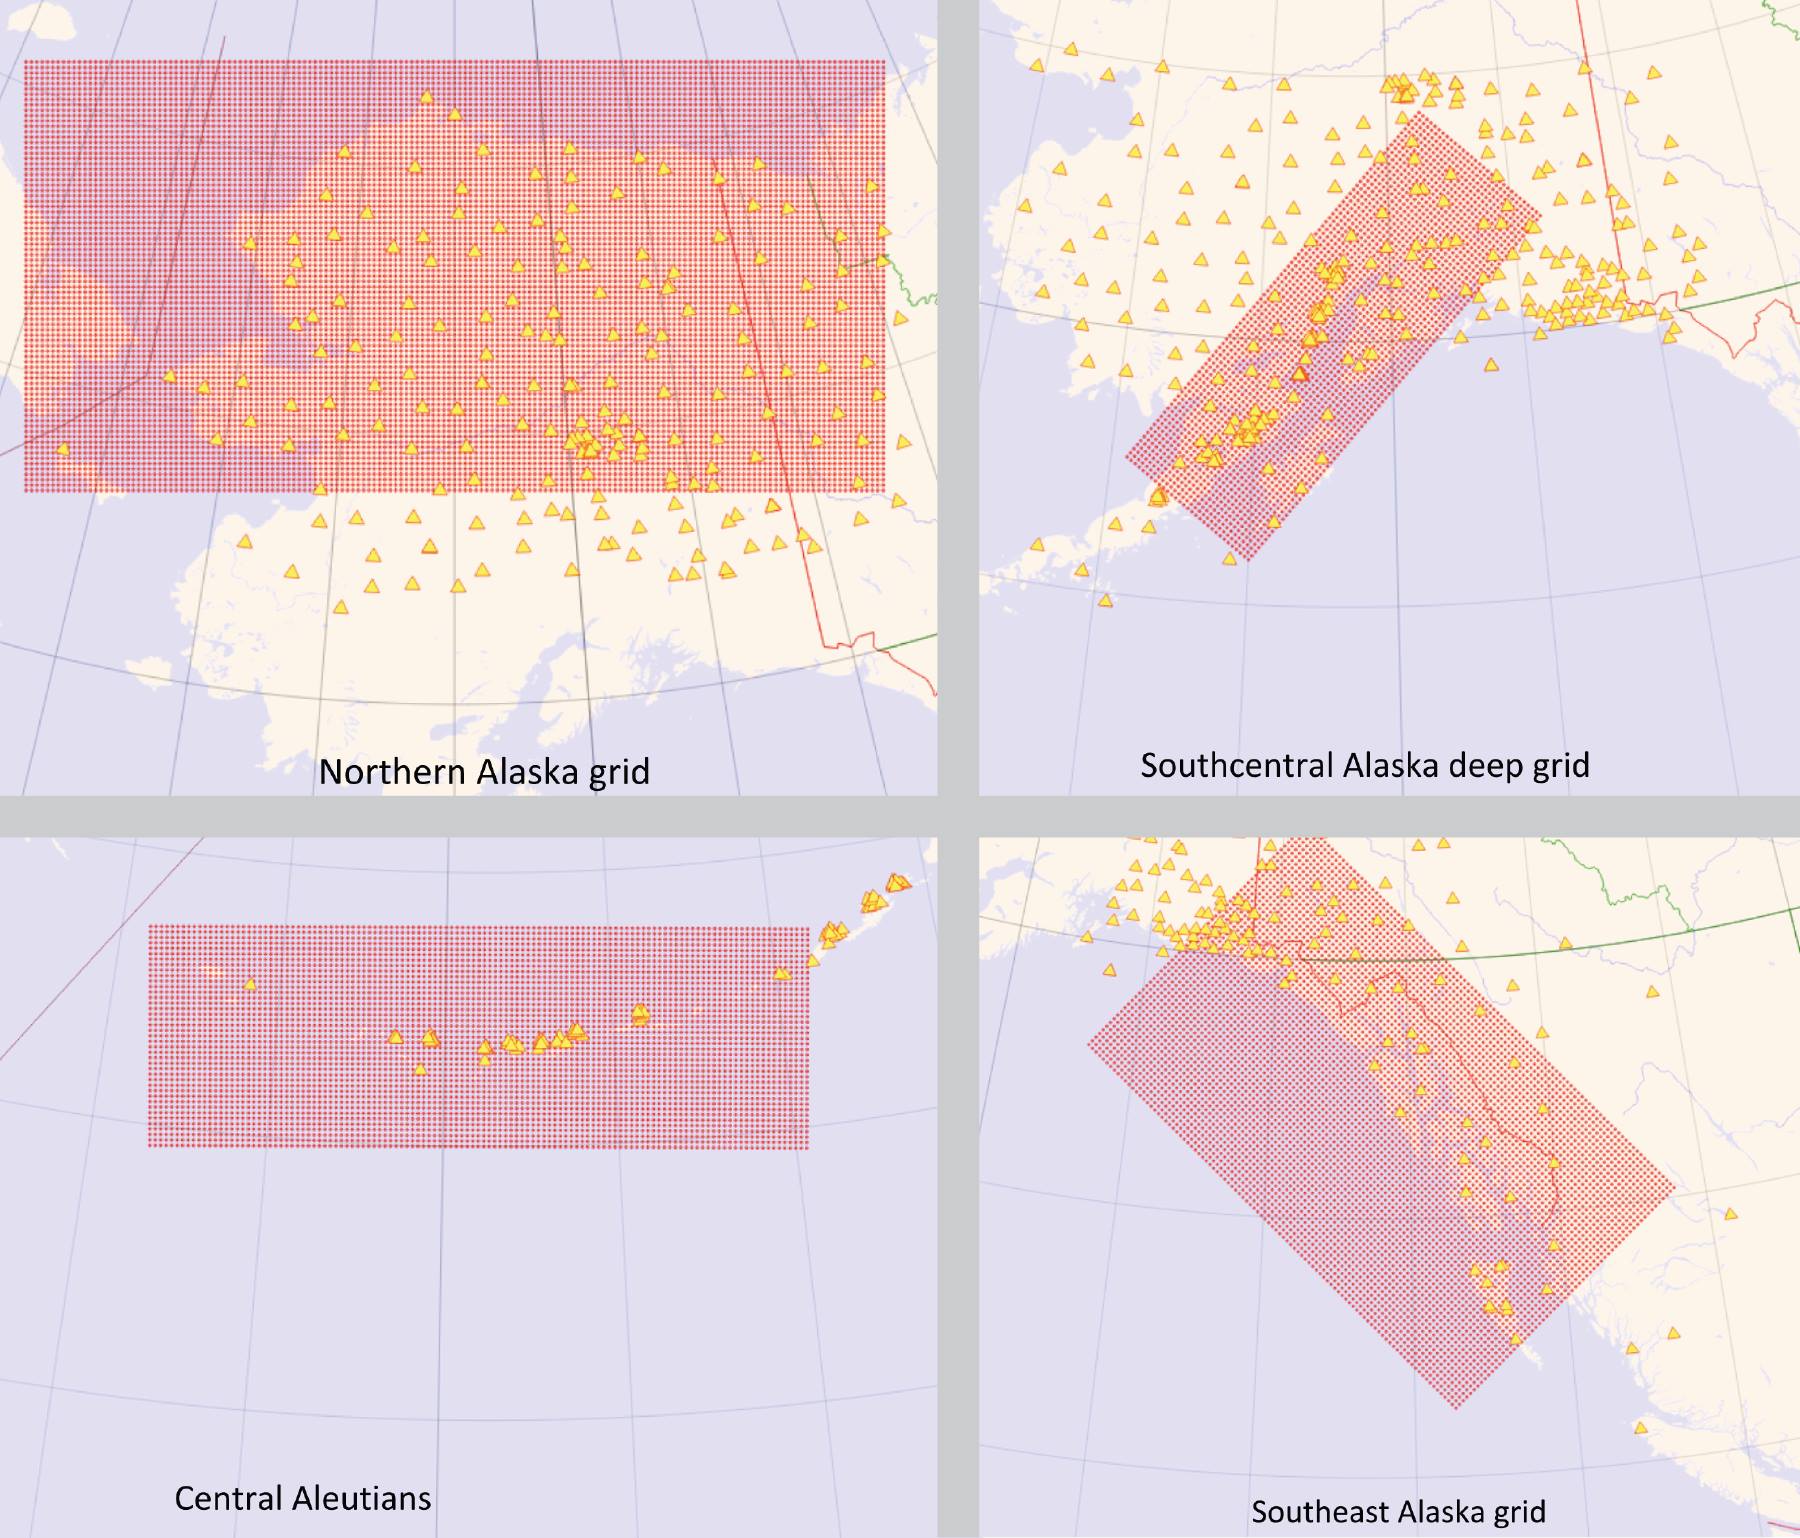
Without going too technical, the way we produce these automated reports is to search over vast grids of possible solutions to find the location that best fits the data we record across the many sites that comprise Alaska’s seismic network. The attached figure shows some of these grids (red) and the seismic stations we use with each (yellow). Historically, we have needed a stack of different grids to account for the highly variable concentrations of seismic stations in different parts of Alaska. Sometimes this leads to algorithm confusion and so-called phantom events.
Over the past year, this has changed dramatically. The USArray project has provided an even distribution of seismic monitoring stations across parts of the state where none previously existed. To make full use of these data, we have undertaken an extensive effort to redesign and retune the grids we use for automatic earthquake reporting.
Today’s events demonstrate that we still have more tuning to do! However, overall we are extremely excited by the better performance that the USArray data are making possible. We are greatly simplifying the grids below and—today notwithstanding—they perform far better than anything we have done in the past.