


When a large earthquake occurs, geophysicists have many tools at their disposal to determine the properties of the fault (or faults) that ruptured during the earthquake. The fields of seismology, which is the study of ground motions, and geodesy, the study of ground positions, are two of the main ways that geophysics researchers investigate earthquakes. Often, these efforts produce data sets which are complimentary to each other, with observations from one field confirming observations from the other. In the case of the magnitude 7.9 Offshore Kodiak Earthquake on January 23, 2018, however, these efforts have produced competing observations. This is not a bad thing – researchers often learn interesting things when observations appear to be at odds with each other.
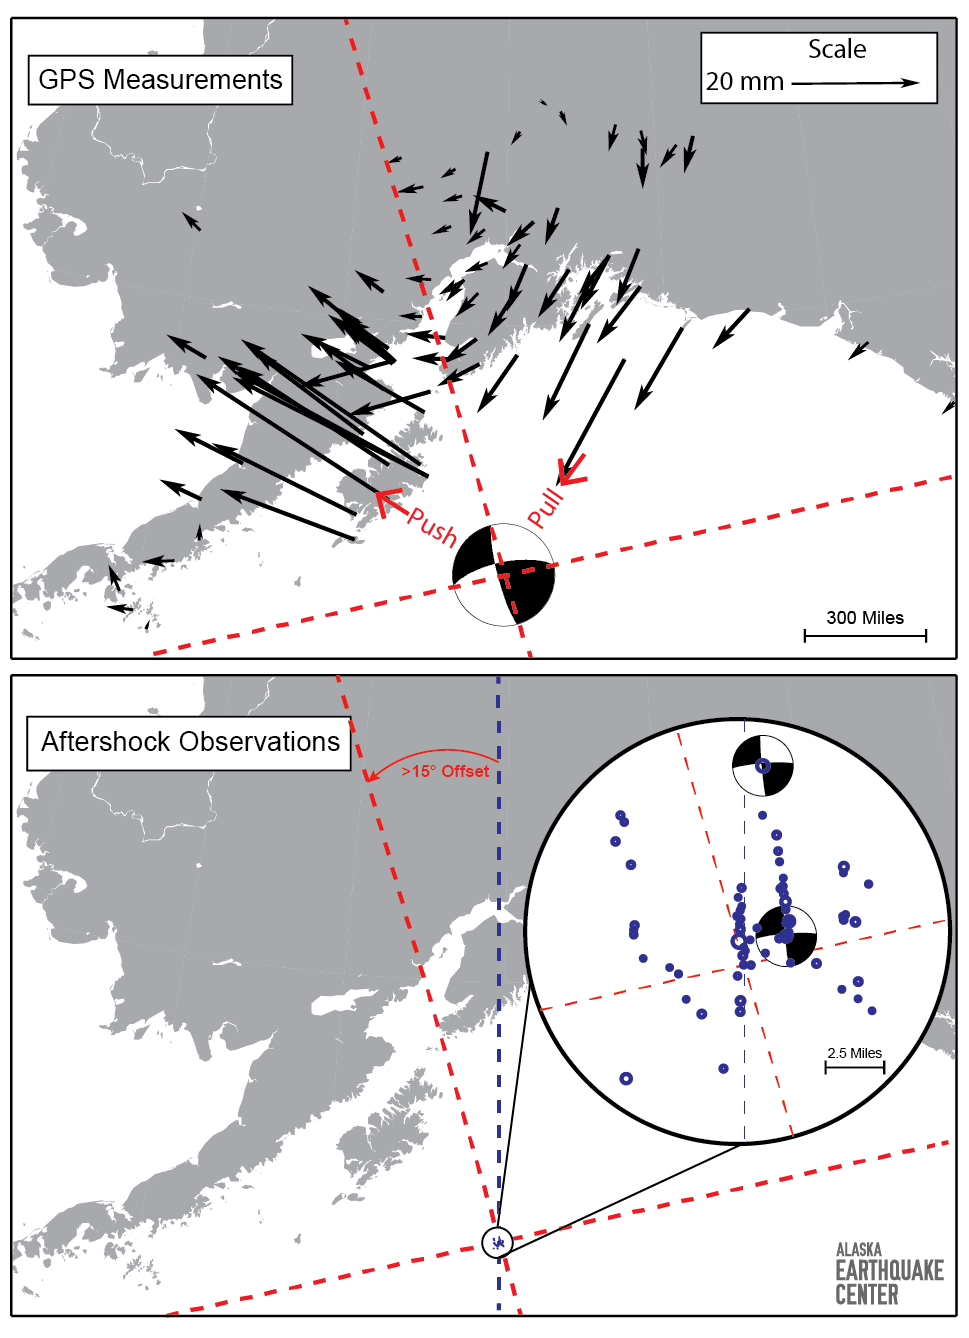
Figure 1 shows some basic observations following the Offshore Kodiak Earthquake. The top panel shows GPS displacement, or change in ground position, observations. These displacements are calculated from GPS positions taken immediately before and after the earthquake and show how the ground beneath each recording station has moved in response to this earthquake. These arrows show a rotation, from pointing towards the earthquake in the east to pointing away from the earthquake in the west, as is typical in strike-slip earthquakes. The boundary between these zones clearly trends NNW/SSE (shown by red dashed line in the top panel). Seismic observations, however, suggest North/South trending structures.
The bottom panel shows a close-up of some of the aftershock locations, which map out the location and orientation of some of the faults that were active during the earthquake. These show that North/South trending faults were at least partially responsible for the earthquake. Initial ground motion data from seismic observations of the mainshock (not shown here) also suggest that the earthquake started on a North/South oriented fault.
What might it mean if the geodesic and seismic observations are both correct? Each is a piece of the puzzle, but it’s important to realize that these observations are sensitive to different aspects of the earthquake. GPS data cover a much wider area and show how the earth as a whole responded to the earthquake, while the seismic observations show what happened during individual portions of the earthquake, such as the start of the earthquake or slip along a sub-fault.
The beachball in the top panel is the focal mechanism (see figure 2) calculated from long period global seismic observations, and like the GPS solutions, shows the sum of the combined motions from all of the faults which slipped during the earthquake. Combined, the geodesic and seismic observations point toward a complex earthquake source involving multiple faults and slip events. Essentially, the Offshore Kodiak Earthquake must have started on one fault and transitioned onto one or more nearby faults with different orientations, instead of occurring entirely on the initial fault.