


Noise is all around us, all the time. Vibrations in the earth are much the same. Natural and anthropogenic (or man-made) vibrations are a constant source of noise that is recorded on seismic sensors around the world. We can take some action to quiet the noise, but as populations spread and infrastructure rises, it becomes harder to find quiet places to “listen” for earthquakes. This is even more difficult when monitoring in urban areas.
So what can be done to remove the noise, but keep the “good signal”? Ezgi Karasozen and Mike West have developed a method to remove persistent cultural noise (frequent, repetitive man-made vibrations) from seismic sensor recordings to help show earthquake data more clearly without altering the earthquake signal. Like everything else in life, removing too much noise (i.e. overdoing it) is not good, because the earthquake signal can get lost. The goal is to remove as little as possible when there is “good signal” to capture as much of the earthquake as possible.
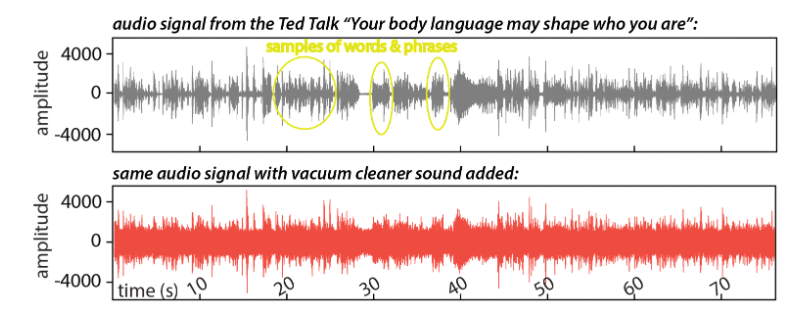
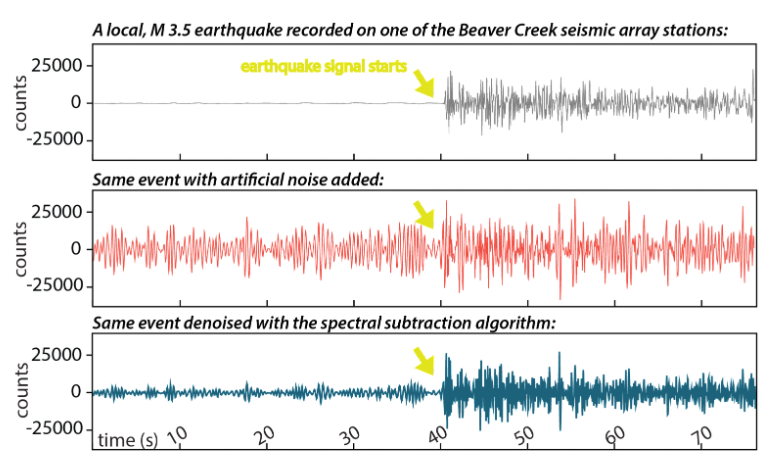
Karasozen and West are applying a modified version of a technique called “spectral subtraction” to a set of closely spaced seismic sensors in Turkey that is in close proximity to a granite processing facility. Spectral subtraction is a technique that is commonly used in speech and audio recognition software. Audio noise and seismic noise have very similar natures (see Figures 1 and 2); however the goals and challenges of seismology and human speech are quite different. Speech and audio analysis relies heavily on long extended signal trains that capture whole words and phrases (circled areas in Figure 1), while seismic analysis often relies on individual phases (or pulses) where detecting the beginning of the signal is the most important part (yellow arrow in Figure 2). They needed to modify the process because, as is, the spectral subtraction was removing too much of the “good signal” they wanted to preserve. This could potentially result in incorrectly identifying the earthquake.
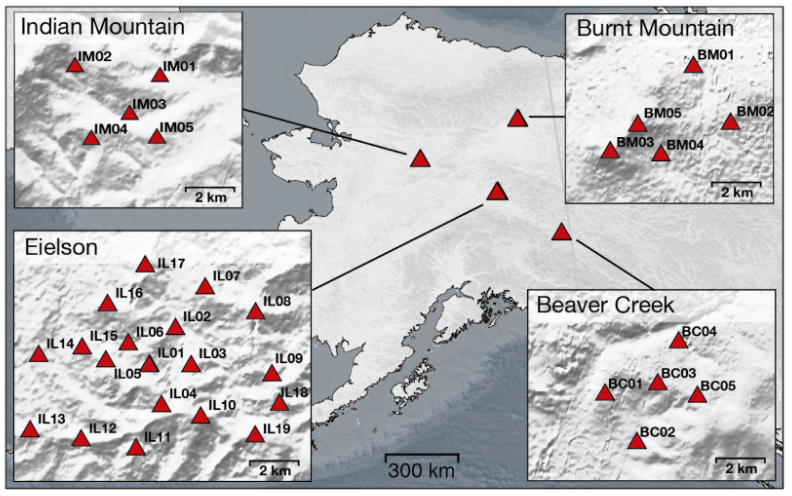
They needed to test this modified method on a similar, but noise-free, array to be able to compare their results on a quiet setting. Alaskan seismic arrays (see Figure 3) are perfect for this, they are similar sized arrays (with equivalent spacing), are relatively noise-free, and in areas with frequent earthquakes. They could test the quality of their spectral subtraction method on earthquake detections from local data sources.
Karasozen and West know the properties of these Alaskan arrays and earthquakes well. They were able to add artificial noise, similar to what was recorded in Turkey, and then attempt to remove the noise using their modified method. They then compared the noise-free (before data) to the results of their spectral subtraction to see how well the method removed the added noise. Figure 2 shows the results of this test. The top box shows the original (before) signal. The middle box shows the signal overlaid with the quarry noise, note how the earthquake signal is not as easy to see as in the top box. The bottom box shows the results from the model used to filter out the noise. While the signal doesn’t look exactly like the top box, it is much easier to see the original signal and makes it possible to use that earthquake data.
They will be presenting their findings at the annual American Geophysical Union meeting on December 14th. More information can be found at the conference website