


Alaska had a relatively quiet 2024 as far as numbers of seismic events, but several earthquake swarms kept things interesting. Even a “quiet” year, however, keeps the Earthquake Center busy:
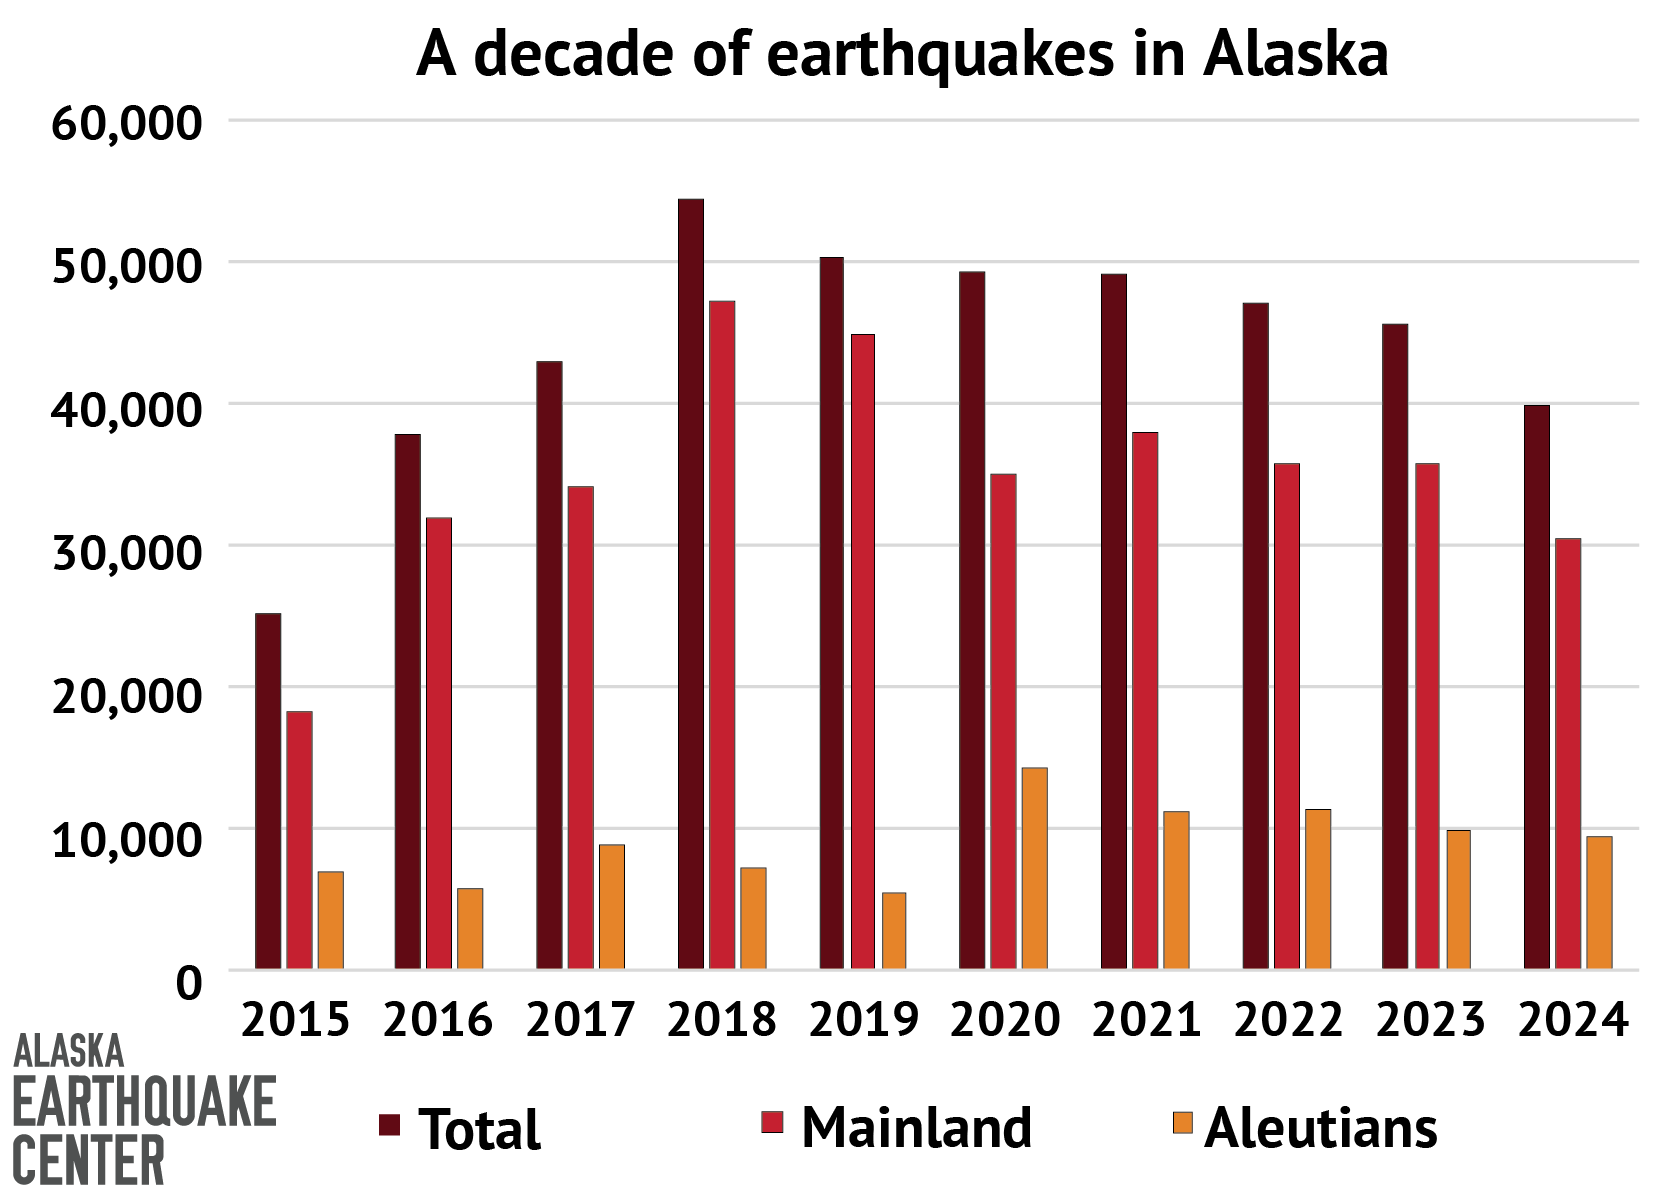
Total seismic events in Alaska and nearby regions processed by our dauntless analysts: 39,836
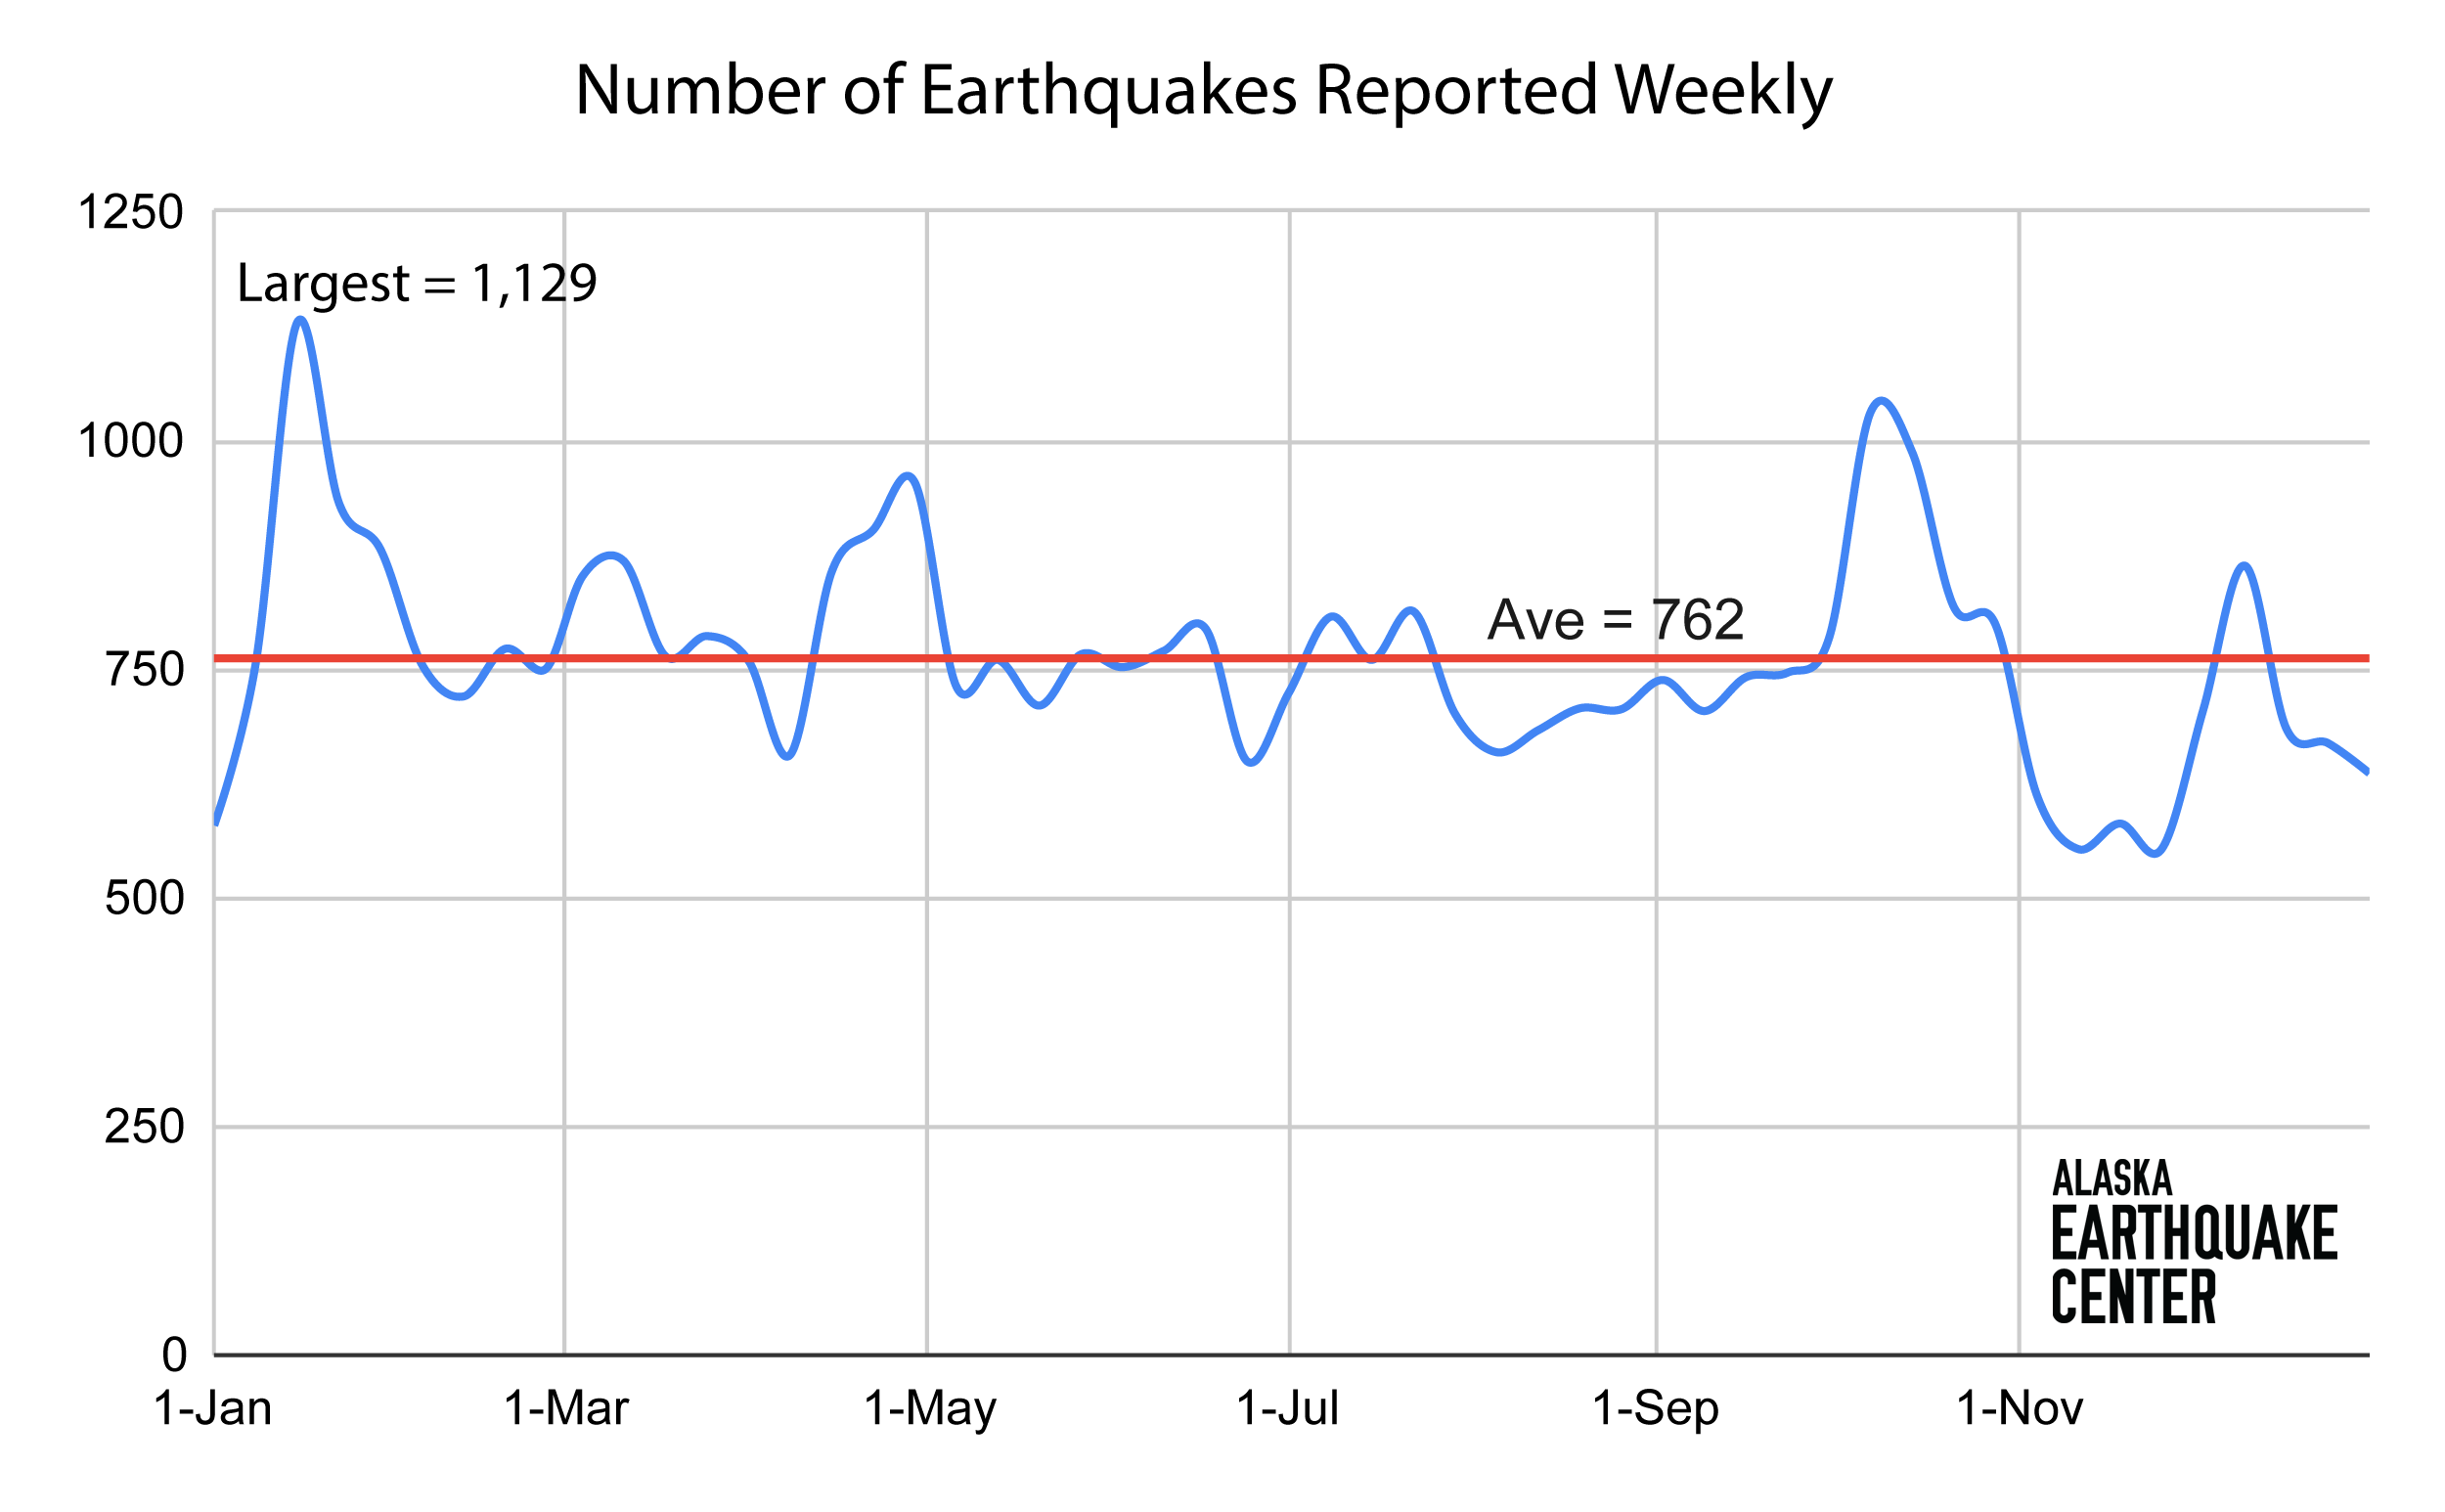
Average number of events per week: 762
Number of Magnitude 5 or greater earthquakes: 50, or an average of one per week
Number of earthquakes Alaskans reported feeling: 188
The 2024 total (Figure 1) is about 5,700 less than last year and about 15,000 less than the record-breaking 2018, when our analysts processed about 55,000 seismic events (Figure 2). Figure 3 shows the weekly numbers of seismic events throughout 2024.
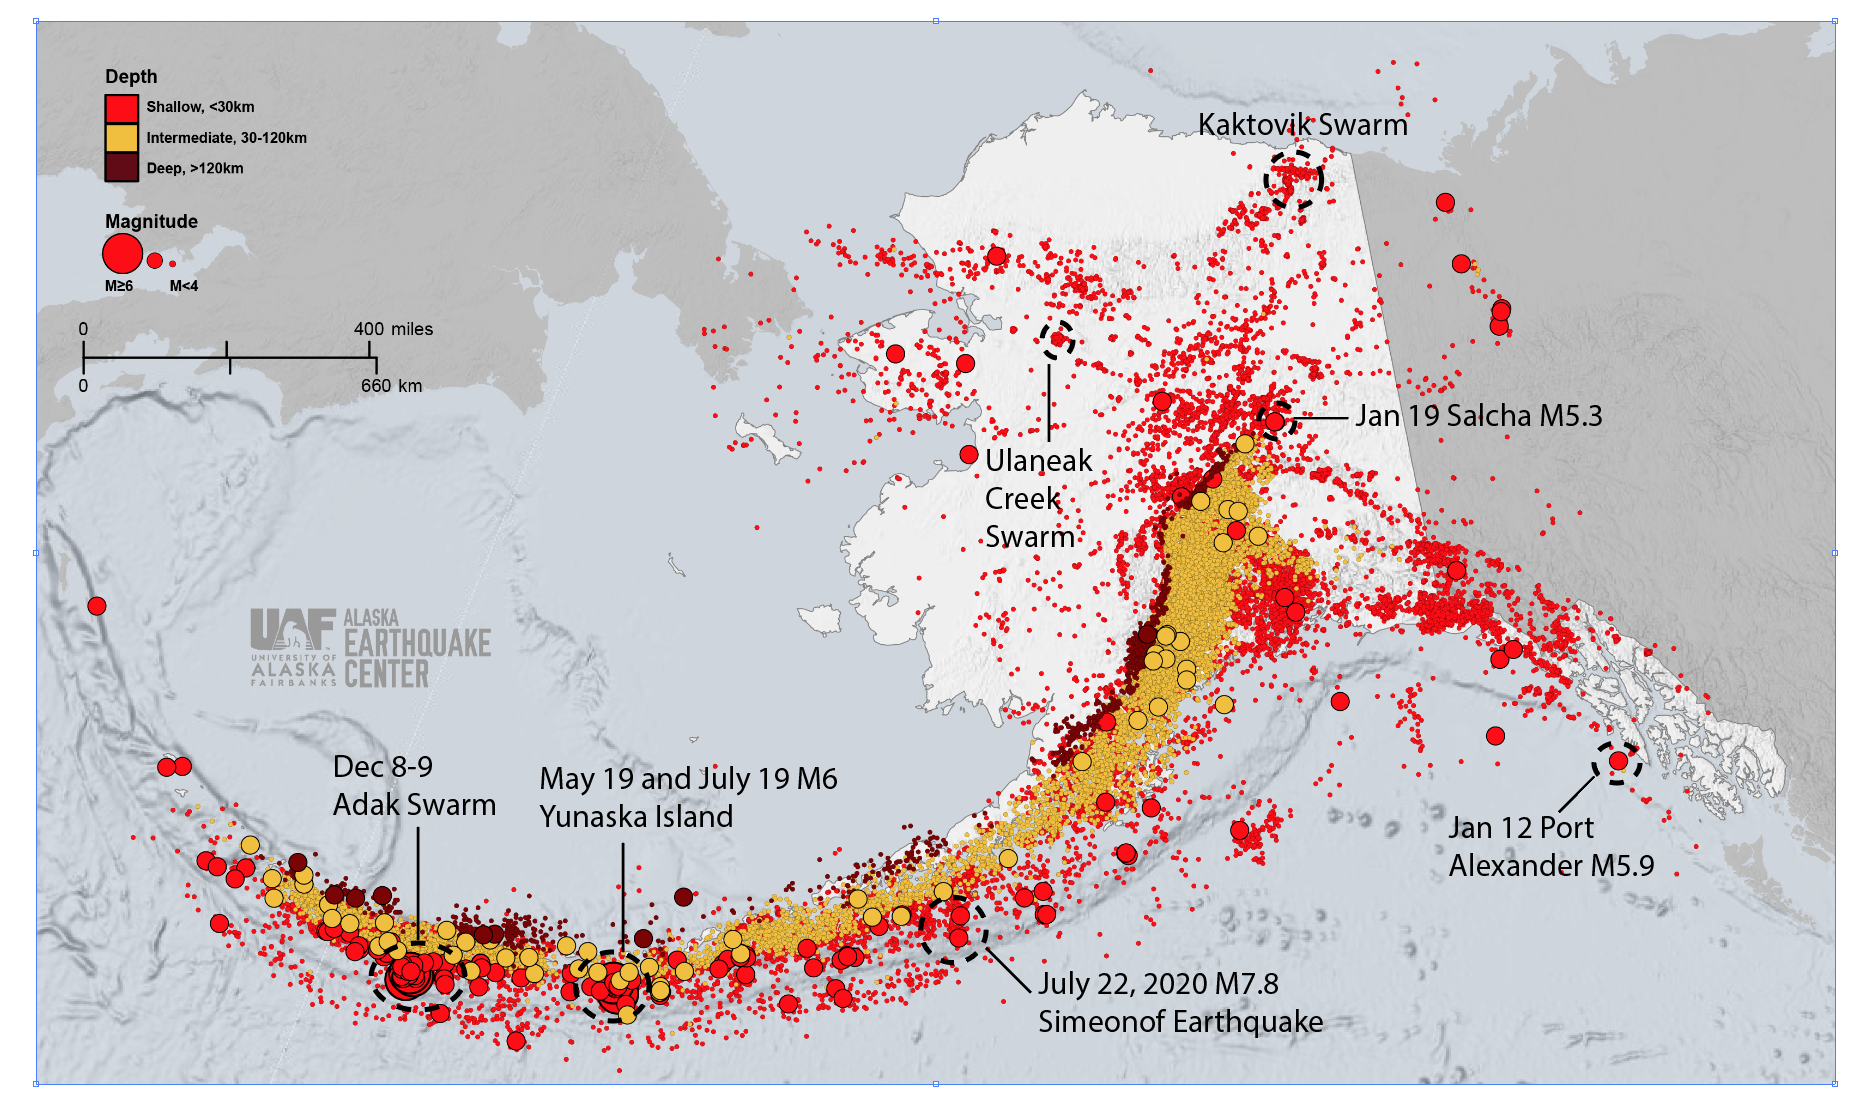
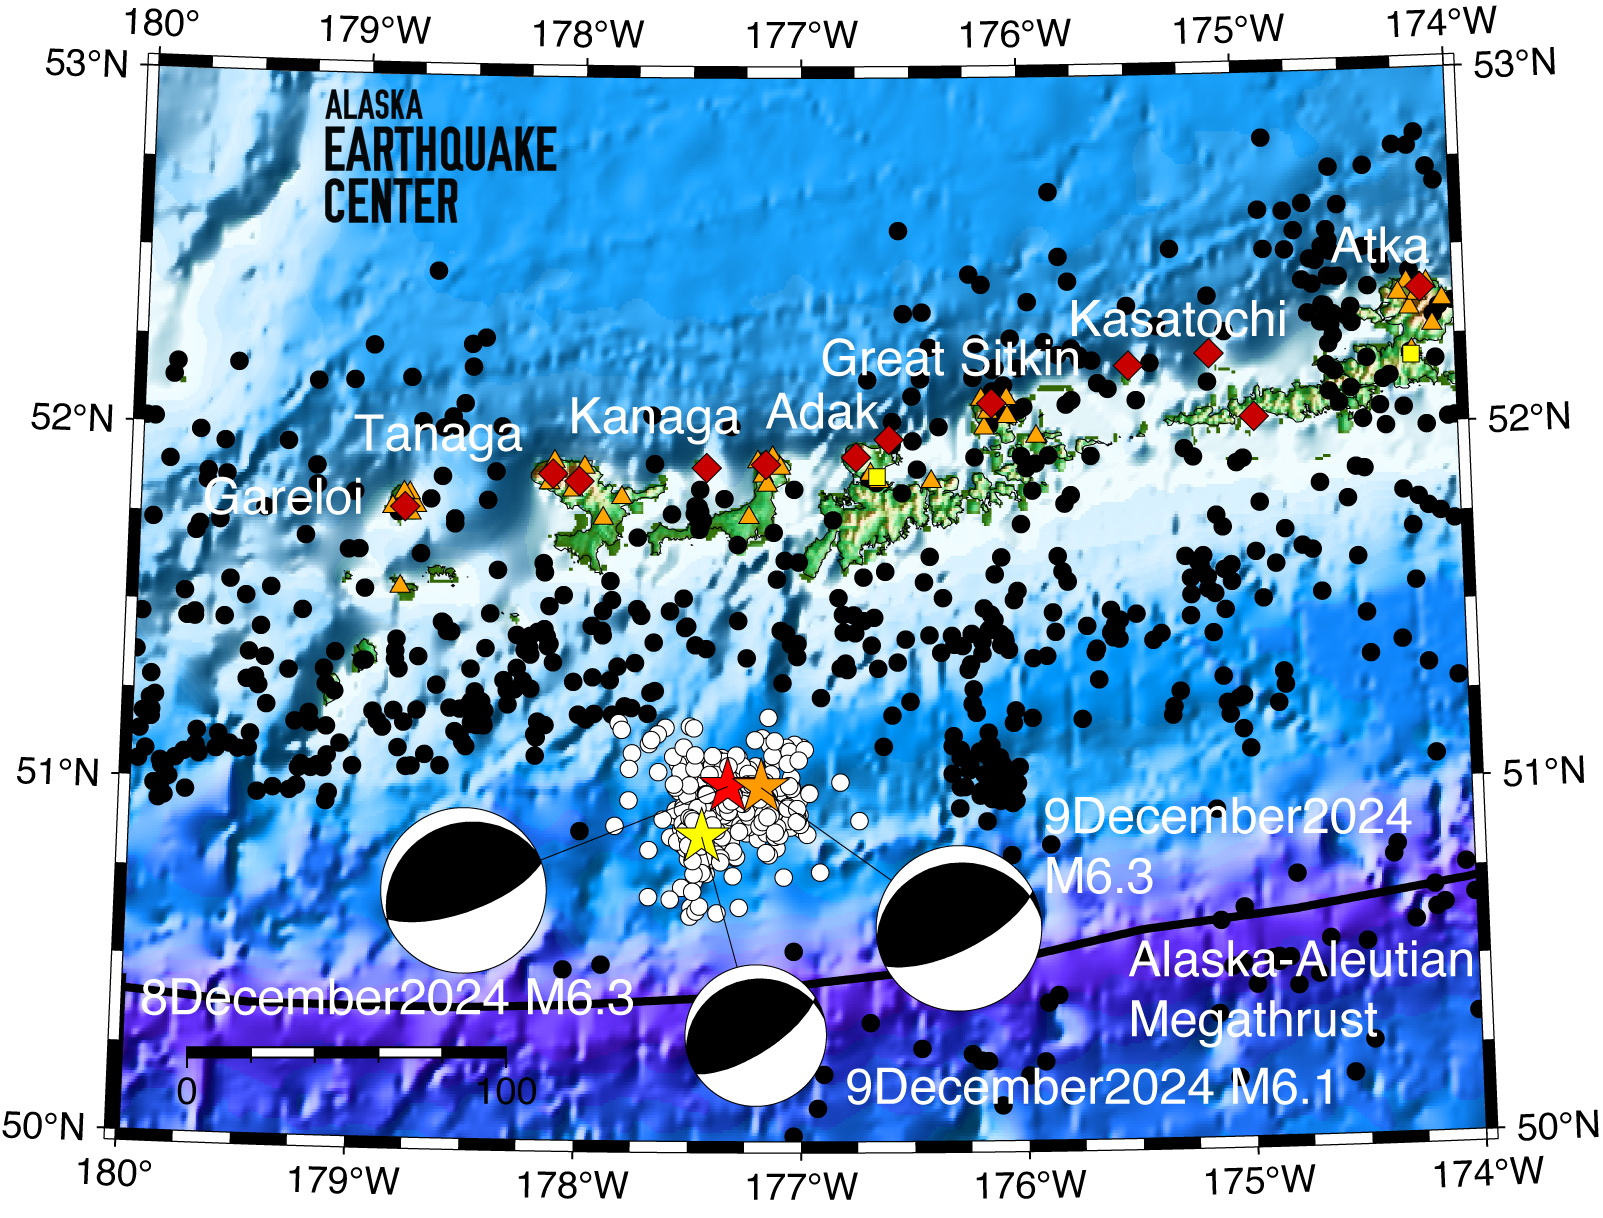
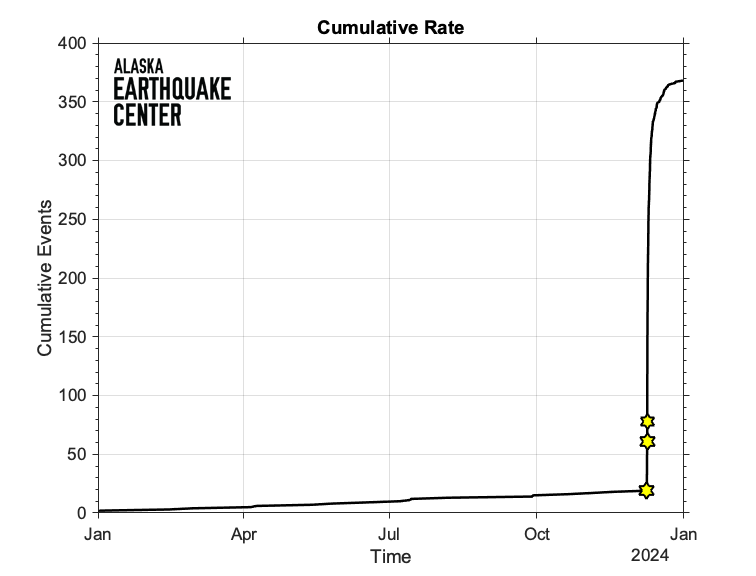
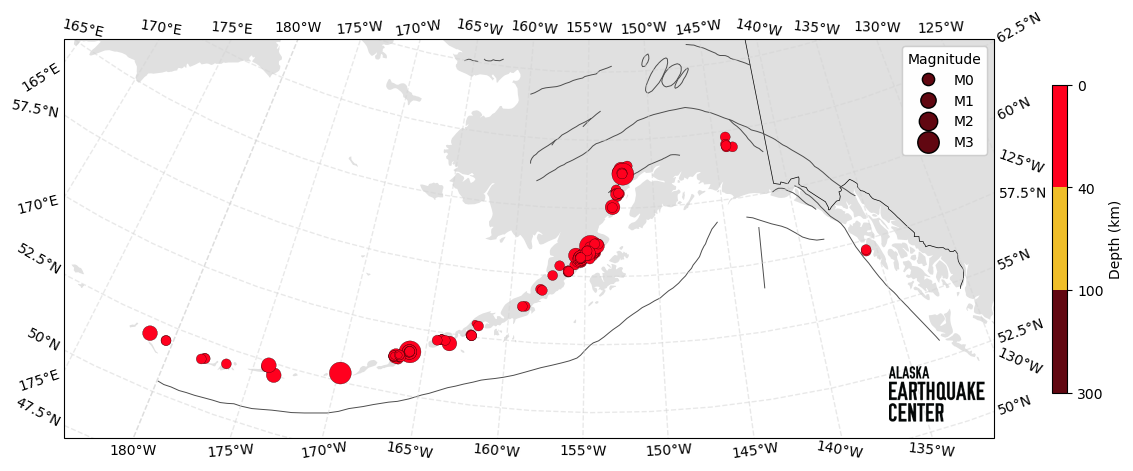
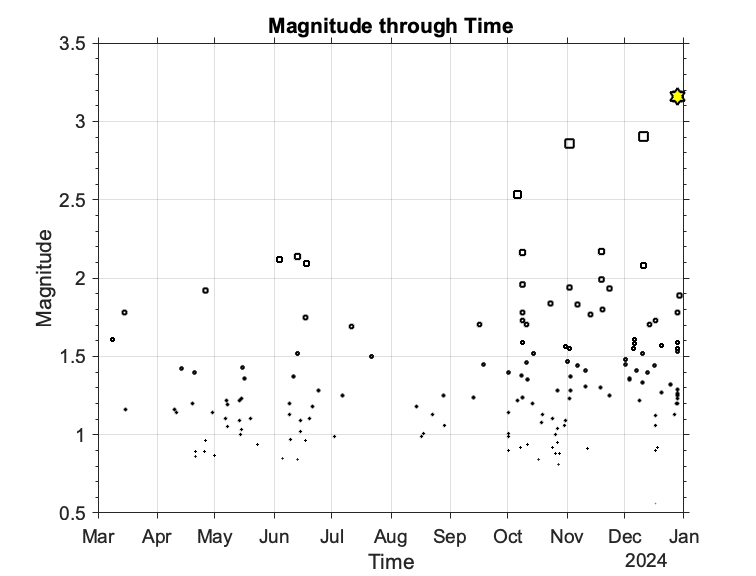
Two magnitude 6.3 earthquakes tied for the title of largest earthquake of 2024. They occurred just a few hours apart on December 8, one at 10:57am and the second at 3:15 pm Alaska time. They were followed by a magnitude 6.1 a mere 23 minutes later, which was the second-largest earthquake of the year (Figure 4). These three events were part of a swarm just south of Adak Island in the central Aleutians. In addition to the three M6+ earthquakes, through December 31 there were about 350 events in this swarm, ranging from M2.0 up to M5.8. The largest events were reported as felt by residents of nearby Adak.
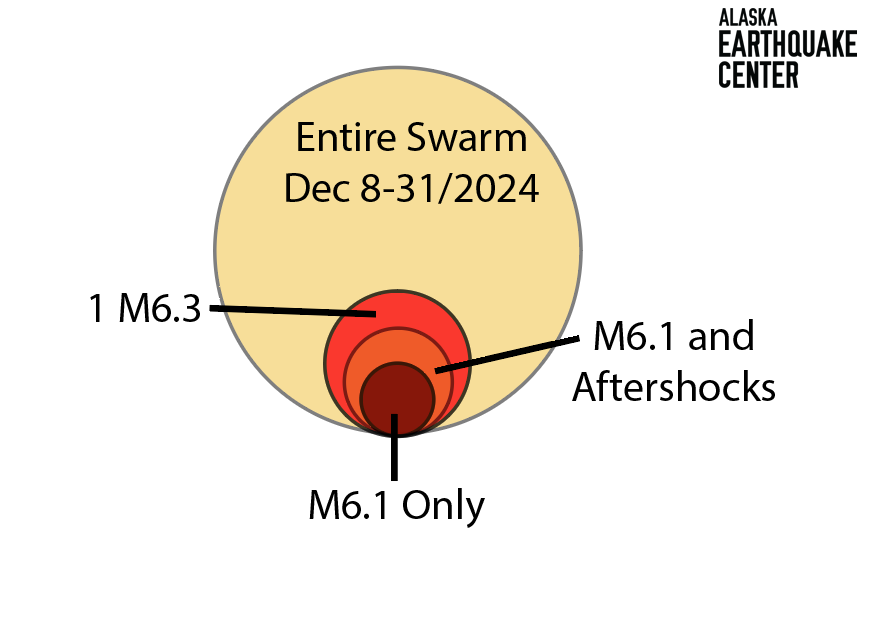
The Adak Swarm (Figure 5) is interesting because it’s uncommon to have a swarm of large-magnitude earthquakes. Each of the M>6 events in this swarm had aftershocks, and quite a bit of energy was released throughout the sequence. Figure 6 compares the energy of the entire swarm through December 31 to one M6.3 event, the M6.1 event, and all the events from the M6.1 event through the end of the year. Typical mainshock–aftershock sequences will show that the mainshocks release significantly more energy than all the aftershocks combined. In this swarm, however, the combination of the numerous large-magnitude events (three events of M>6, and 16 events ranging from M5.0-5.8) throughout the swarm released much more energy than the M>6 events alone.
The largest earthquake in mainland Alaska, a magnitude 5.9, occurred off the coast of Port Alexander in Southeast Alaska on January 12. Nearly 600 people throughout the Alaska Panhandle reported feeling this earthquake.
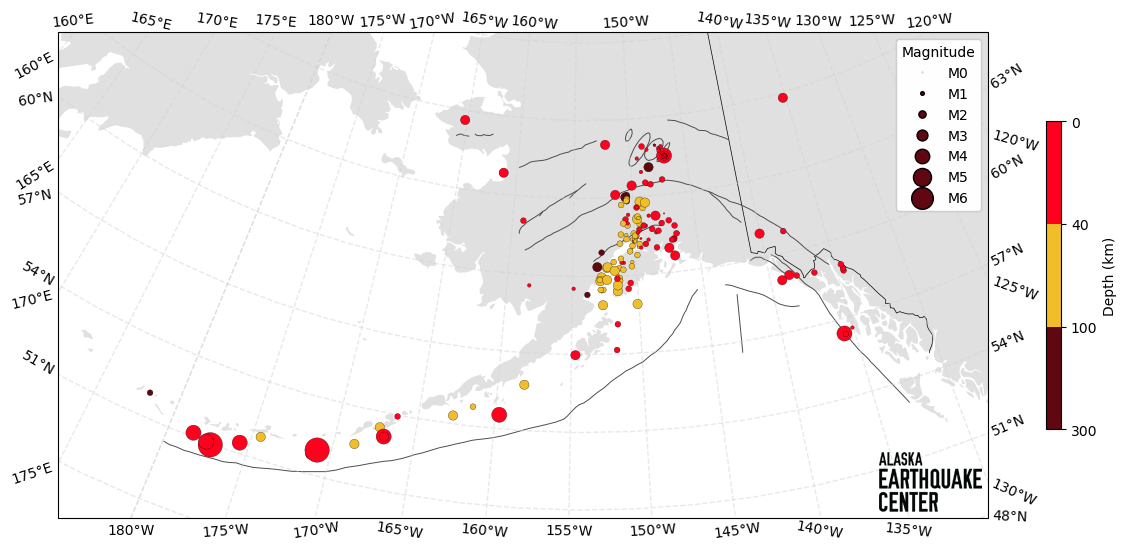
Alaskans reported felt earthquakes across the state (Figure 7). The earthquake with the largest number of felt reports was a M5.3 on January 19 southwest of Salcha in the Interior, with 1,447 people submitting responses. Residents said they felt nearly continuous shaking for the first hour after the mainshock. This isn’t surprising, as we measured 250 aftershocks in the first 24 hours. Overall, we recorded a total of 885 aftershocks from the Salcha Earthquake in 2024, most during the first two months after the mainshock. We felt this event at the Earthquake Center office in Fairbanks—during the middle of a tour!
In addition to the Adak Swarm, there were two other notable earthquake swarms in 2024, one near Kaktovik and one near Ulaneak Creek.
Starting in early October, our seismic data analysts noticed an increase in activity south of Kaktovik, in the northeastern region of Alaska (FIgure 1). These events are south of the 2018 M6.4 Kaktovik aftershock sequence, and just to the northwest of a 2018 swarm near the Hulahula River. The largest event in the Kaktovik Swarm this year was a M3.9.
Seismicity in this region follows a zone of activity about 240 miles wide and from the Beaufort Sea in the north to the Tintina Fault in the south. The activity appears to occur mostly on right-lateral strike-slip faults, generated as the Earth’s crust relaxes after ancient plates collided to build the Brooks Range. Because of the lack of seismic stations in this region in the past, there is not a lot of information about the historical seismicity here, and the behavior of faults is not well-known. The adoption in 2020 of Transportable Array seismic stations in northern Alaska that expanded our station network has allowed our analysts to better locate events and shed new light on the nature of seismic activity in the region.
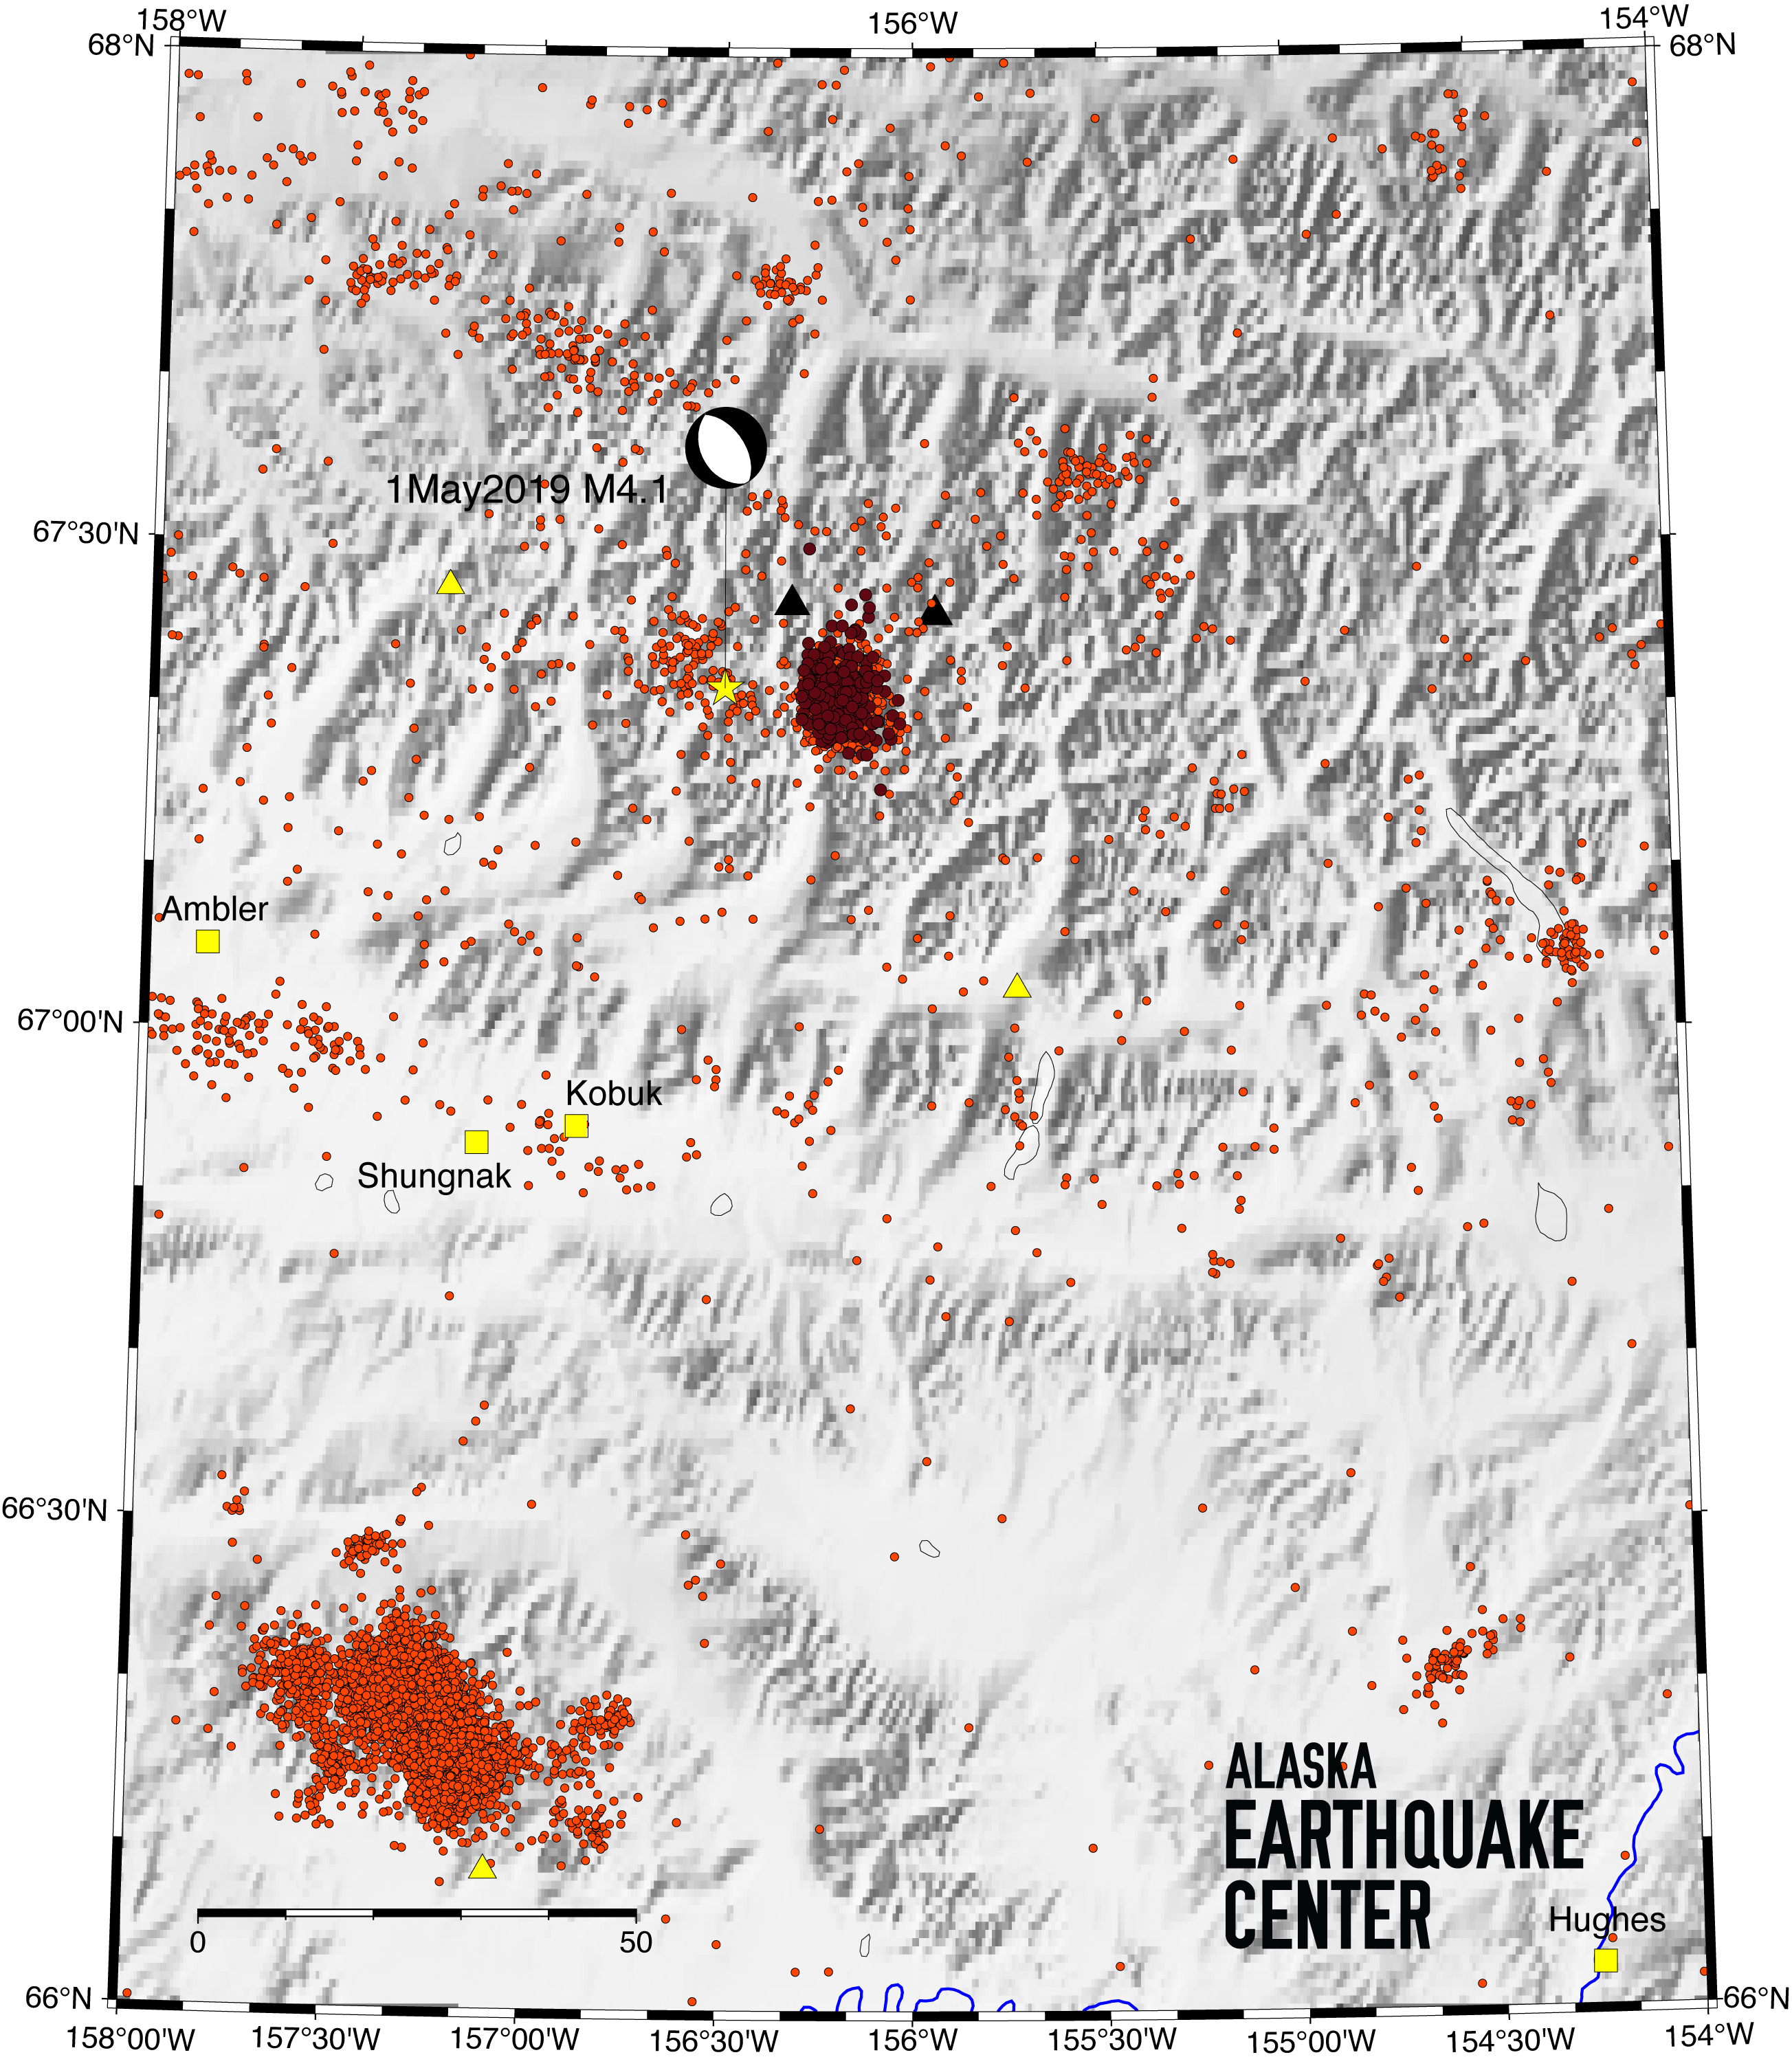
Early 2024 saw a swarm of earthquakes near Ulaneak Creek in the Schwatka Mountains of the central Brooks Range (Figures 1 & 8). There were a total of 104 earthquakes in this swarm, with the largest a M3.3 on January 21. There were no felt reports submitted for these events.
This region has had swarms in the past, and oddly enough, they occur seasonally, starting in late summer and continuing through fall into mid-winter. Since the installation of new stations in the region in 2017, we’ve been able to detect smaller events, down to M0.5. Since 2016 we have reported a total of approximately 1,100 events in this swarm area.
Similar to the Kaktovik swarm, this Brooks Range seismicity is due to mountain building and crustal reorganization.
The 2020 M7.8 Simeonof sequence continues to generate aftershocks, with a total of 1,093 this past year, an average of about three events per week. The aftershocks ranged between magnitudes 1.1 and 5.6. While the rate of aftershocks continued to decline in the first half of 2024, it picked up slightly after the M5.6 event. We expect this sequence to continue in 2025.
We tracked the 2018 M7.1 Anchorage Earthquake sequence for more than five years, but it has now quieted enough that we did not include it in this report. When the aftershock numbers drop back to the background seismicity levels from before a large earthquake, we stop attributing events to that particular sequence.
We reported 1,792 seismic sources that were classified as something other than regional tectonic earthquakes:
380 quarry blasts (magnitudes 0.5-2.7), the majority located in the vicinity of Fort Knox and Healy mines in Interior Alaska.
875 glacial quakes (magnitudes 0.8-3.1)
487 seismic events associated with volcanic activity (magnitudes 0.6-3.3).
31 landslides (magnitudes 0.8-2.3).
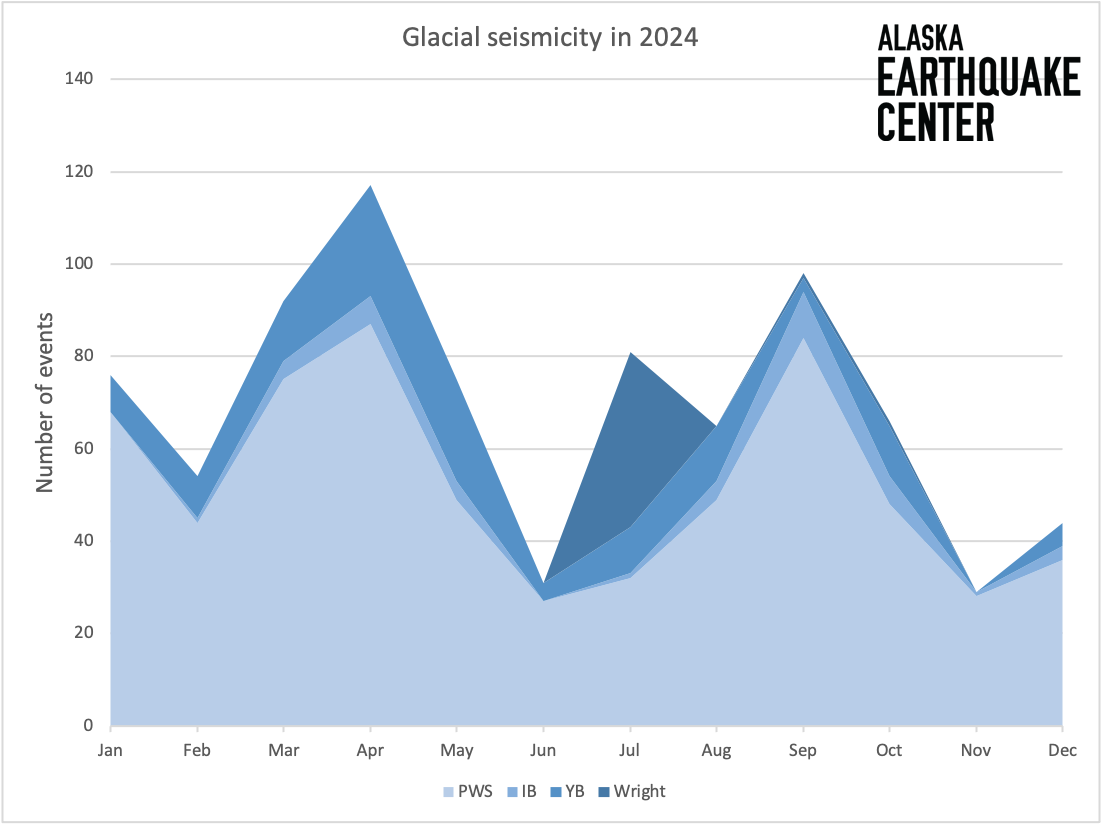
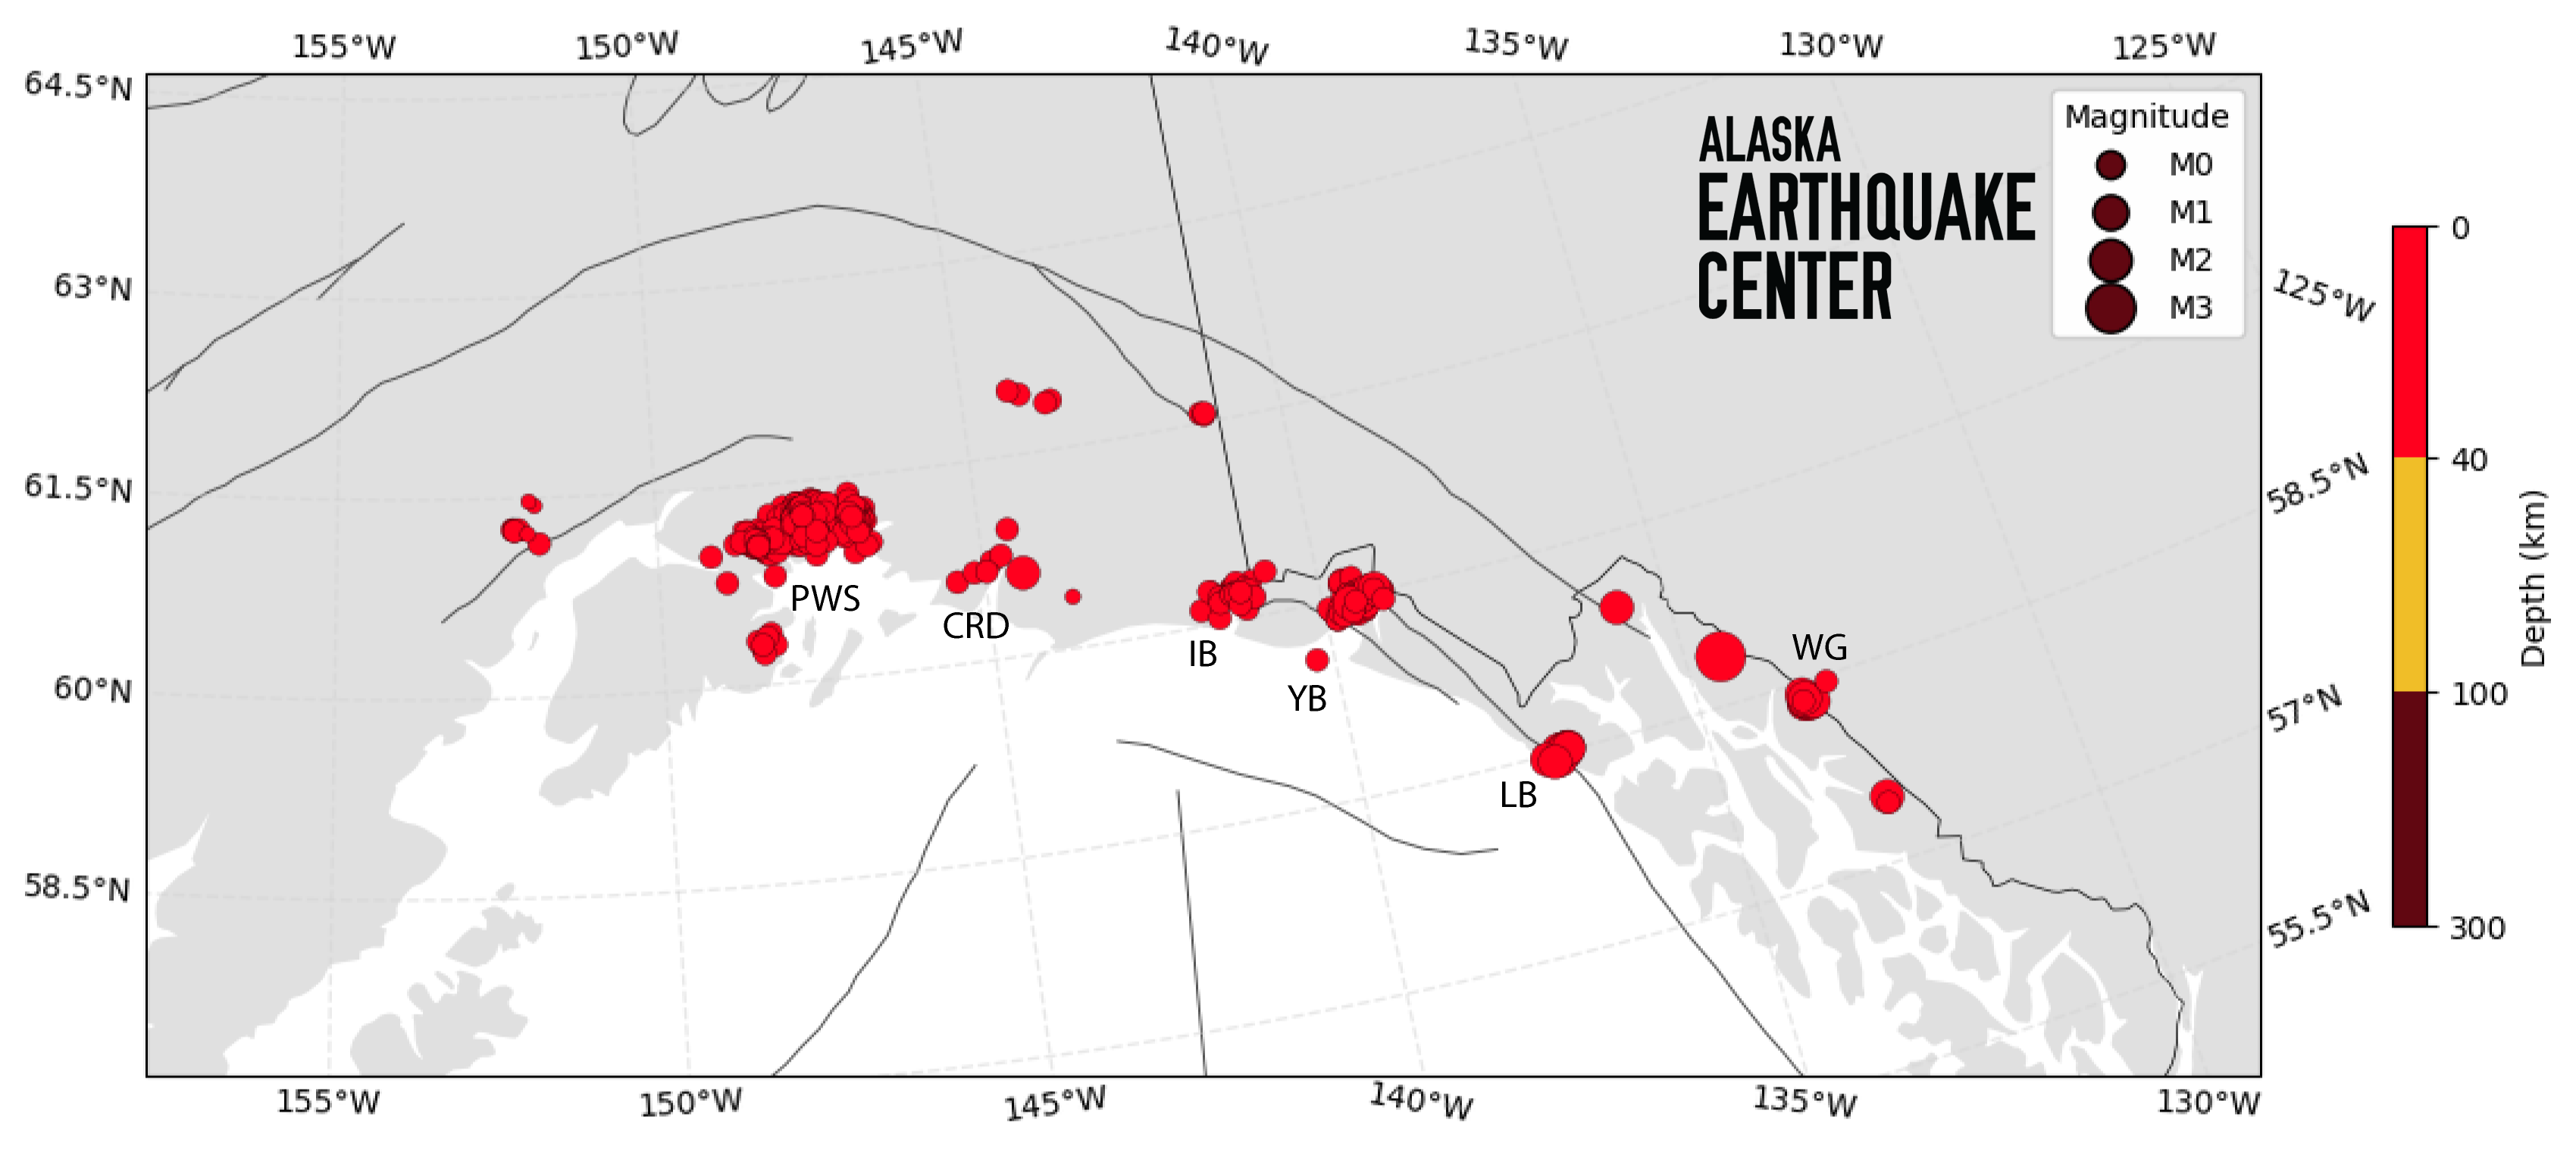
Glacial seismicity is recorded and studied globally; Alaska is no exception, due to its large expanse of glaciated areas. We normally record the majority of glacial activity near the termini of tidewater glaciers—where the glaciers dip their toes into the ocean—such as in the Prince William Sound region, Icy Bay, and Yakutat Bay (Figure 9). This activity follows seasonal variability and generally peaks at different times in different areas (Figure 10). In 2023, most glacial activity unusually peaked in October-November. In 2024 the glacial activity returned to its typical pattern, with activity in Prince William Sound, Icy Bay, and Yakutat Bay peaking in April and again in September.
We continued to record events in a cluster under Wright Glacier, which is about 40 miles northeast of Juneau. Of the 40 events in 2024, several reached magnitudes up to 2.9 and were felt in Juneau. The 2024 activity started in early July and occurred mostly during that month (Figure 9). Overall, seismic activity in this cluster was only half the rates observed in 2022 or 2021.
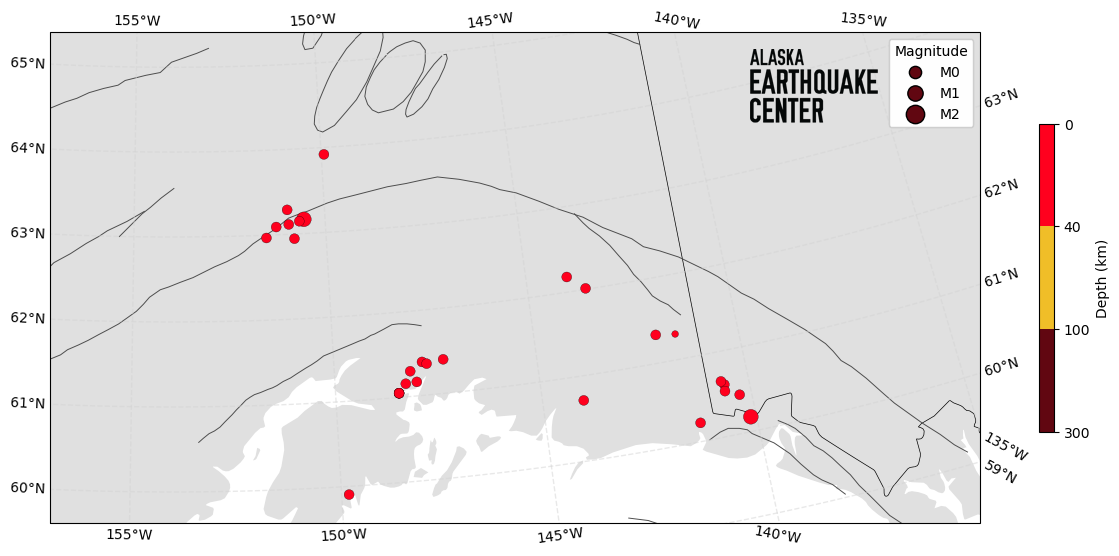
We detected landslides scattered across Alaska, including near Denali National Park and others near the coast (Figure 11). Two of the most impressive were coastal.
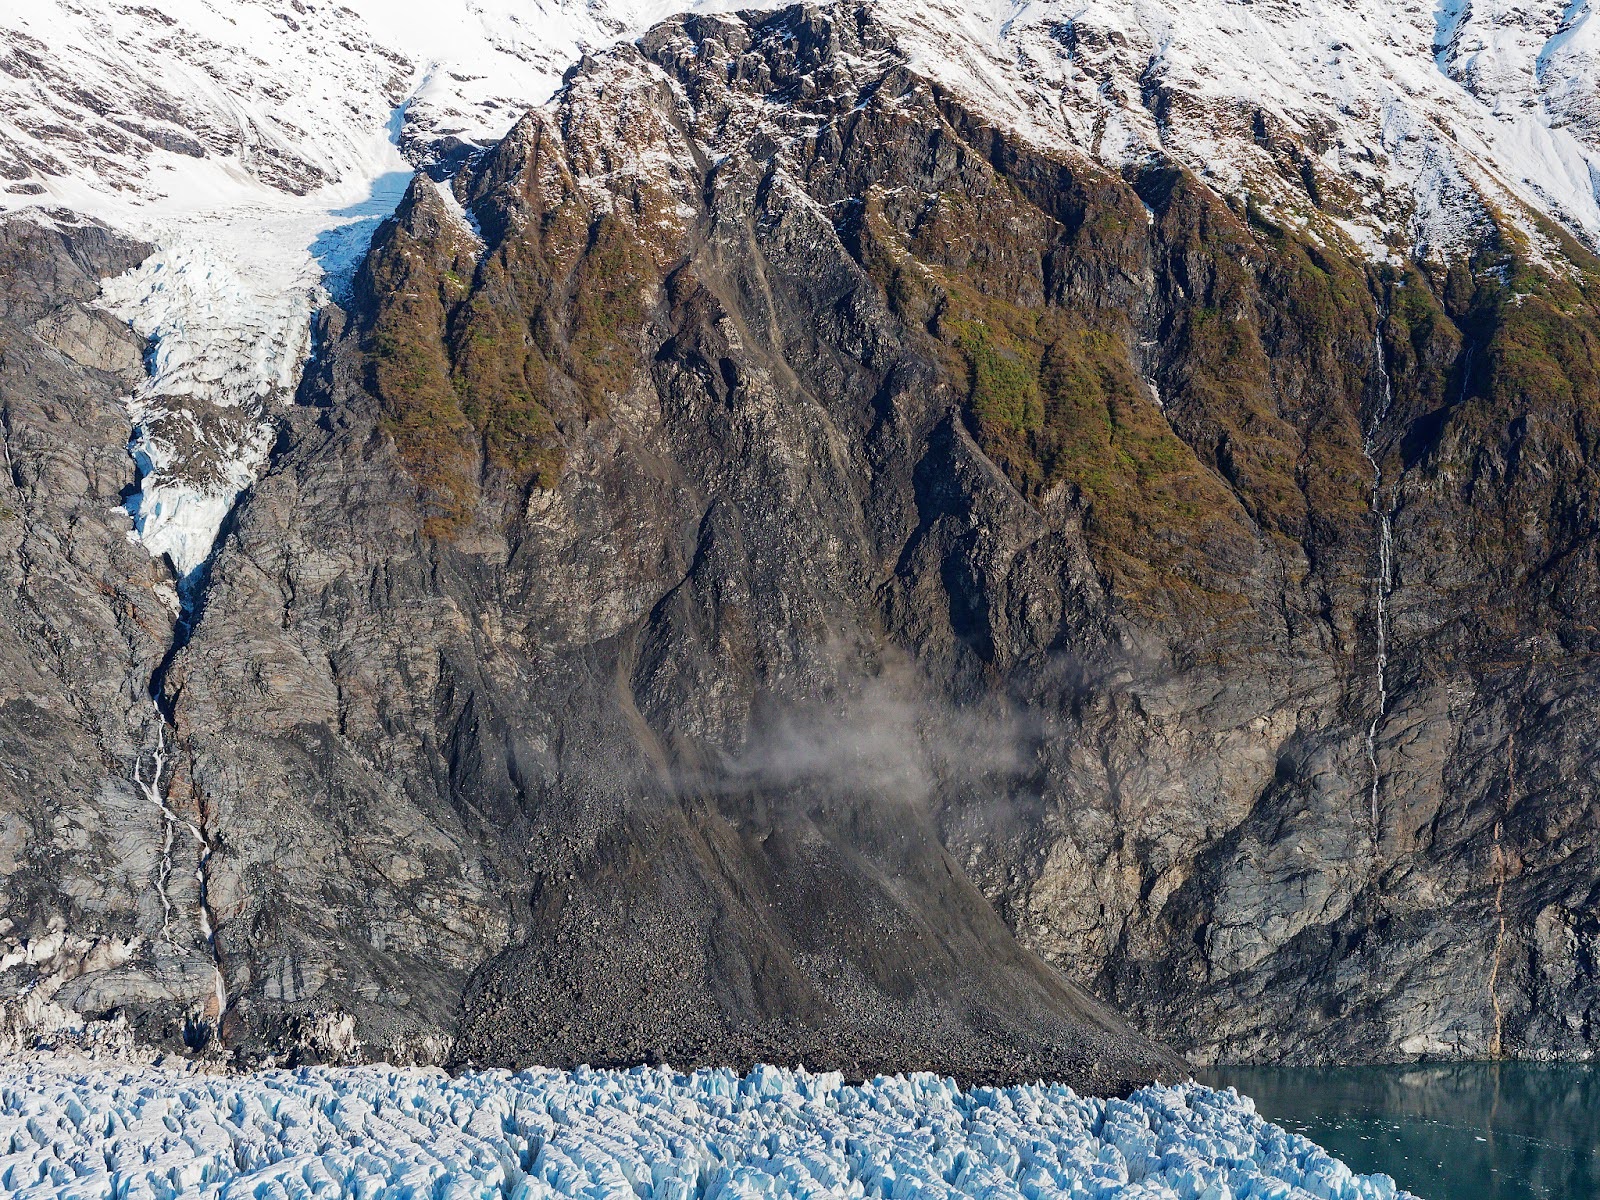
There was a series of five landslides at Surprise Glacier near Harriman Fjord in the Prince William Sound region on September 20. This sequence of landslides was ground-truthed (Figure 12). This series marks the first set of landslides ending in water that have been recorded on multiple geophysical instruments since monitoring started in the Barry Arm region in 2020 (infrasound, tide gauges, satellite imagery, and seismic sensors recorded this sequence). A 1.5-inch (4-cm) wave was produced from these slides, as estimated by tide gauge instrumentation.
On August 7, a landslide occurred in Pedersen Lagoon, southwest of Seward on the Kenai Peninsula. The estimated volume of this landslide was about 71,000,000 ft3 (2,000,000 m3)—equal to 800 Olympic-size swimming pools—and it generated a tsunami of about 56 feet (17 meters) in Upper Pederson Lagoon and 3 feet (1 meter) in Lower Pedersen Lagoon. This landslide was ground-truthed and several people at a nearby lodge witnessed the tsunami. The landslide started on the southwest-facing slope north of Pedersen Glacier. People reported damage to the boardwalks in the tidal zone at the lodge, along with an easement at a National Park Service campsite.
In 2024 we recorded less than one quarter of the number of volcanic events in 2023 (Figure 13). The Katmai Volcanic Cluster events decreased significantly from approximately 1,200 in 2023 to 172 in 2024. Mount Spurr volcano saw an increase in seismic activity starting in mid-April, which remained episodic throughout the year (Figure 14). We recorded a total of 154 events at Mount Spurr in 2024. The Alaska Volcano Observatory raised the alert level at Spurr to yellow due to increased seismic activity along with increased ground deformation.
This summary is possible through the hard work of the Alaska Earthquake Center team, from our field and systems crews that keep the data flowing to the duty seismologists. Special thanks go to the seismic data analysts for analyzing and cataloging thousands of events and seismic phases in 2024: Ayumi Bakken, Will Dienstfrey, Anthony Erickson, Derreck Gossett, Shah Khan, Natalia Kozyreva, Sarah Noel, and Owen Simonds.
For details of any of the events in this article, or an in-depth discussion of Alaska’s seismicity for the year, see the full 2024 Alaska Seismicity Summary.