
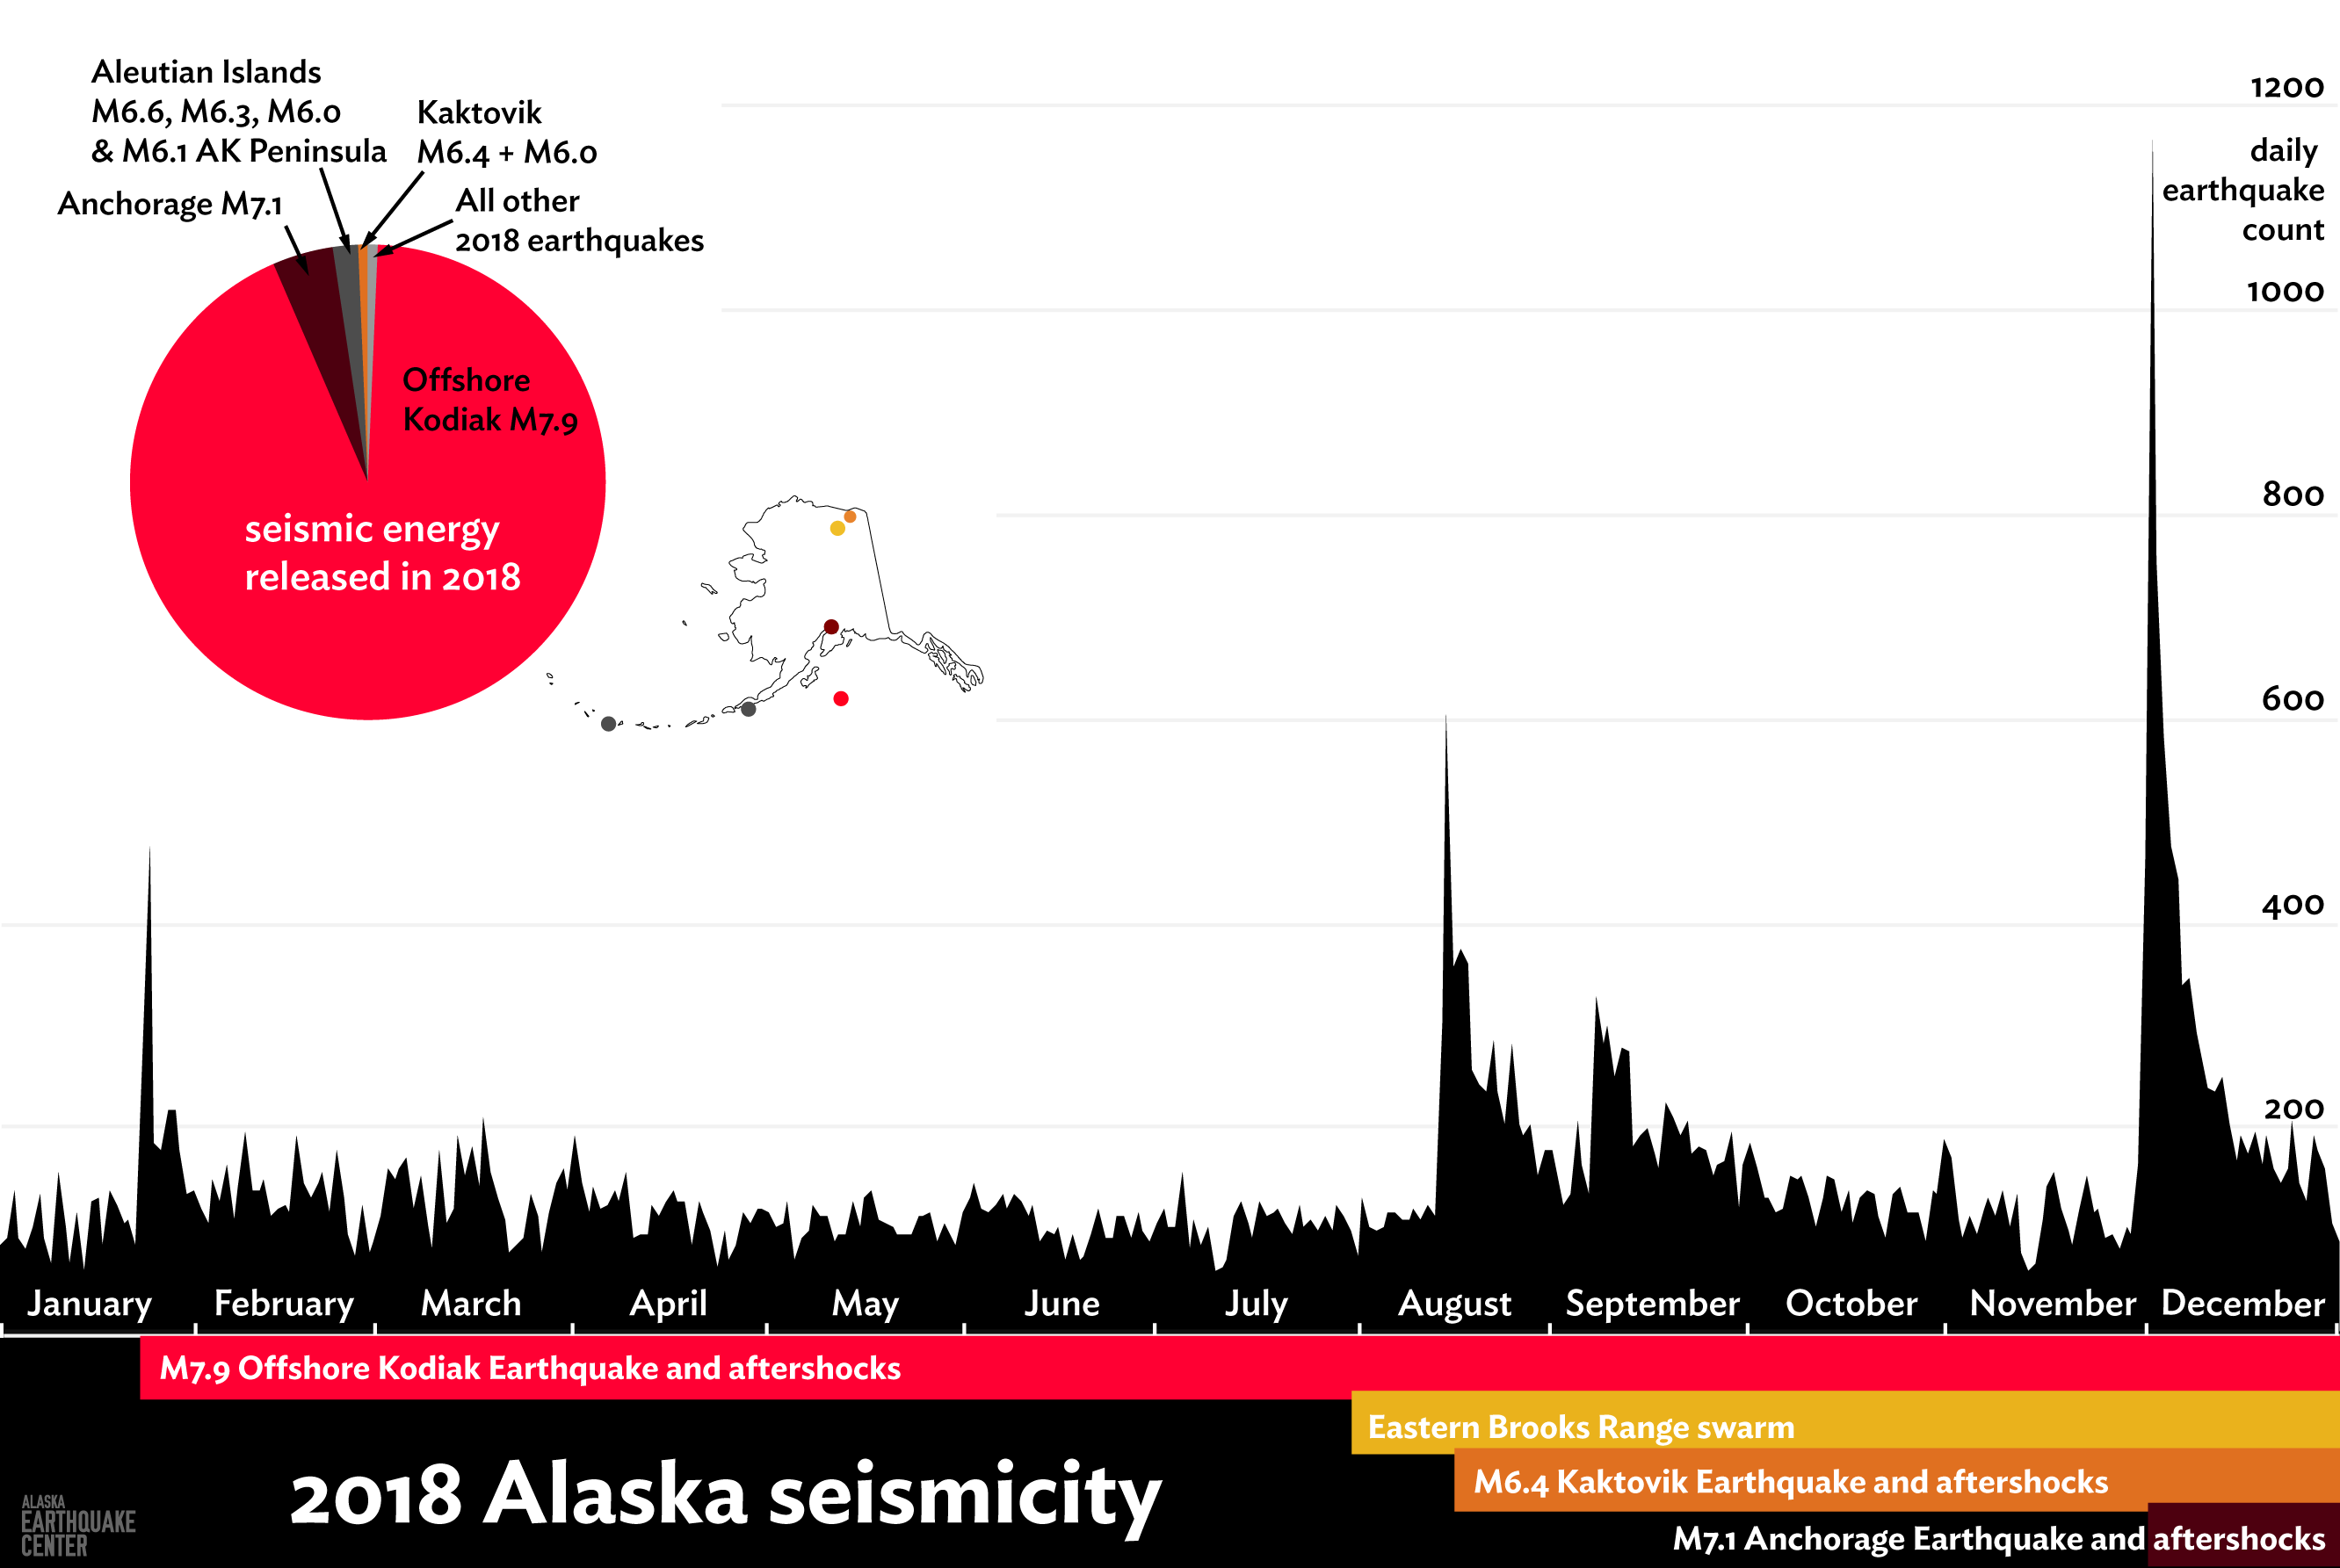


We recorded more than 55,000 earthquakes in Alaska last year. We would give you an exact figure, but we're still counting.
That's a record, and not by a little. The previous high was 42,989 in 2017, which eclipsed 2014's record of 40,686. However, there was nothing extraordinary about 2017 seismically. The record was mainly due to the addition of 157 new USArray stations from 2014-2016, which helped us to detect far more earthquakes in previously uninstrumented parts of the state, especially in the north and west.
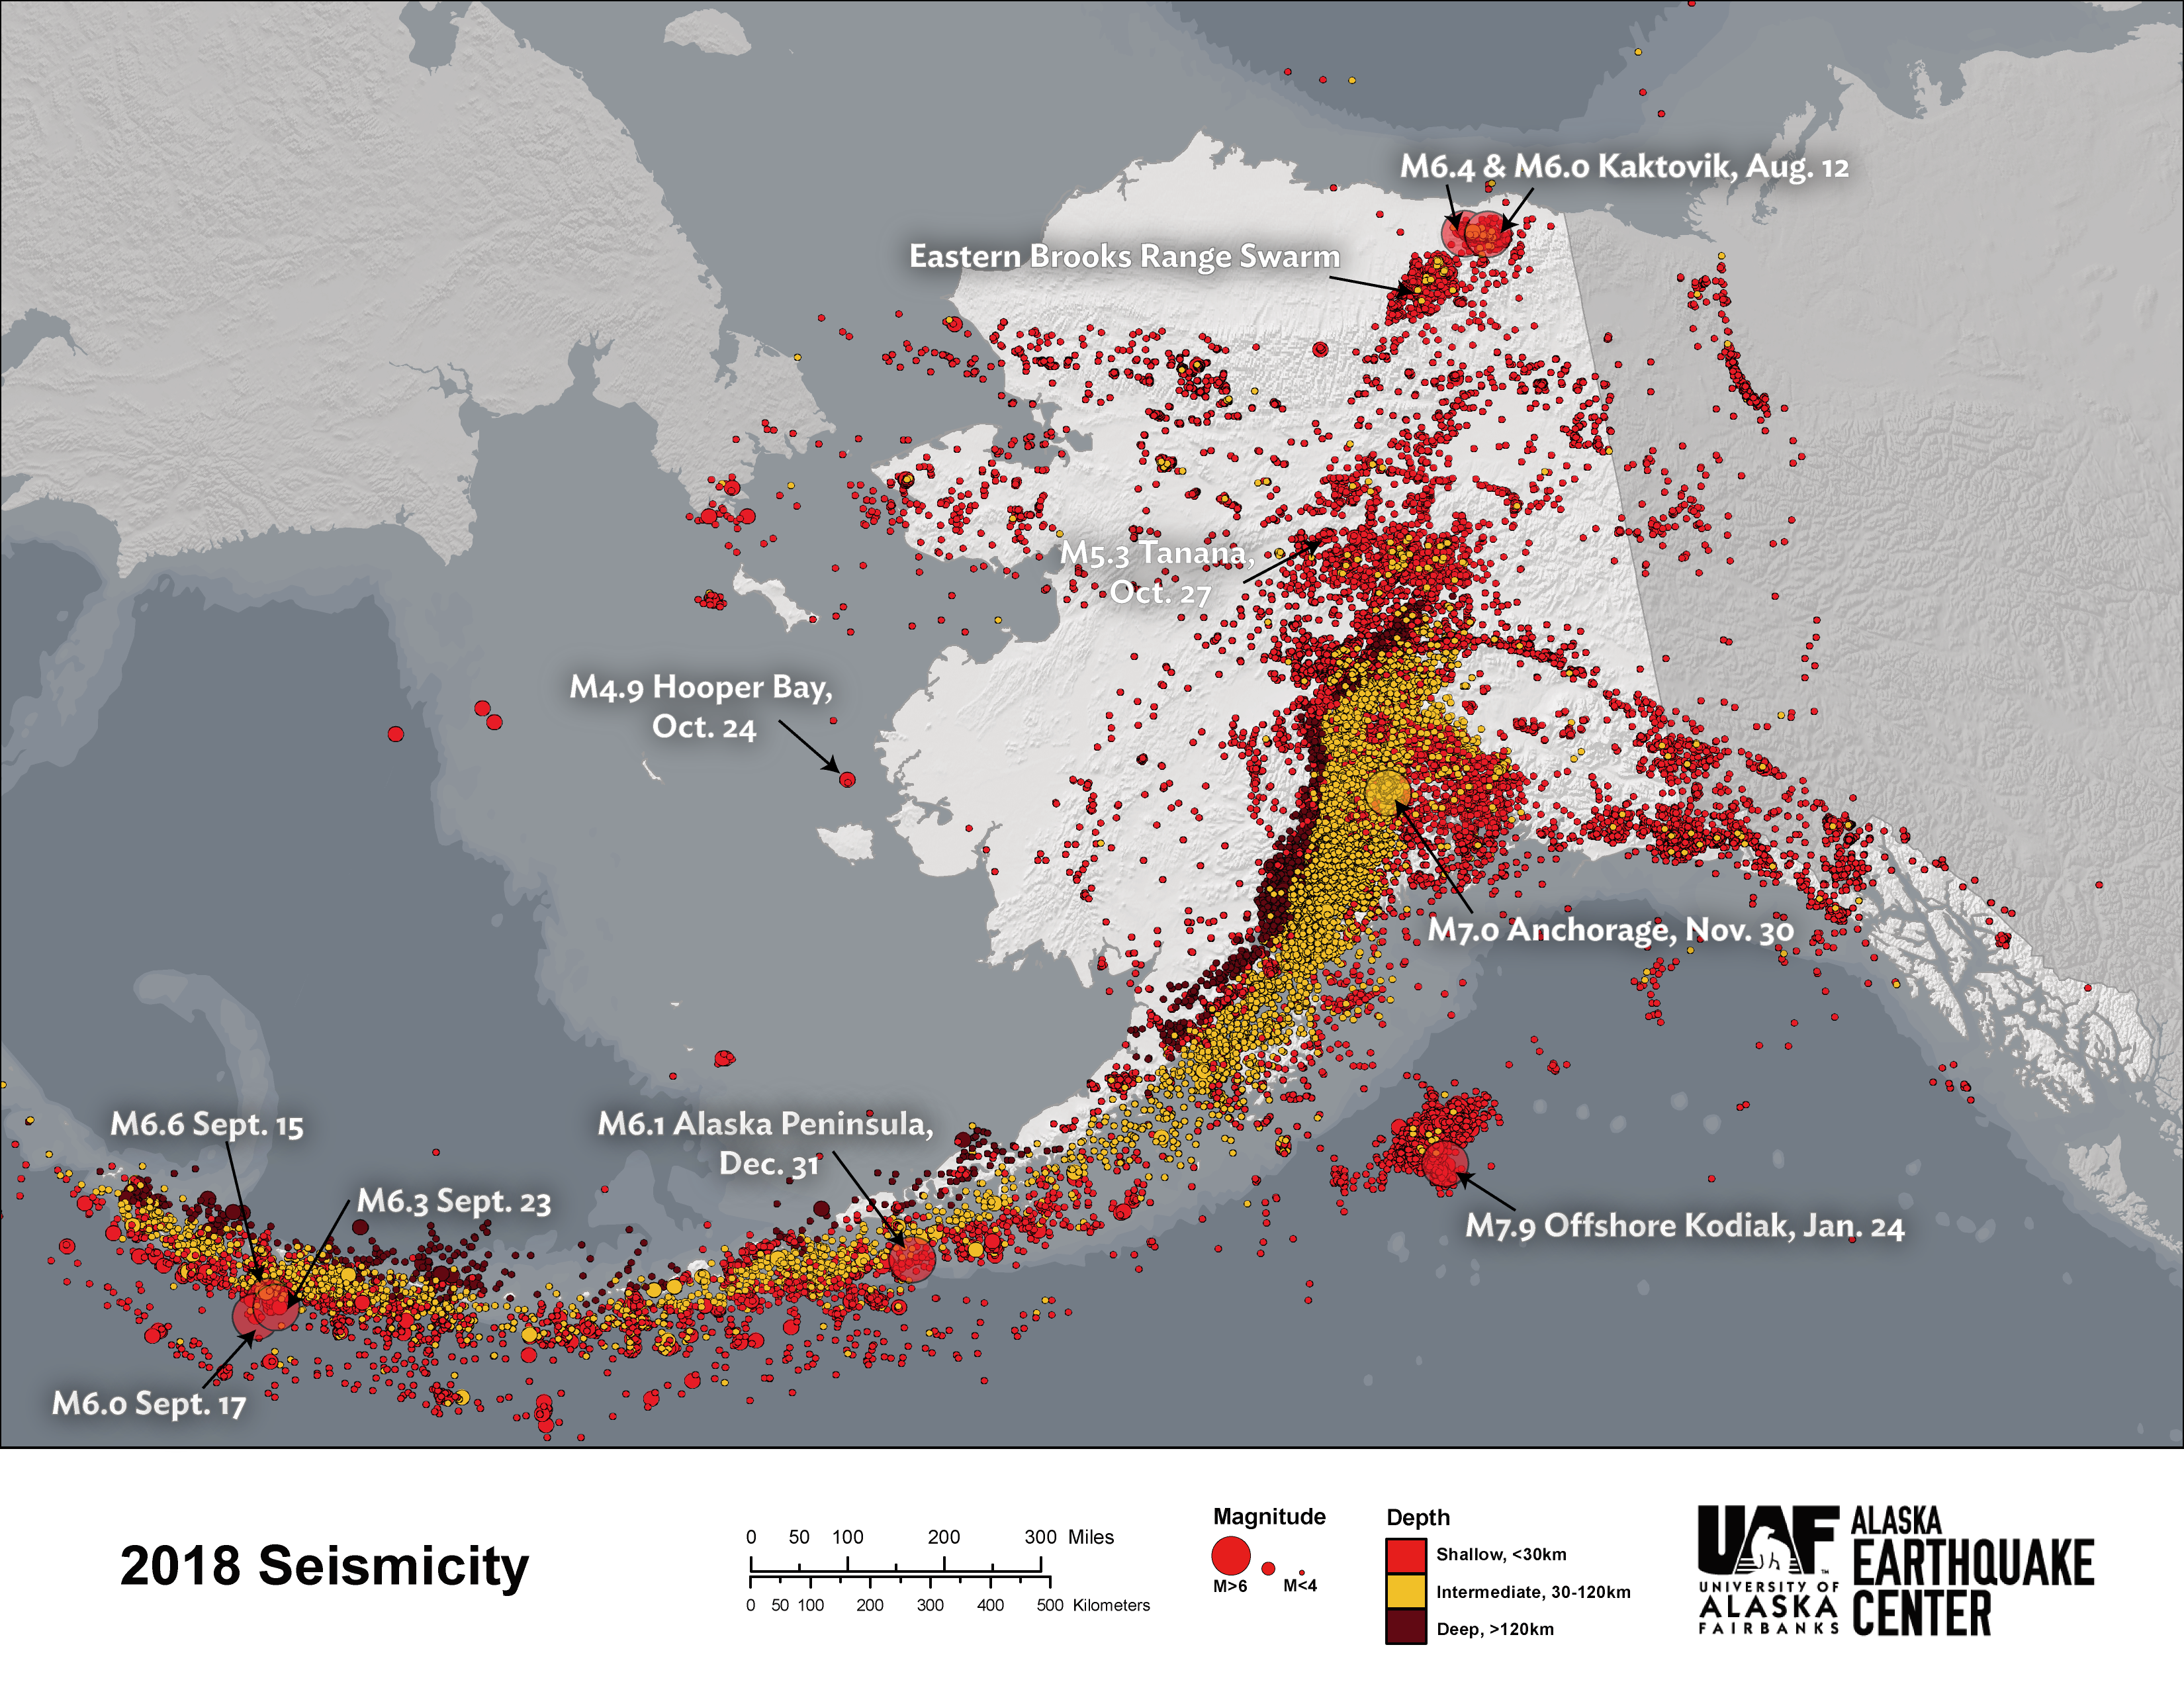
The expanded network increased our total in 2018 as well, but not as much as the vigorous aftershock sequences that have been hammering away since last January. We've recorded thousands of aftershocks from the year's two largest earthquakes, the M7.9 in the Gulf of Alaska and the M7.1 near Anchorage. Add in a months-long swarm in the Brooks Range and a very active sequence on the North Slope, and we estimate that four sequences alone accounted for 17,000 of the year's earthquakes.
This was an endurance test for our analysts, who manually check the waveforms for every earthquake and scan the data for earthquakes the automatic system missed. Their work is largely invisible to the public, but they deserve special recognition for what they accomplished this year.
The Ten Biggest
Most big earthquakes in the United States happen in Alaska, and 2018 was no exception. This year, the rest of the country failed to crack the list until number 23, a magnitude 5.3 off the coast of Southern California. Here are the ten largest.
Note that in some cases, the linked event pages have outdated magnitudes.
Notable earthquakes
Statistics only tell a small part of the story. Many of the largest earthquakes have no human impacts because they are so remote. Here is a summary of the year’s most significant earthquakes and sequences, with links to more in-depth stories.
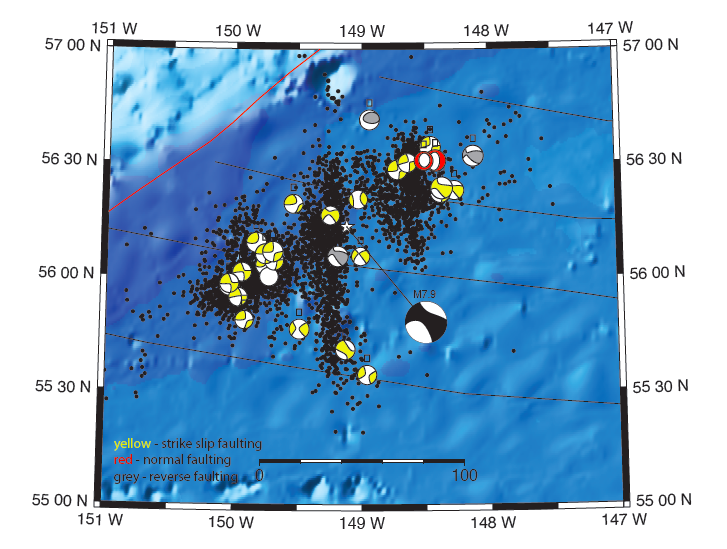
The year's largest earthquake in Alaska struck at 12:31am on Jan. 23, 180 miles southeast of Kodiak Island in the Gulf of Alaska. The National Tsunami Warning Center immediately issued tsunami warnings, leading to evacuations in communities across southern Alaska. The earthquake was felt from Unalaska to Fairbanks and even caused endangered pupfish to spawn out of season by sloshing the waters of Devil's Hole in Death Valley.
The earthquake did generate a tsunami, but its highest waves were measured in inches rather than feet. The rupture itself was complex, though, and subsequent analysis suggests a source with multiple intersecting north-south and east-west faults and a combination of strike-slip, normal, and reverse faulting.
This is a difficult area to study because the nearest seismic stations are far away, on Kodiak Island and the Alaska Peninsula. We hope to learn more through the Alaska Amphibious Seismic Community Experiment, which collected high definition bathemtry data and placed ocean-bottom seismometers in the area in July.
So far we have recorded 16 aftershocks with magnitudes of 5 or greater, and over 4,000 aftershocks altogether. That total is deceptively low, though, because we are only able to record aftershocks down to around magnitude 3 out in the gulf.
Worldwide, only one earthquake this year was larger, an extremely deep magnitude 8.2 near Fiji that caused no damage.
Most earthquake sequences follow a mainshock-aftershock pattern, where a large earthquake is followed by a gradually tapering series of smaller earthquakes. An earthquake swarm is different because there is no identifiable mainshock that sets off the sequence.
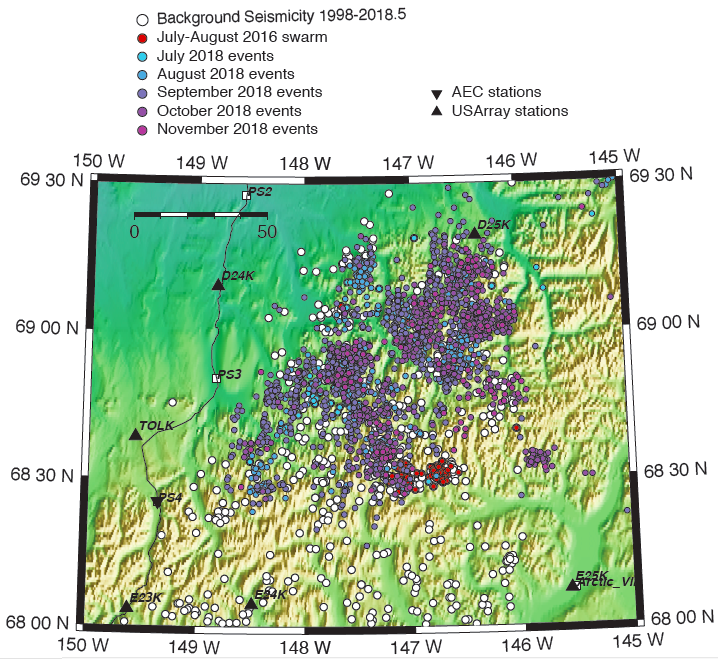
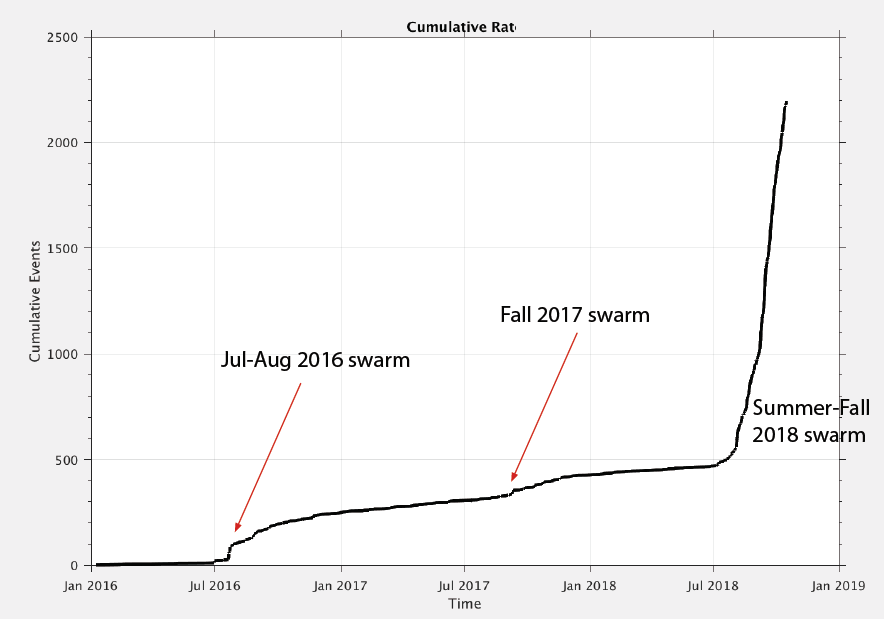
An energetic swarm began in eastern Brooks Range region in late July, with activity peaking in October. We have not identified the cause of the activity, as there are no active mapped faults in the area and there is no extensive glaciation. The largest earthquakes in the swarm are a little over M4, but most are much smaller.
There are some indications that this region may be prone to swarm-like activity, with smaller sequences recorded in 2016 and 2017. Curiously, earthquakes in this swarm lack high frequency content compared to typical crustal events in the same region.
Thanks to the new USArray stations in northern Alaska, this swarm has been recorded with unprecedented resolution, capturing high-quality recordings of events down to magnitude 1.4.
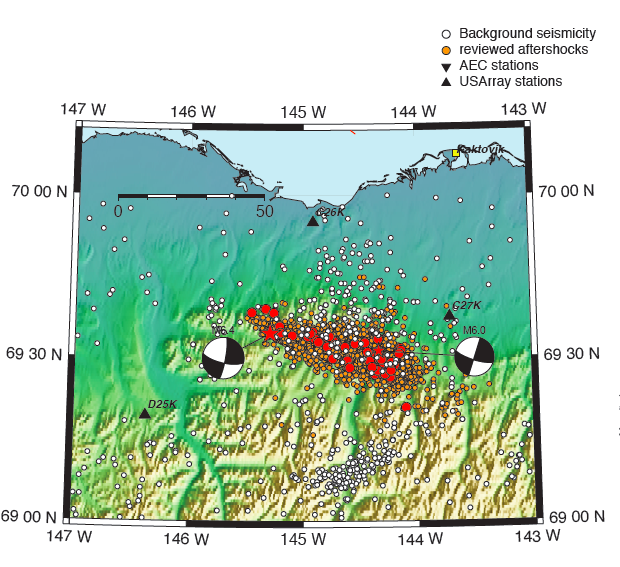
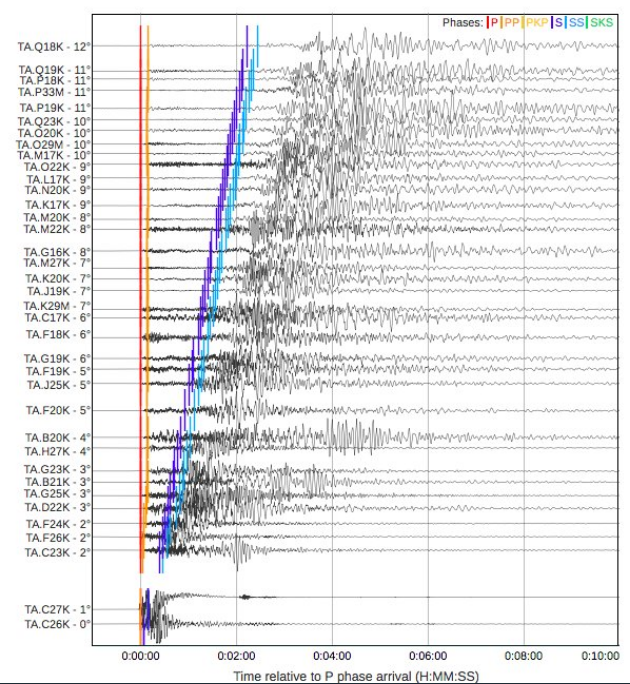
August 12 M6.4 Kaktovik
The year's most unexpected earthquake, from a seismological perspective, was the Aug. 12 M6.4 quake in the Sadlerochit Mountains, 52 miles southwest of Kaktovik and 25 miles south of the Beaufort Sea coast. This was by far the largest earthquake ever recorded north of the Brooks Range in Alaska. It started a vigorous aftershock sequence, including a magnitude 6.0 earthquake at 1:15pm on the same day. That aftershock was the second largest earthquake ever recorded in the region.
The M6.4 mainshock and M6 aftershock were both felt widely, with reports coming in from Kaktovik west to Nuiqsut and as far south as Fairbanks. There were no reports of damage or injuries, and there was no impact on pipeline operations.
The earthquake ruptured an easterly trending strike-slip fault with motion similar to that of the Tintina and Denali faults to the south. So far we have recorded over 4,000 aftershocks, and the sequence is ongoing.
This region is poorly understood, so these earthquakes will be extremely important for studying North Slope seismicity. We are fortunate that this earthquake happened during the Transportable Array deployment in Alaska. Before 2013, the nearest stations would have been at Pump Station 1 and Pump Station 4. Instead, we have high quality recordings from a number of research-grade stations fairly close to the source.
August 15-23 M6.6 and M6.3 quakes off Tanaga Island
Also in August, a pair of strong earthquakes struck south of Tanaga Island in the western Andreanofs. The first, a magnitude 6.6 on Aug. 15, was felt lightly in Adak and Unalaska. This quake was followed by a magnitude 6.3 on August 23, about 12 miles southeast of the earlier quake. The area averages one or two magnitude 6 megathrust earthquakes annually, so activity like this is expected. The largest earthquake in recent memory there was a M7.2 in 2007.
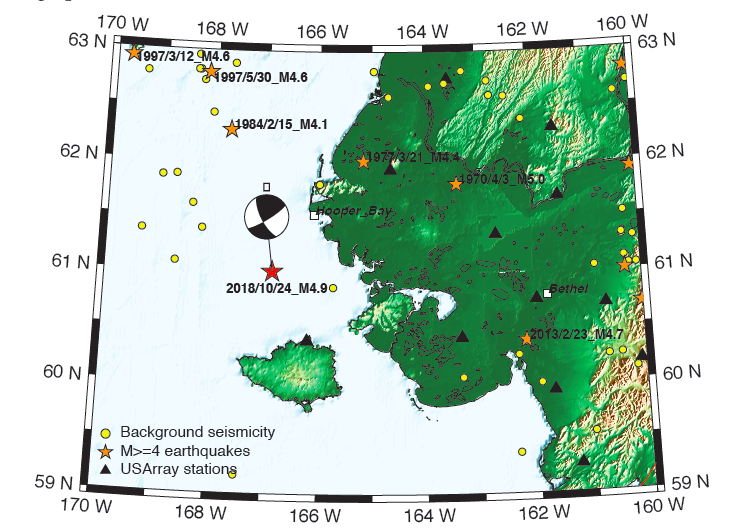
October 24 M4.9 Hooper Bay
The smallest earthquake on this list might also be the most enigmatic. The Y-K Delta has very few earthquakes of any size, so a magnitude 4.9—the largest ever recorded in that area—is far more newsworthy than it would be in Southcentral. The earthquake was well offshore of Hooper Bay but was felt in communities throughout southwest Alaska. Unfortunately, we know very little about faults in this region. Because earthquakes are so rare there, and because in the past we had no seismic stations nearer than Nome, we have very little information to work with.
October 27 M5.3 Tanana
The most widely felt Interior Alaska event was a Saturday morning M5.3 earthquake centered about 15 miles up the Yukon River from Tanana. This was not an unusual type of earthquake for the region, but it was the most strongly felt in Tanana for many years, strong enough to shake goods off store shelves. The earthquake was felt in communities as far away as Fairbanks to the east and Huslia to the west.
November 30 Anchorage M7.1
This one is fresh in all of our minds. At 8:29am, a fault inside the subducting Pacific plate ruptured at a depth of about 20 miles under Point Mackenzie. The rupture itself lasted for about 11 seconds, which translated to twenty seconds or more of violent shaking in Anchorage and Mat-Su. Miraculously, there were no deaths, but early estimates put the damage to homes, businesses, and public facilities at $76 million, making this the most damaging earthquake in Alaska since 1964.
From a seismological perspective, this earthquake was nothing out of the ordinary. Recent examples of large, intraslab earthquakes near Anchorage include the 2016 M7.1 Iniskin earthquake and the 2014 M6.3 Skwentna earthquake. Both of those were much deeper, though, and not nearly as close.
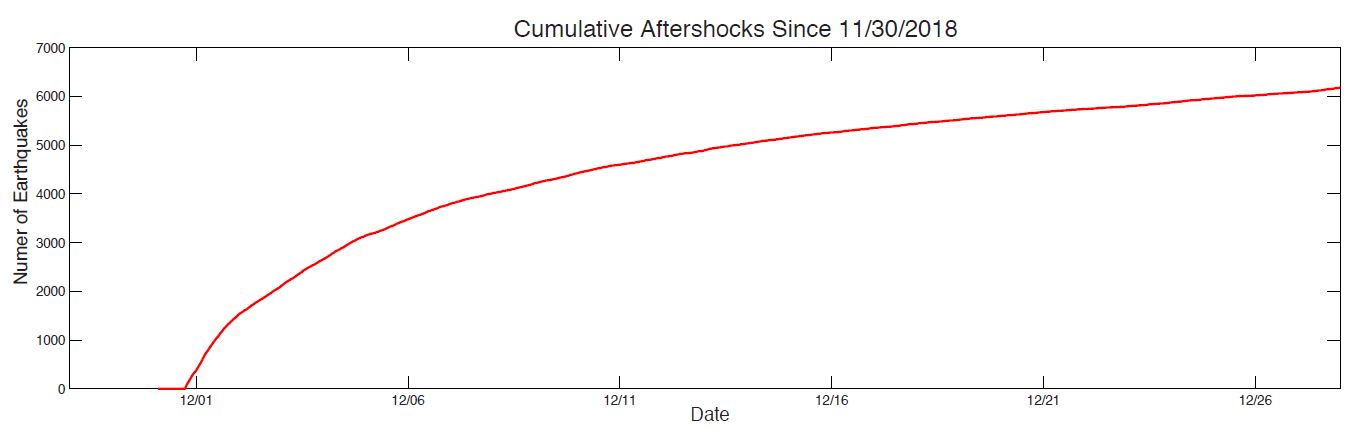
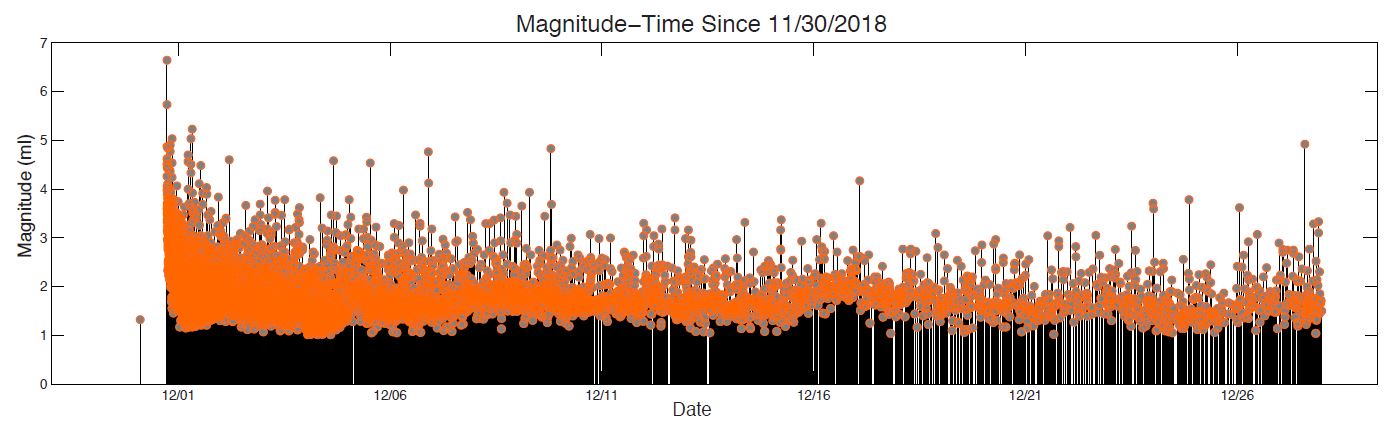
The aftershock sequence has been typical for an earthquake of this type. We recorded 3,000 aftershocks in the first week, and around 6,000 by the end of the year. Out of these, six had magnitudes of 5 or greater. Unfortunately, we expect this to continue through 2019. If you have questions or concerns about the aftershock sequence, please read this piece.
Alaska's news outlets have covered this earthquake from every possible angle, beginning in the chaos immediately after the quake. The Anchorage Daily News is collecting all of their stories under the 11-30-18-alaska-earthquake tag. You can find Alaska Public Media's excellent coverage here. Smaller outlets have published many vital stories as well.
For the rest of the country, this was a three-day story. Among the many lessons from this earthquake, we should recognize how essential local journalism is to living in Alaska.
Southcentral Alaska weathered the magnitude 7.1 earthquake in remarkably good shape, but the impacts were serious. Many residents are dealing with expensive damage to their homes, and some homes are not yet safe to live in. We have just learned that two Eagle River schools will not be able to open for the 2019-2020 school year. Many Alaskans have also experienced anxiety and other mental health impacts from the quake and its aftershocks.
Dec. 30 M6.1 near the Shumagin Gap
Alaska closed out the year with a magnitude 6.1 earthquake on December 31, about 70 miles southeast of Cold Bay. The earthquake was felt lightly from Unalaska to Kodiak Island. Back in July, magnitude 5.6 and 5.9 earthquakes had struck on consecutive days about 30 miles to the east. These were all megathrust earthquakes occurring either in or just west of the Shumagin Gap, an area of considerable seismological interest due to its unknown potential for generating large earthquakes and tsunamis.
This region typically experiences about one earthquake of magnitude 6 or larger every other year. The largest recent earthquakes were in 1991 and 1993, both with magnitudes of 6.9. Earlier this year, the Alaska Amphibious Community Seismic Experiment deployed ocean-bottom seismometers to this region to further our understanding of its tectonics.
Perspective
The Anchorage earthquake and the much larger Offshore Kodiak earthquake both offer lessons that can make us safer in the future. Offshore Kodiak served as a tsunami evacuation drill for many communities. Hopefully it will spur residents and officials to revisit their earthquake preparations and emergency operations plans.
Some of the lessons from Anchorage and Mat-Su are already clear, while others will take time to unfold. For state and local government, the earthquake was a test of our plans and services and should provide invaluable information about where we need to improve. For individuals, we hope that everyone is more motivated now to learn about their risks and do what they can to prepare their families and homes for large earthquakes.
When we crossed the 50,000 mark in mid-December, people asked us if this was a trend—if seismic activity was increasing in Alaska. While 2018 was an extremely active year, 2017 was not. The record year before 2014 was 2003, thanks to the aftershocks from the M7.9 Denali Fault earthquake. High yearly totals are always driven by major aftershock sequences. Expanding the seismic network increases those numbers further by capturing more small earthquakes.
In other words, the answer is no, this is is not a trend, but Alaska is always at risk from large, damaging earthquakes. The events of 2018 do not make that any more or less likely in 2019.
Note: On March 8, we revised the magnitude of the November 30 Anchorage earthquake upward, from 7.0 to 7.1. This piece has been edited to reflect that revision.