
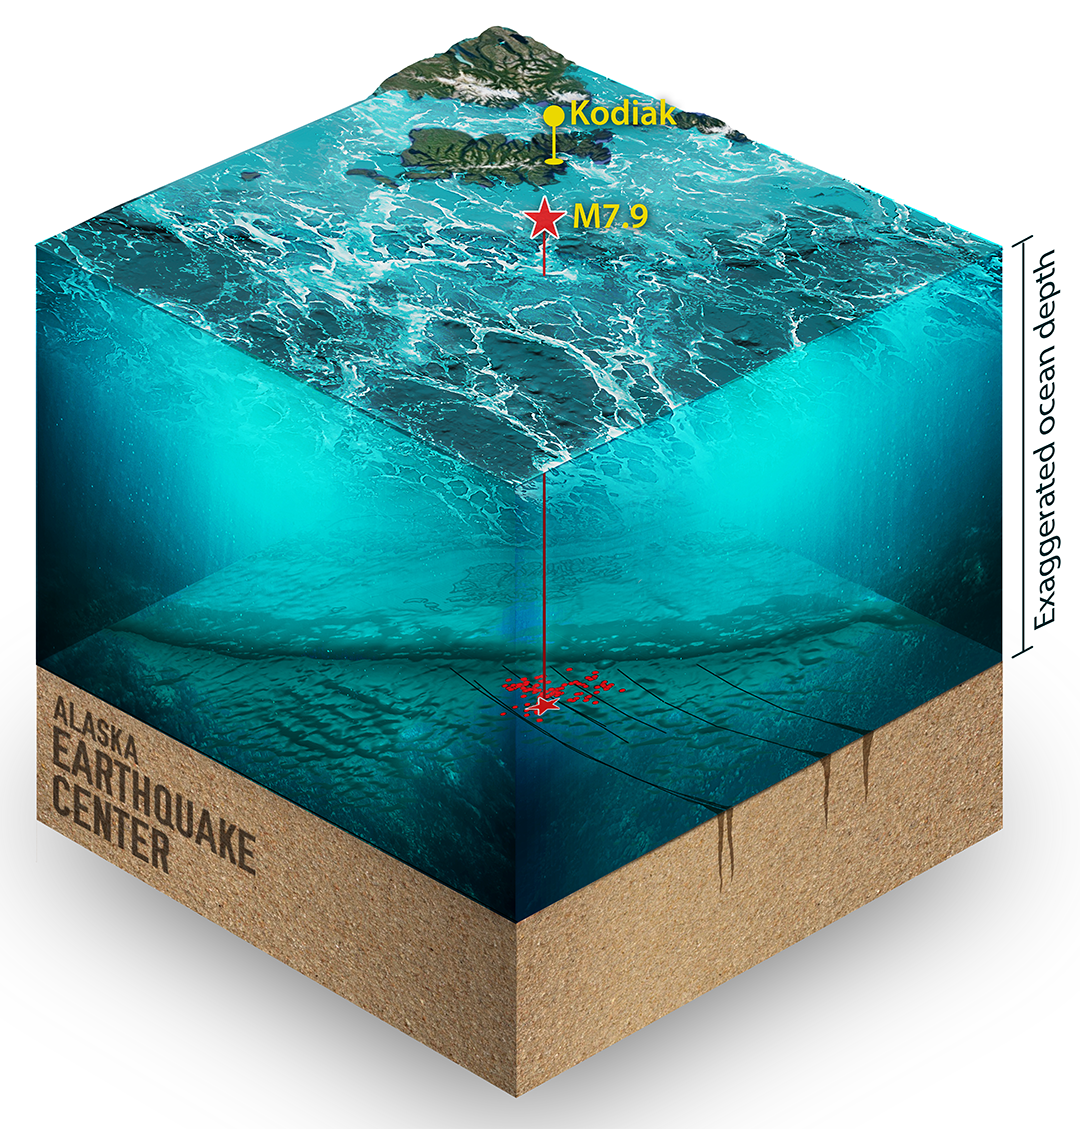
IMPORTANT NOTE: the depth of the ocean is exaggerated to show the aftershocks better. Kodiak Island is about 66 times longer than the water depth shown here.
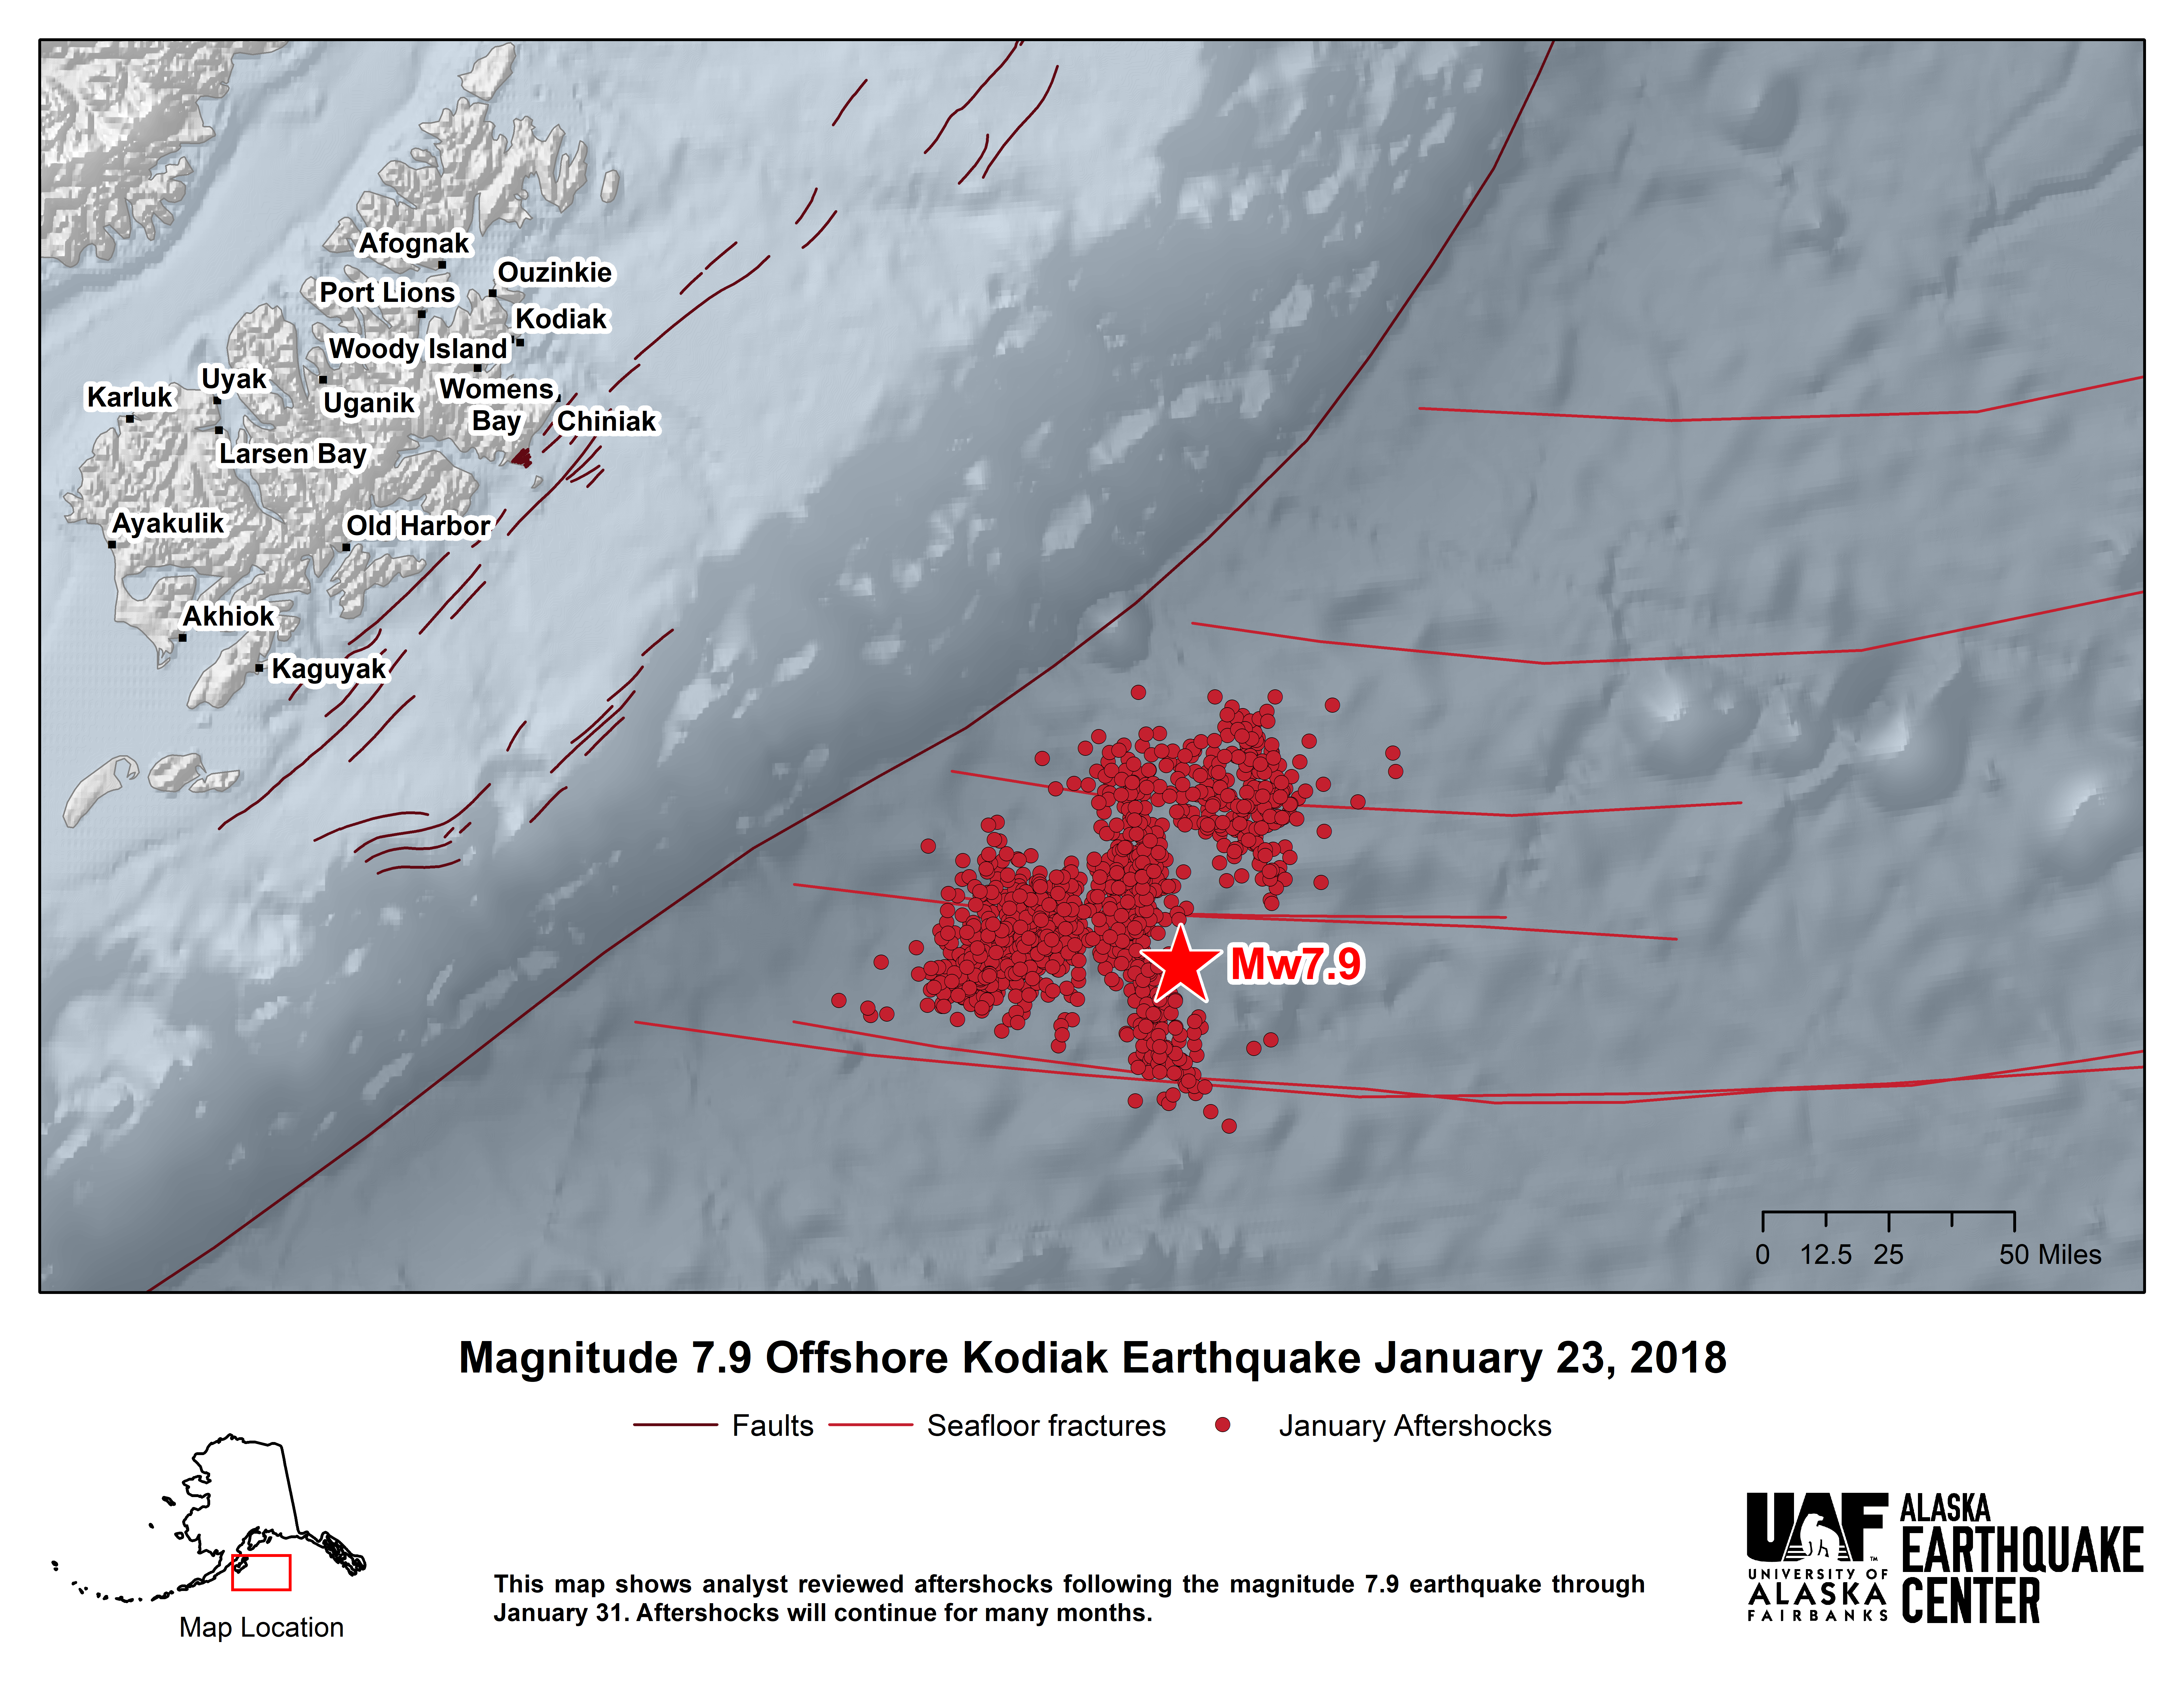


At 12:31am on January 23, a magnitude 7.9 earthquake struck in the Gulf of Alaska about 180 miles southeast of Kodiak Island (see figure 1). It was the second time in three years that an early morning January earthquake woke Alaskans across the state. In 2016, the magnitude 7.1 Iniskin earthquake had brought Southcentral’s most violent shaking in recent memory. By contrast, Anchorage residents described the magnitude 7.9 as a far gentler ride, and there were no reports of significant damage.
Still, the earthquake was felt from Unalaska to Fairbanks to Juneau and affected ground water levels as far away as Florida. It caused a seiche in Death Valley’s Devil’s Hole that spurred endangered pupfish to spawn out of season. Perhaps most important, tsunami warnings forced communities around the gulf to evacuate, testing their preparedness in the real-world conditions of a winter night.
After large earthquakes, we establish the basic facts—location, depth, time, and magnitude—in the first thirty minutes. By then, seismologists are already working to understand the nature of the rupture that caused the shaking. Which fault or faults ruptured? In what direction and over what distance? Was the earth on either side of the fault sliding horizontally, pulling apart, or pushing together? Answering these questions is critical for assessing tsunami potential, forecasting aftershocks, and improving our understanding of the area’s potential for future earthquakes.
Unlike the Iniskin earthquake, which was a large but straightforward example of a common type of Cook Inlet earthquake, the Offshore Kodiak quake was enigmatic from the start. Though very powerful, it occurred at shallow depths in what geologists call the outer rise, far from the subduction zone. Pinning down exactly what happened was made harder by the epicenter’s remote location. The nearest seismic station was 180 miles away.
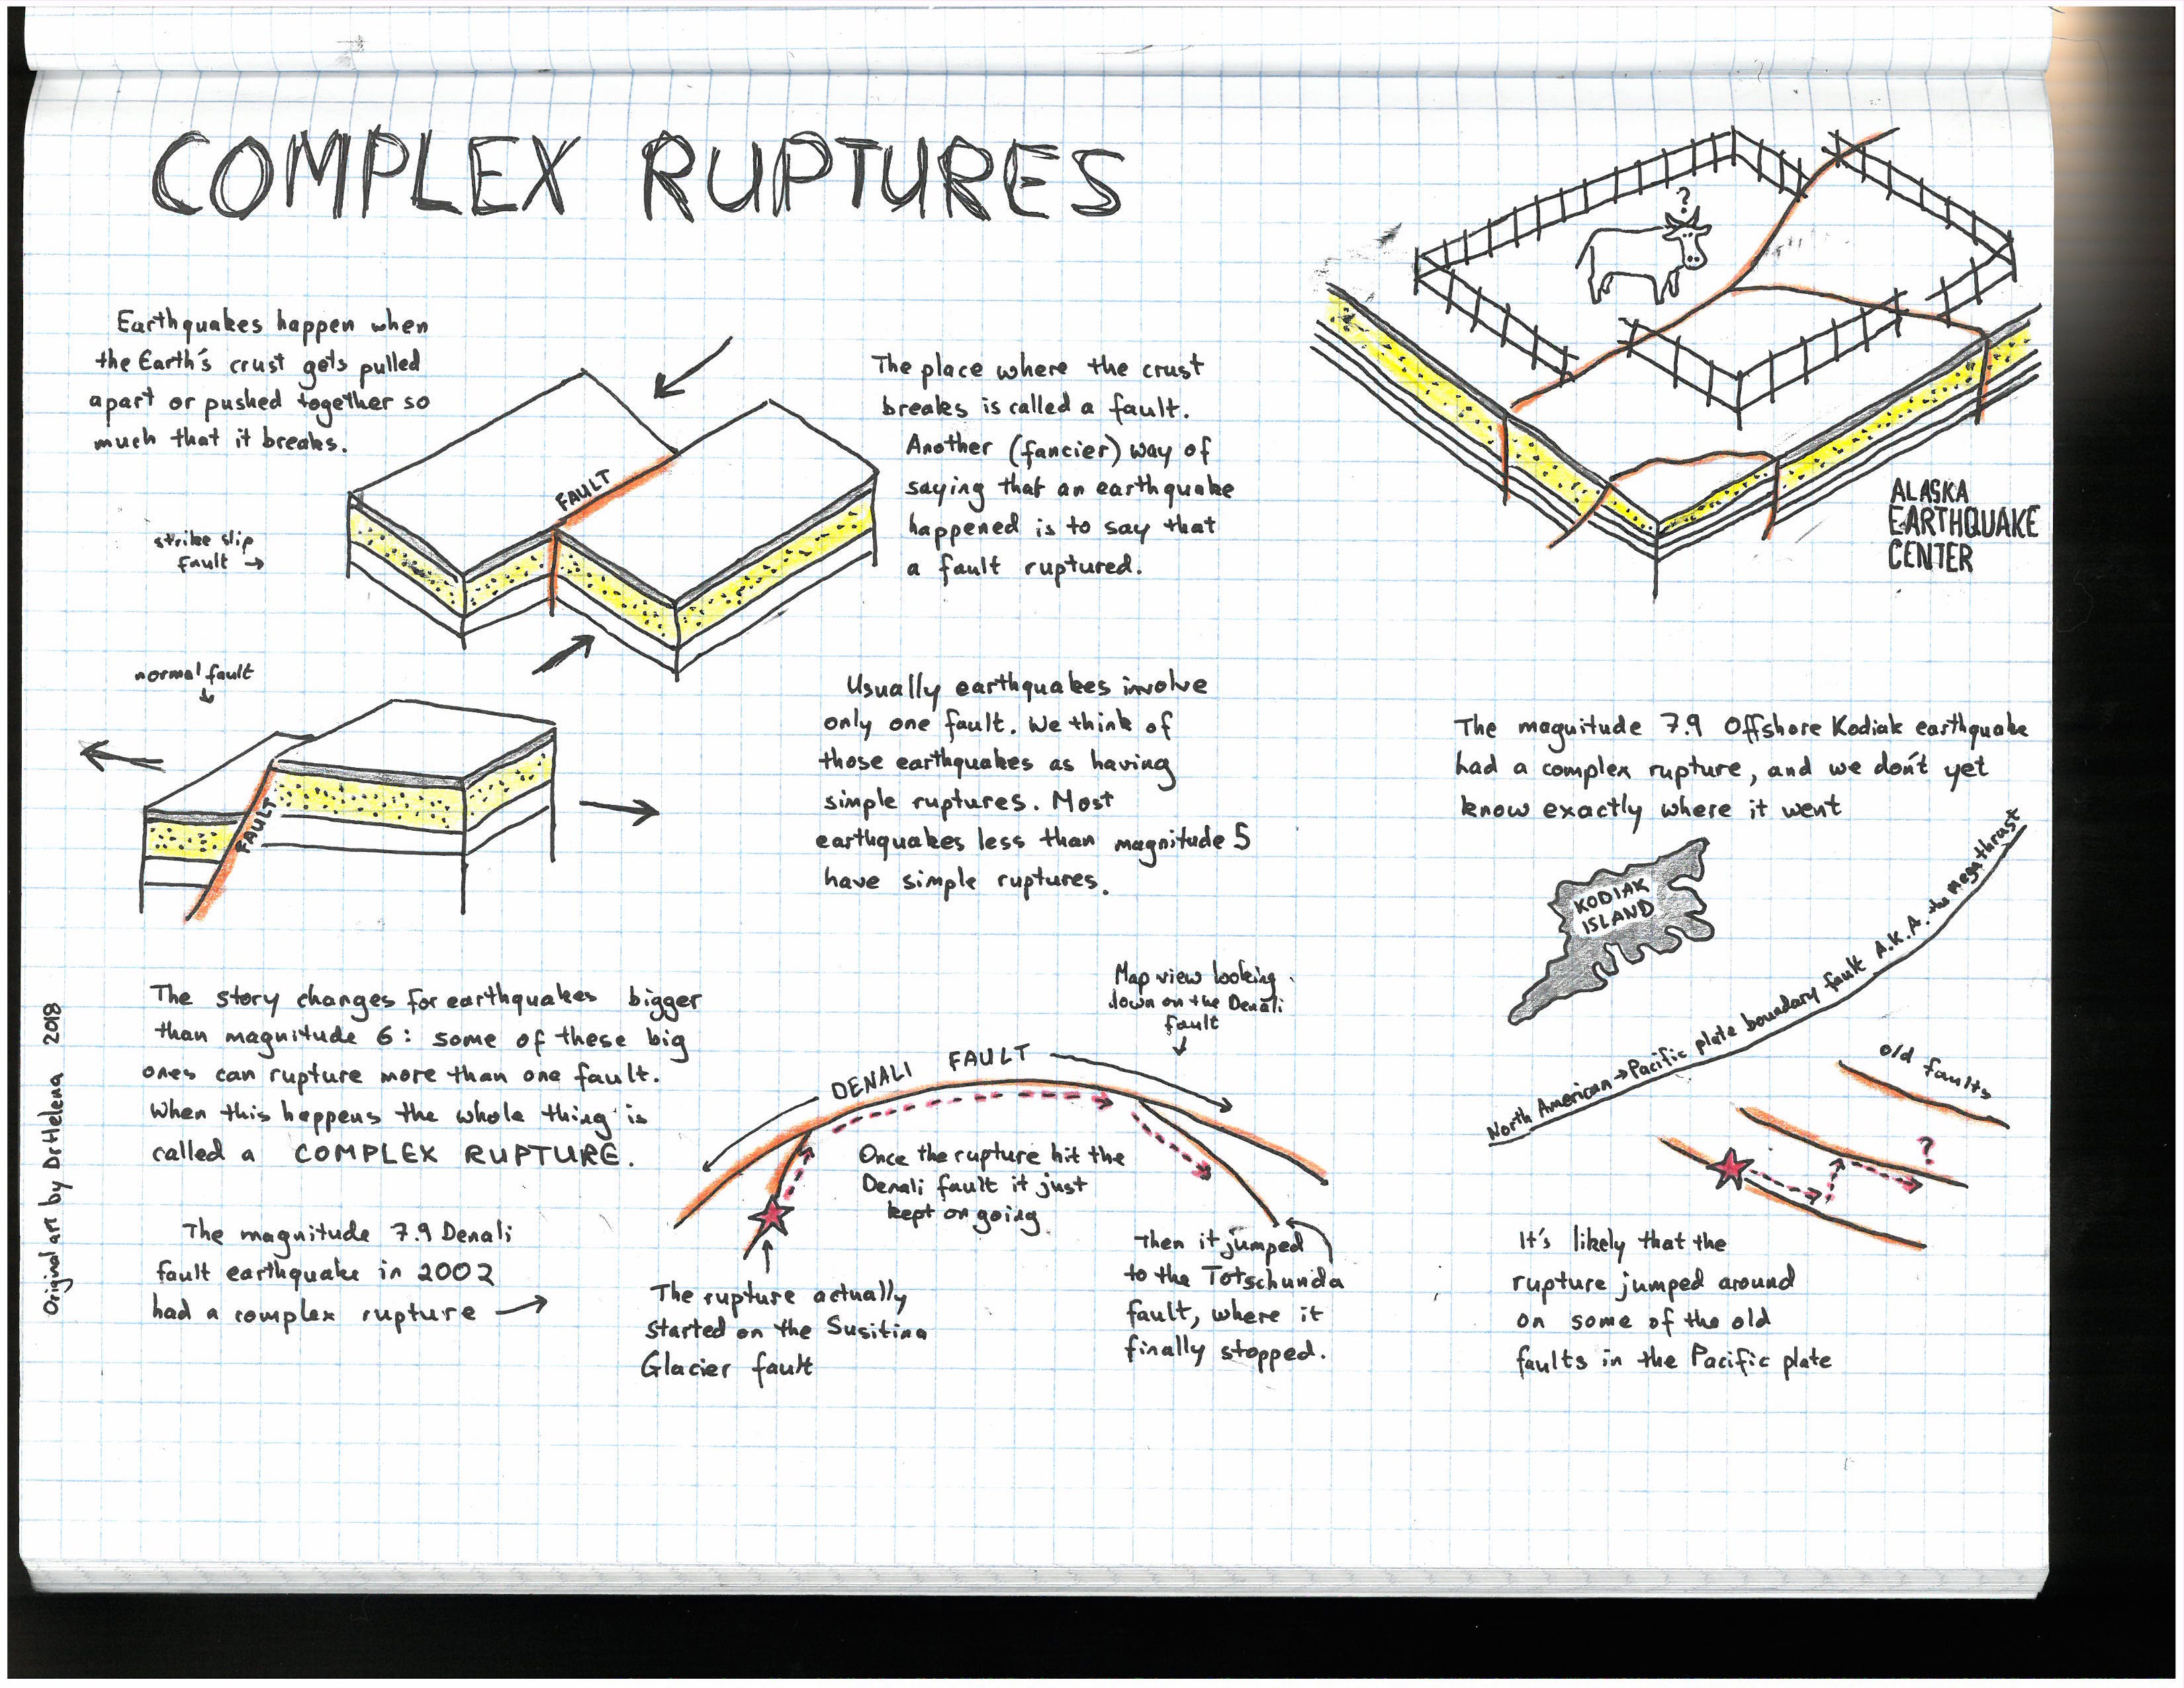
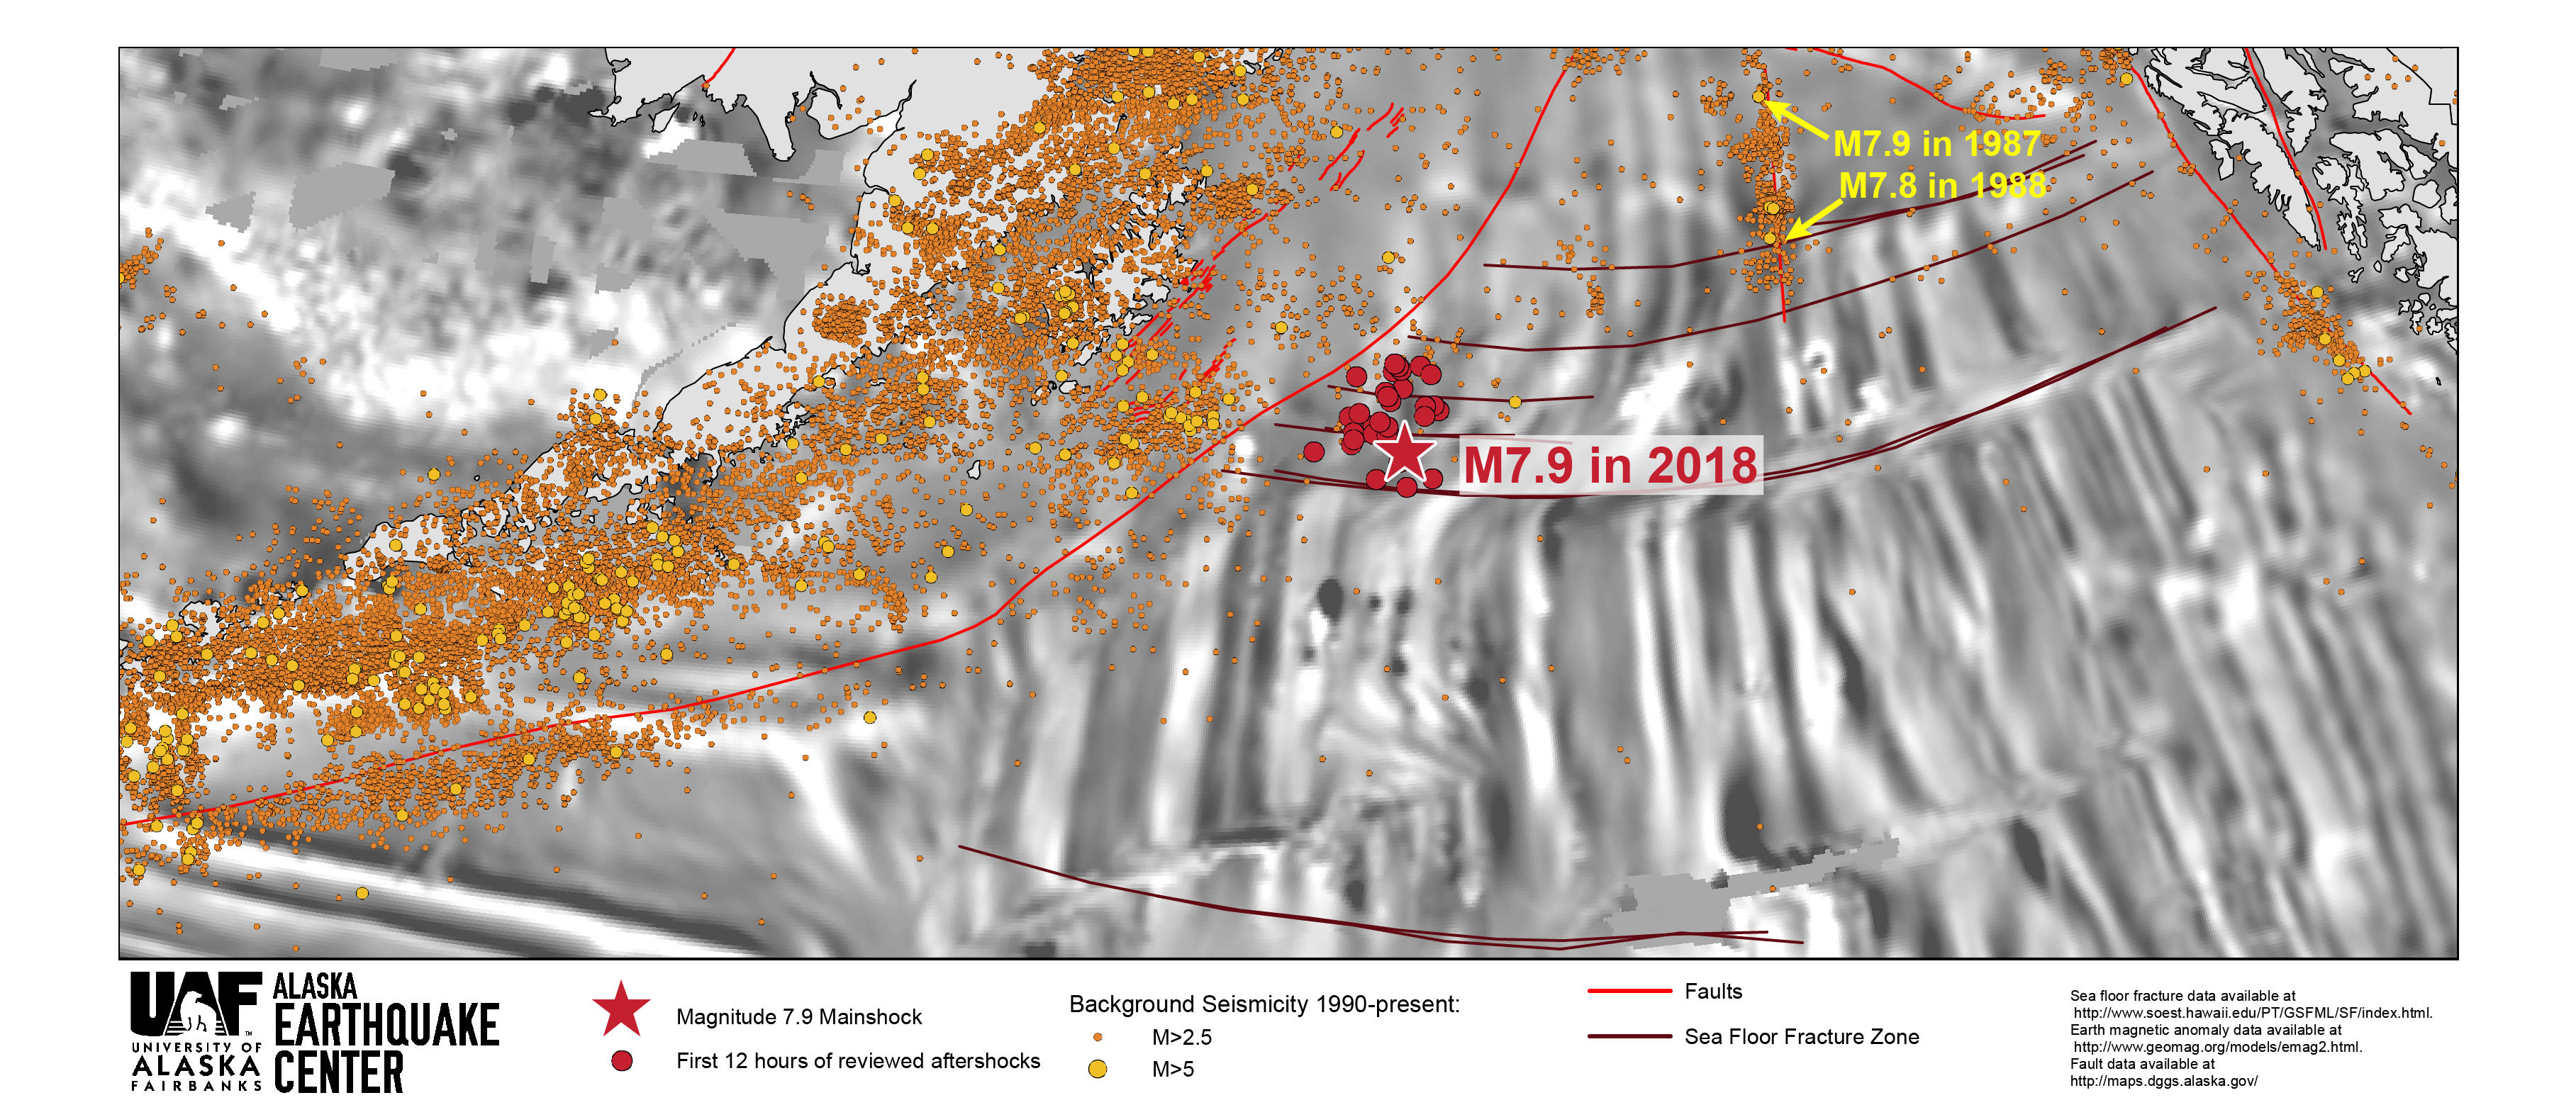
The data from the M7.9 mainshock indicated a southwest-to-northeast rupture with strike-slip motion, which for an event of this size might be around 140 miles long. Initial analyses assumed a straight line rupture on a single fault. Over the next few hours, the earthquake’s aftershocks suggested that the real picture was a good deal more complicated. Aftershocks occur along an earthquake’s fault plane, so the distribution of aftershocks helps to define the rupture’s boundaries. The aftershocks from the Offshore Kodiak extended north and south as well as east and west (see figure 2). That meant that a simple model of a strike-slip earthquake along a single seafloor fracture could not fully explain the rupture. More likely, the earthquake fractured a series of interconnected faults (see figure 3), perhaps along existing seafloor fractures (see figure 4).
So far, more than 1,400 aftershocks have been located. Moew than 100 aftershocks have had magnitudes greater than 4, and eight of those had magnitudes greater than 5. Because the sequence is happening so far offshore, our analysts must comb through the data manually to find smaller earthquakes missed by the automated system—and they are finding hundreds of these every day. We expect these aftershocks to continue for many months.
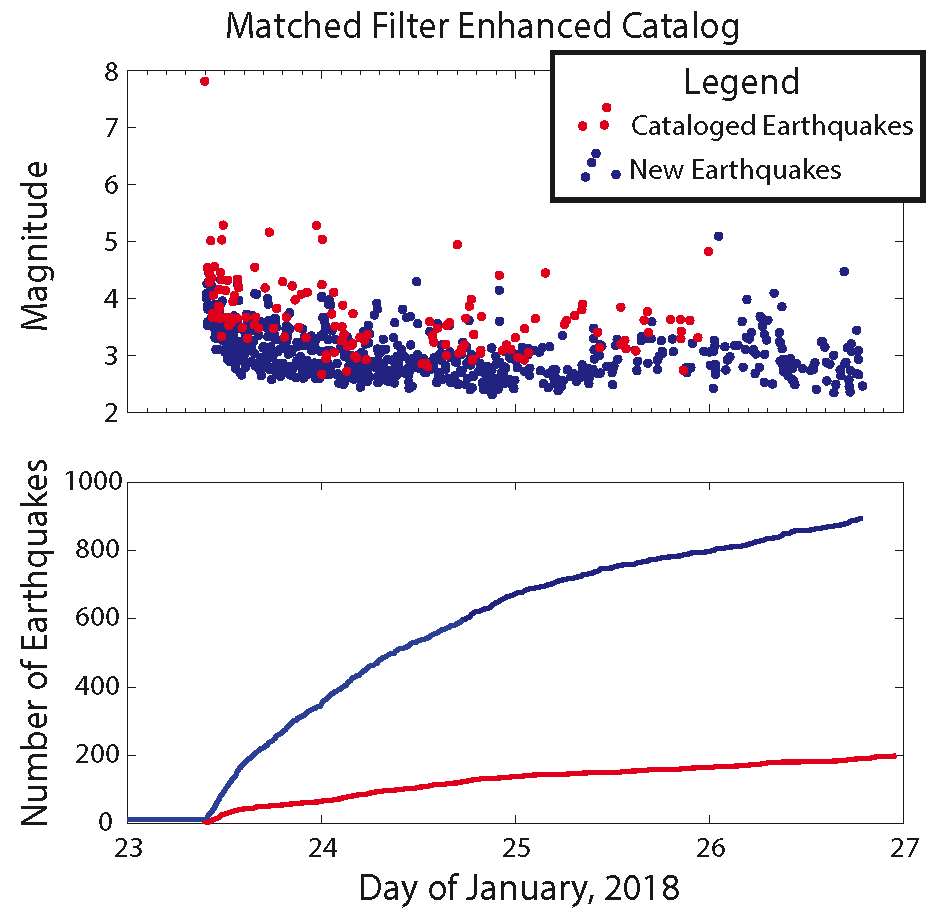
Using the aftershocks we have located conventionally, we can find even more through a technique called network matched filtering. It’s not unlike fingerprint recognition. If the waveforms from a known earthquake match similar waveforms recorded at different times, we know those waveforms represent an earthquake of similar origin that we missed because it was either too small or obscured by seismic noise. Using network matched filtering, we have already analyzed about 1700 additional aftershocks hidden in the first week’s data (see figure 5).
Studying the aftershocks, and in turn improving our understanding of the mainshock’s rupture, will help to address a question we are often asked after a major earthquake: What does this earthquake mean, if anything, for future activity on the nearby subduction zone? Is it more or less likely now to produce a major earthquake?
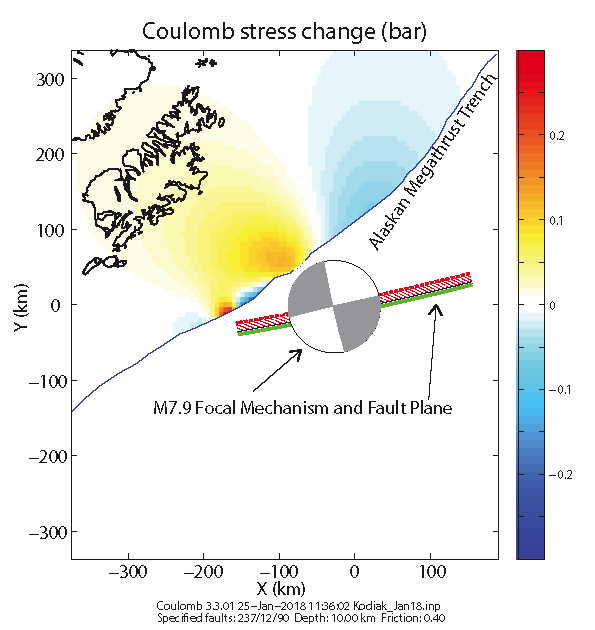
We try to address this question by modeling Coulomb stress change, which is a way of summarizing how much the various forces acting in the crust increase or decrease the likelihood of faulting. Coulomb modeling requires inputting a finite fault model, which is an estimation of the rupture properties of a large earthquake. Based on the preliminary Offshore Kodiak model—which assumed a straight-line rupture—our results suggest increased stress on the section of the subduction zone nearest to Kodiak Island and decreased stress just east of Kodiak (see figure 6). However, this stress change would be small, on the order of 0.1 bar, or about one-tenth the force of atmospheric pressure at sea level. While some studies suggest that a 0.1 bar increase may be enough to trigger seismicity, the effects most likely would be small or unnoticeable. Of course, as the finite fault model improves, the Coulomb modeling will as well.
This is just some of the research already underway, but it gives an idea of how research proceeds after a major earthquake. Painstaking analysis of the earthquake and its aftershocks opens up other avenues of inquiry, and over time we fill in our knowledge of an area about which we knew little before.
We view large, non-damaging earthquakes like these as an opportunity. For local officials, conducting real evacuations is invaluable for assessing their disaster plans. For ordinary citizens, earthquakes like these often provide the motivation to put together a survival kit or a family emergency plan. For scientists, unusual earthquakes like these increase our knowledge of earthquake hazards, both locally and in general. But it’s crucial to remember that this earthquake did not cause damage or death for two reasons: it occurred far from cities and towns, and the particular style of faulting did not generate a dangerous tsunami. A similar earthquake occurring closer to populated areas would have devastatingly strong shaking. Even an earthquake in the same place that happened to rupture in a different style, or that generated submarine landslides, could have inundated many Alaska communities.
We’ve been collecting information about the earthquake on our evolving content page. We will continue to keep you informed about what we learn.