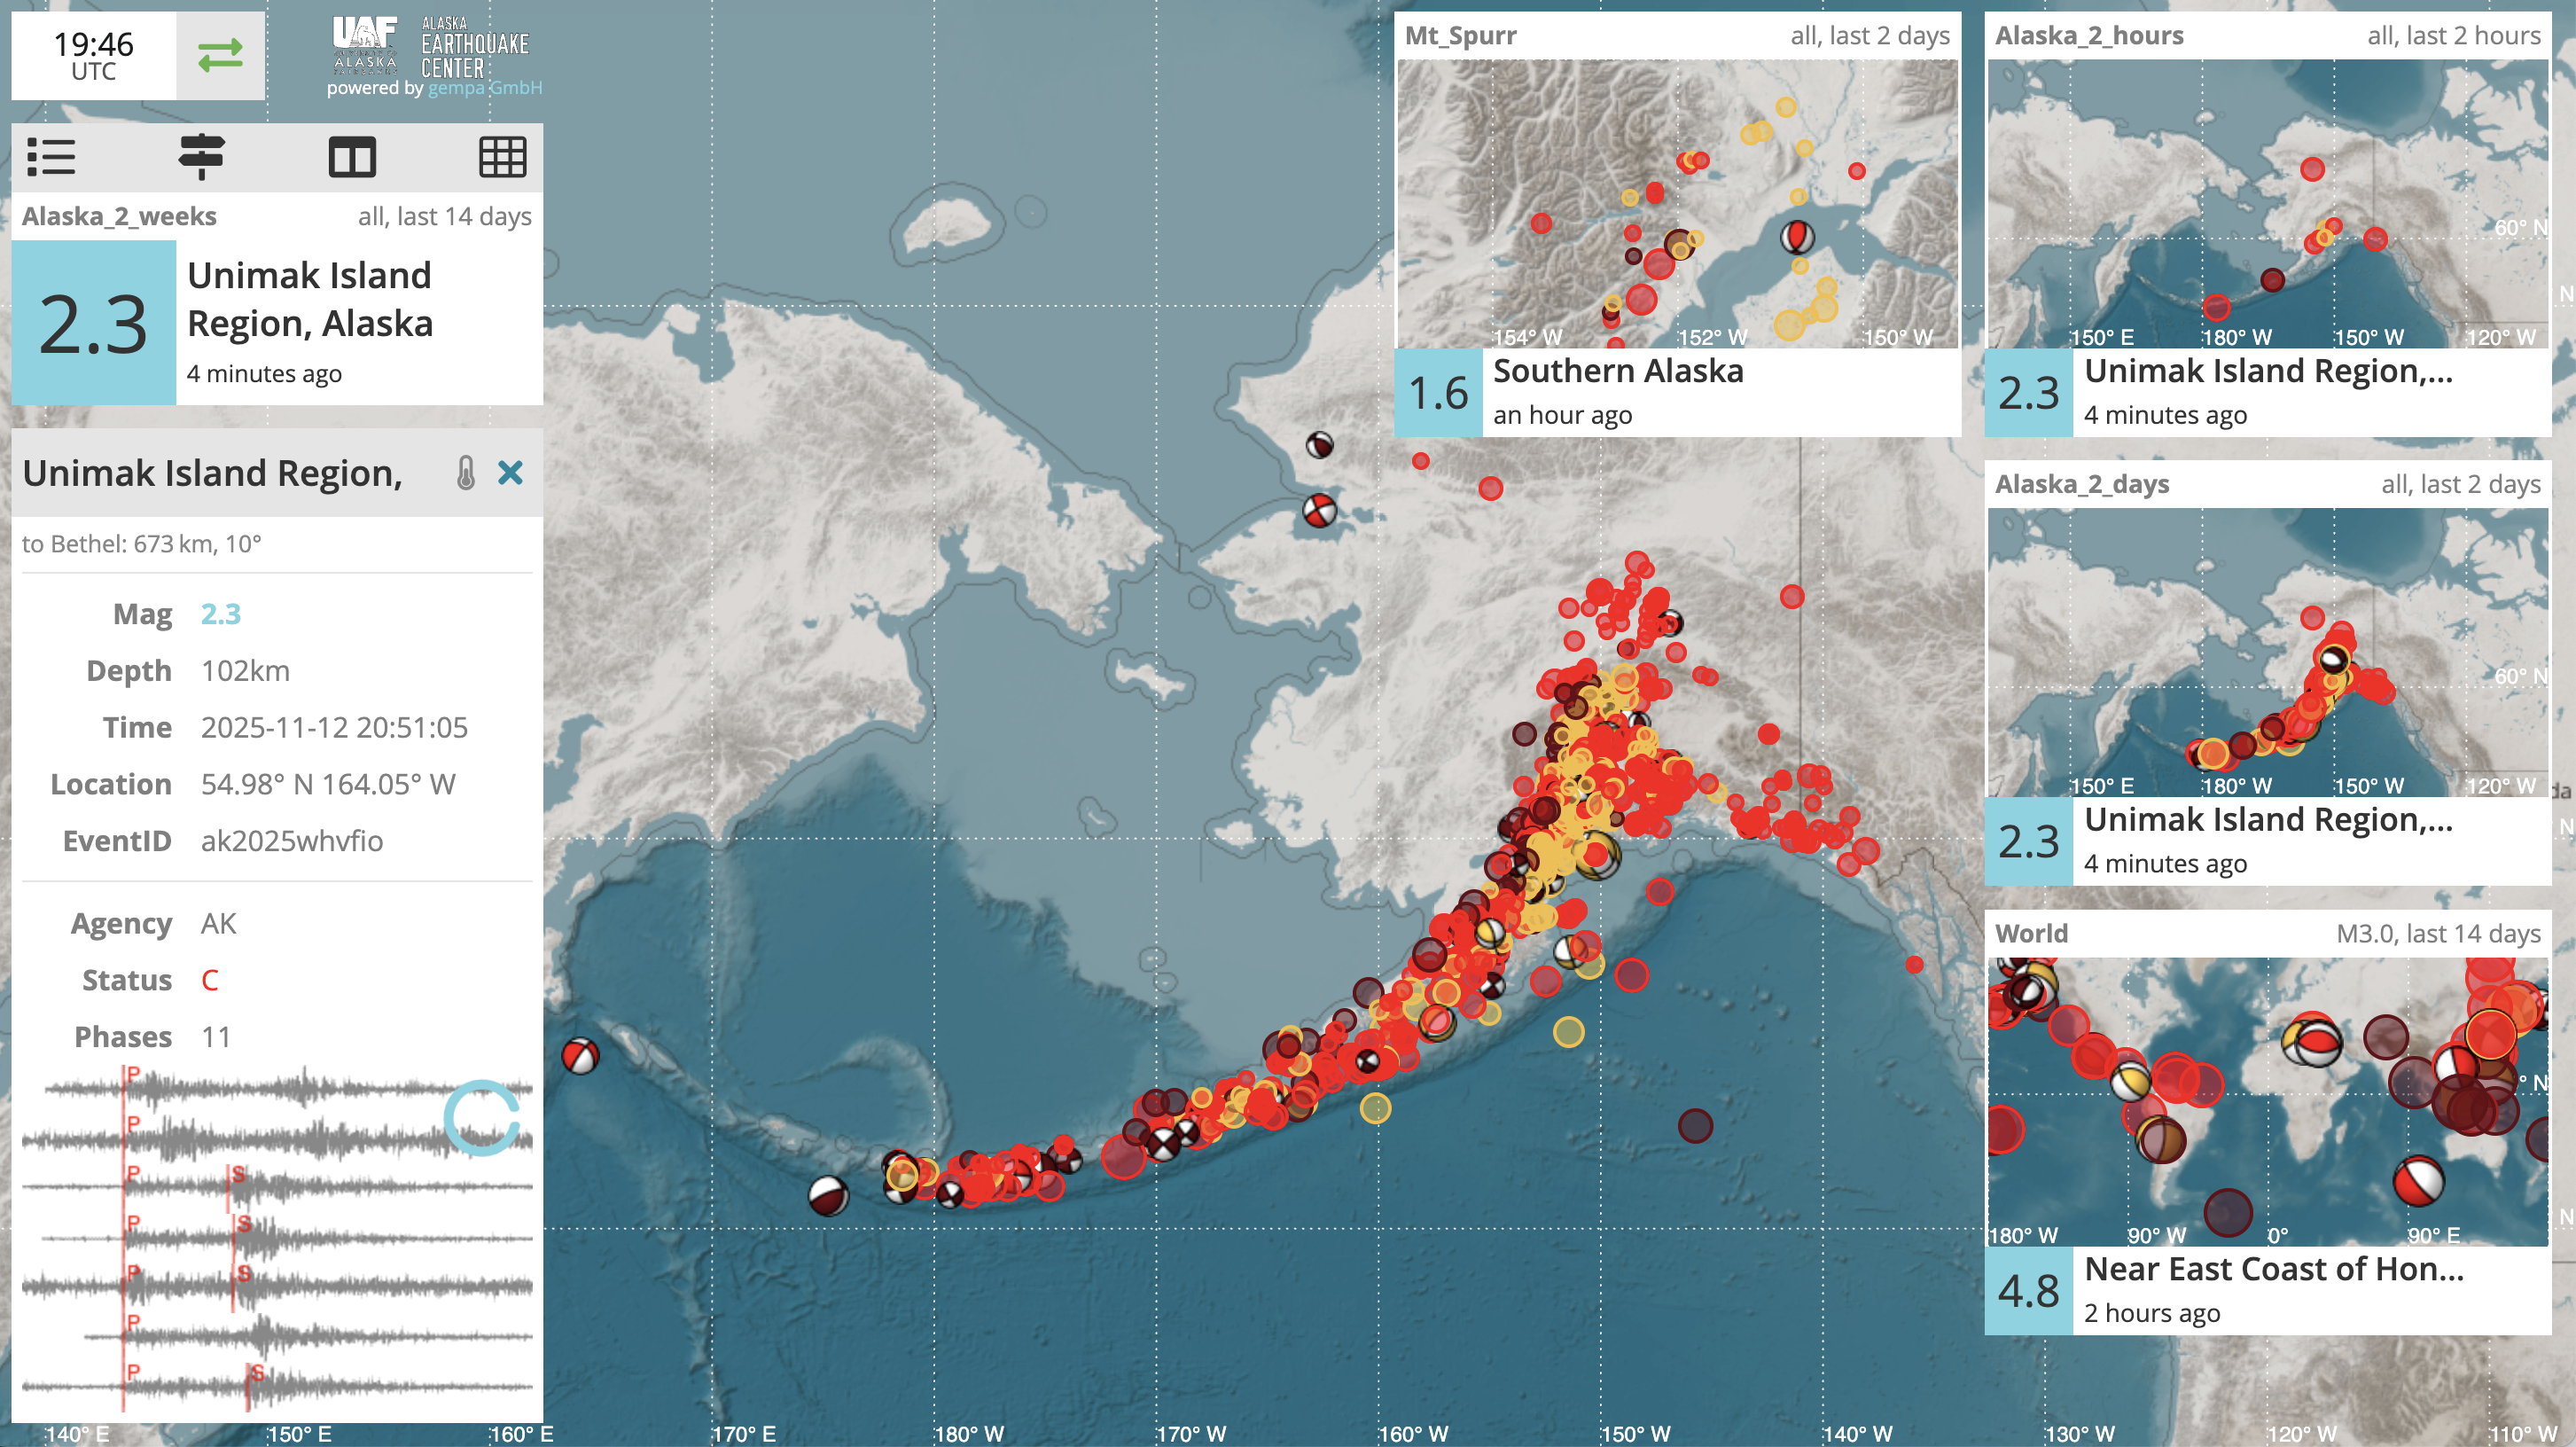
You might not notice as you browse through our interactive map and events list, but the Alaska Earthquake Center has completely rebuilt the engine that drives this information.
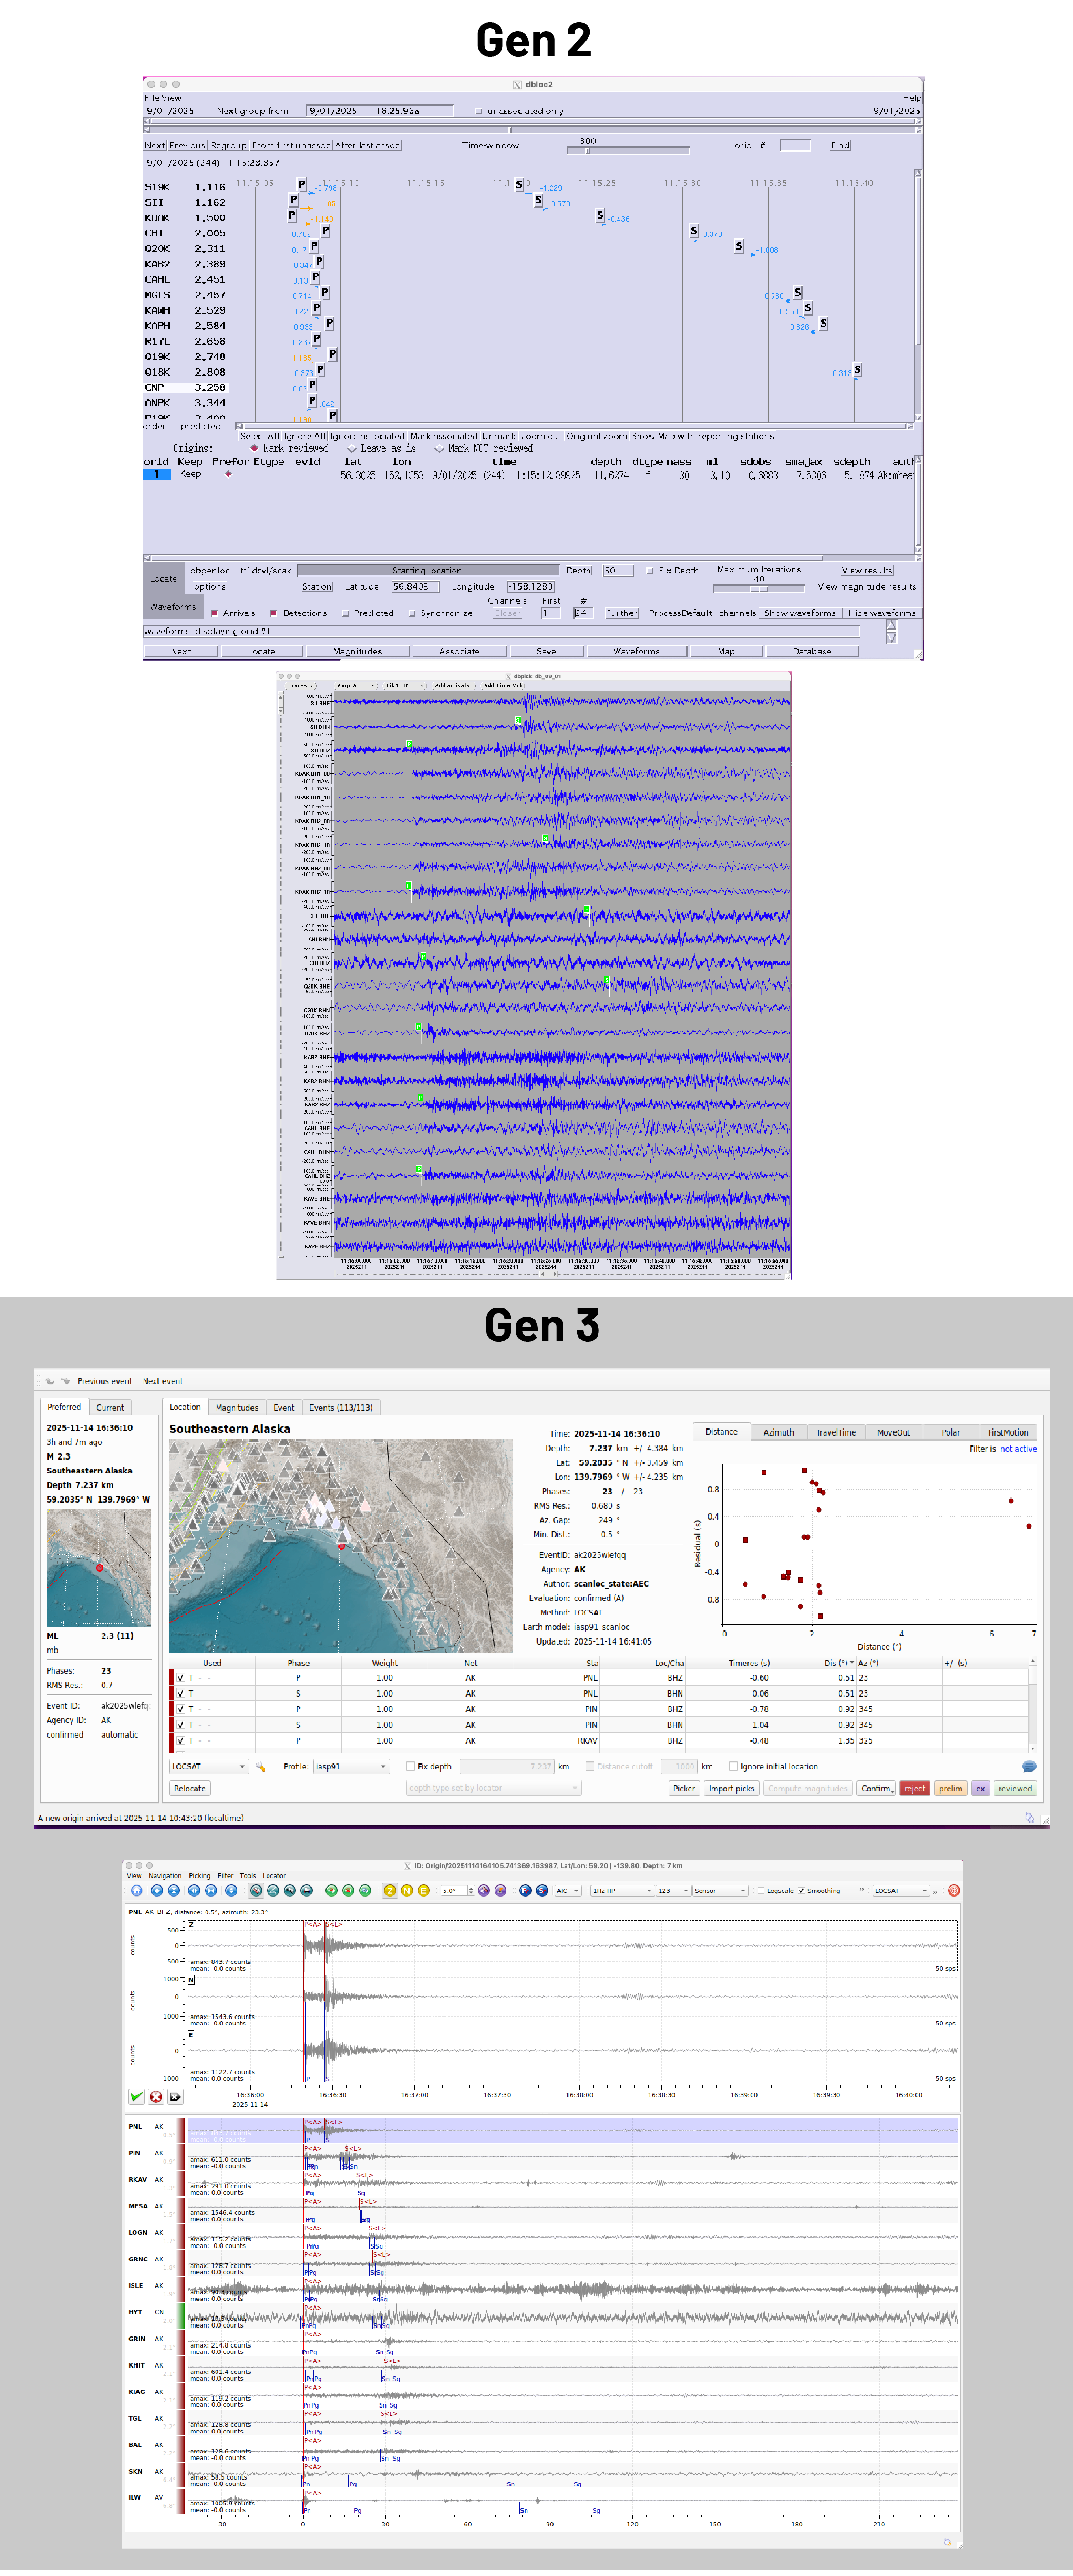
This isn’t the first time that we’ve upgraded our system for analyzing seismic information. In the 1970s, the workflow involved heat-sensitive paper, a dark room, microfilm, rulers, and staff that voluntarily came to the office if there was an earthquake outside of work hours. The leap to digital marked a fairly conspicuous turning point, what we refer to as our “Gen 1” digital seismic toolkit. The first use of dedicated analytical software brought us to “Gen 2” alongside a rapid increase in the number of seismic stations.
In the digital age, with a 250-station network and 24/7 monitoring and response, an overhaul of analytical tools can be challenging to describe. While the changes might not seem obvious as you casually browse the products and information on our website, they are substantial enough that we are branding the new analytical processes “Gen 3.”
Derreck Gossett, a seismic data analyst with the Earthquake Center who was involved throughout the project, calls the transition to a new generation of products “an opportunity to look at how we could improve each step of the process, starting from scratch.”
“I’m excited because it’s a completely modernized interface for analysis, and it affords us the chance to test state-of-the-art technologies,” said Gossett. He adds that the new open-source model allows better collaboration with peer science communities and earthquake centers to develop new tools, for example in landslide detection.
The move to Gen 3
This major, 15-month project replaces the guts of the Earthquake Center. Both our previous and the new systems are designed to collect and process seismic data in real time. The new system makes sharing data—which we do with other seismic networks—and customizing workflows easier. It is also set up to readily integrate new capabilities, such as those that support earthquake early warning.
Research seismologist Ezgi Karasözen, who coordinated many of the transition efforts, said the biggest challenge was Alaska’s “huge range of seismic activity spread over a vast area. Tuning a real-time system to handle that is difficult.” Another challenge was figuring out what to carry forward from the previous system, and what to rebuild for Alaska’s unique seismic environment. “On top of that, we set ourselves an ambitious timeline and had to juggle a lot of moving parts at once, but in a good, exciting way,” says Karasözen.
What to expect
It’s possible that Alaska’s next big earthquake will bring surprises, and the Earthquake Center may encounter some hiccups in the early days of the new system. We are equipped to troubleshoot on the fly.
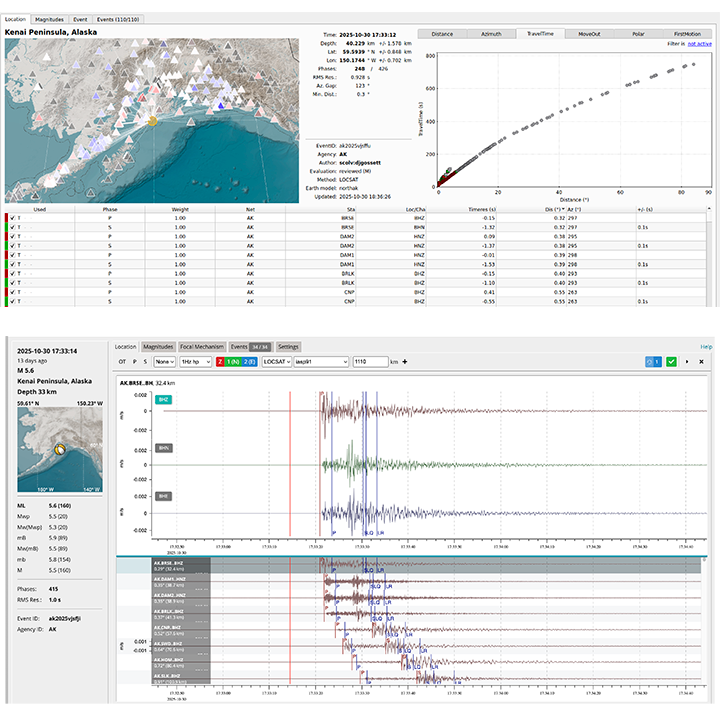
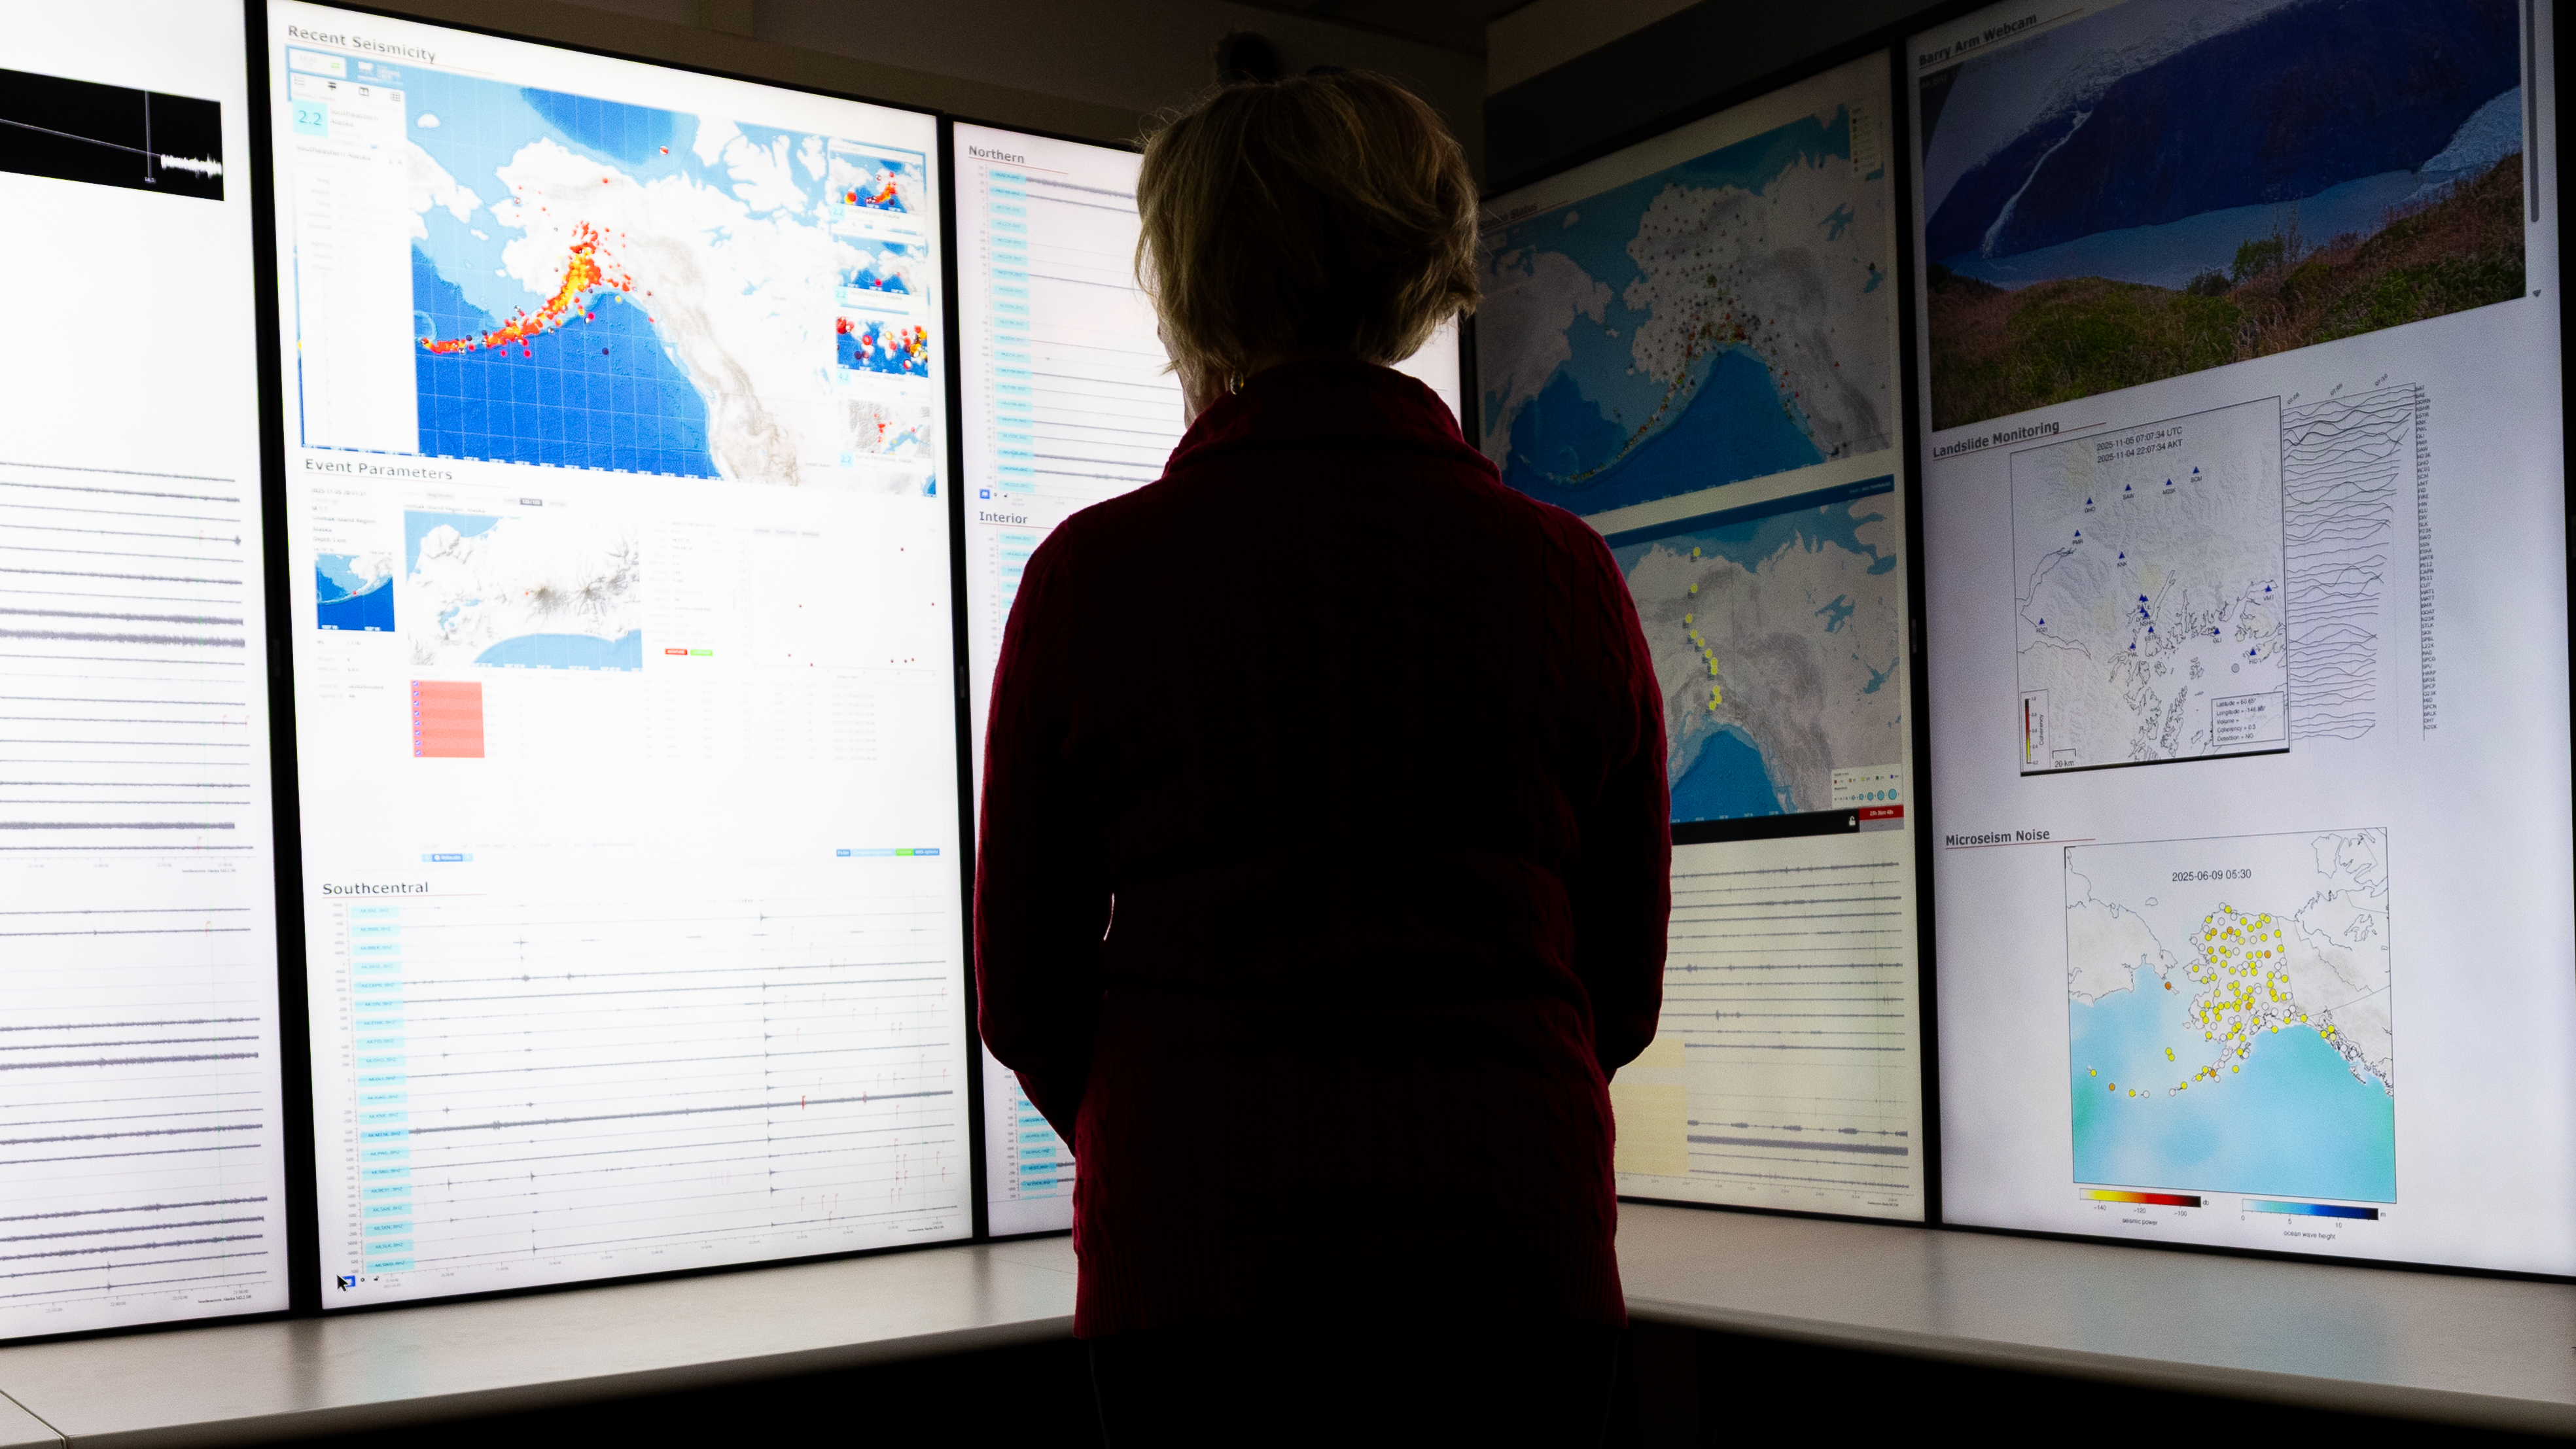
You’ll notice a new look to maps and graphs that support our science stories (Figure 2), for example in our October 2025 coverage of a widely felt earthquake in the Kenai Peninsula. If you come visit us in Fairbanks, at the Geophysical Institute, we can show off our new command center (Figure 3). Most importantly, we are now poised atop a stronger foundation to rapidly assess and share seismic information, and we look forward to sharing the new capabilities as we implement them in the future.