On July 22, 2020, a major M7.8 earthquake struck the Shumagin Islands region of the Aleutians, just south of Simeonof Island.
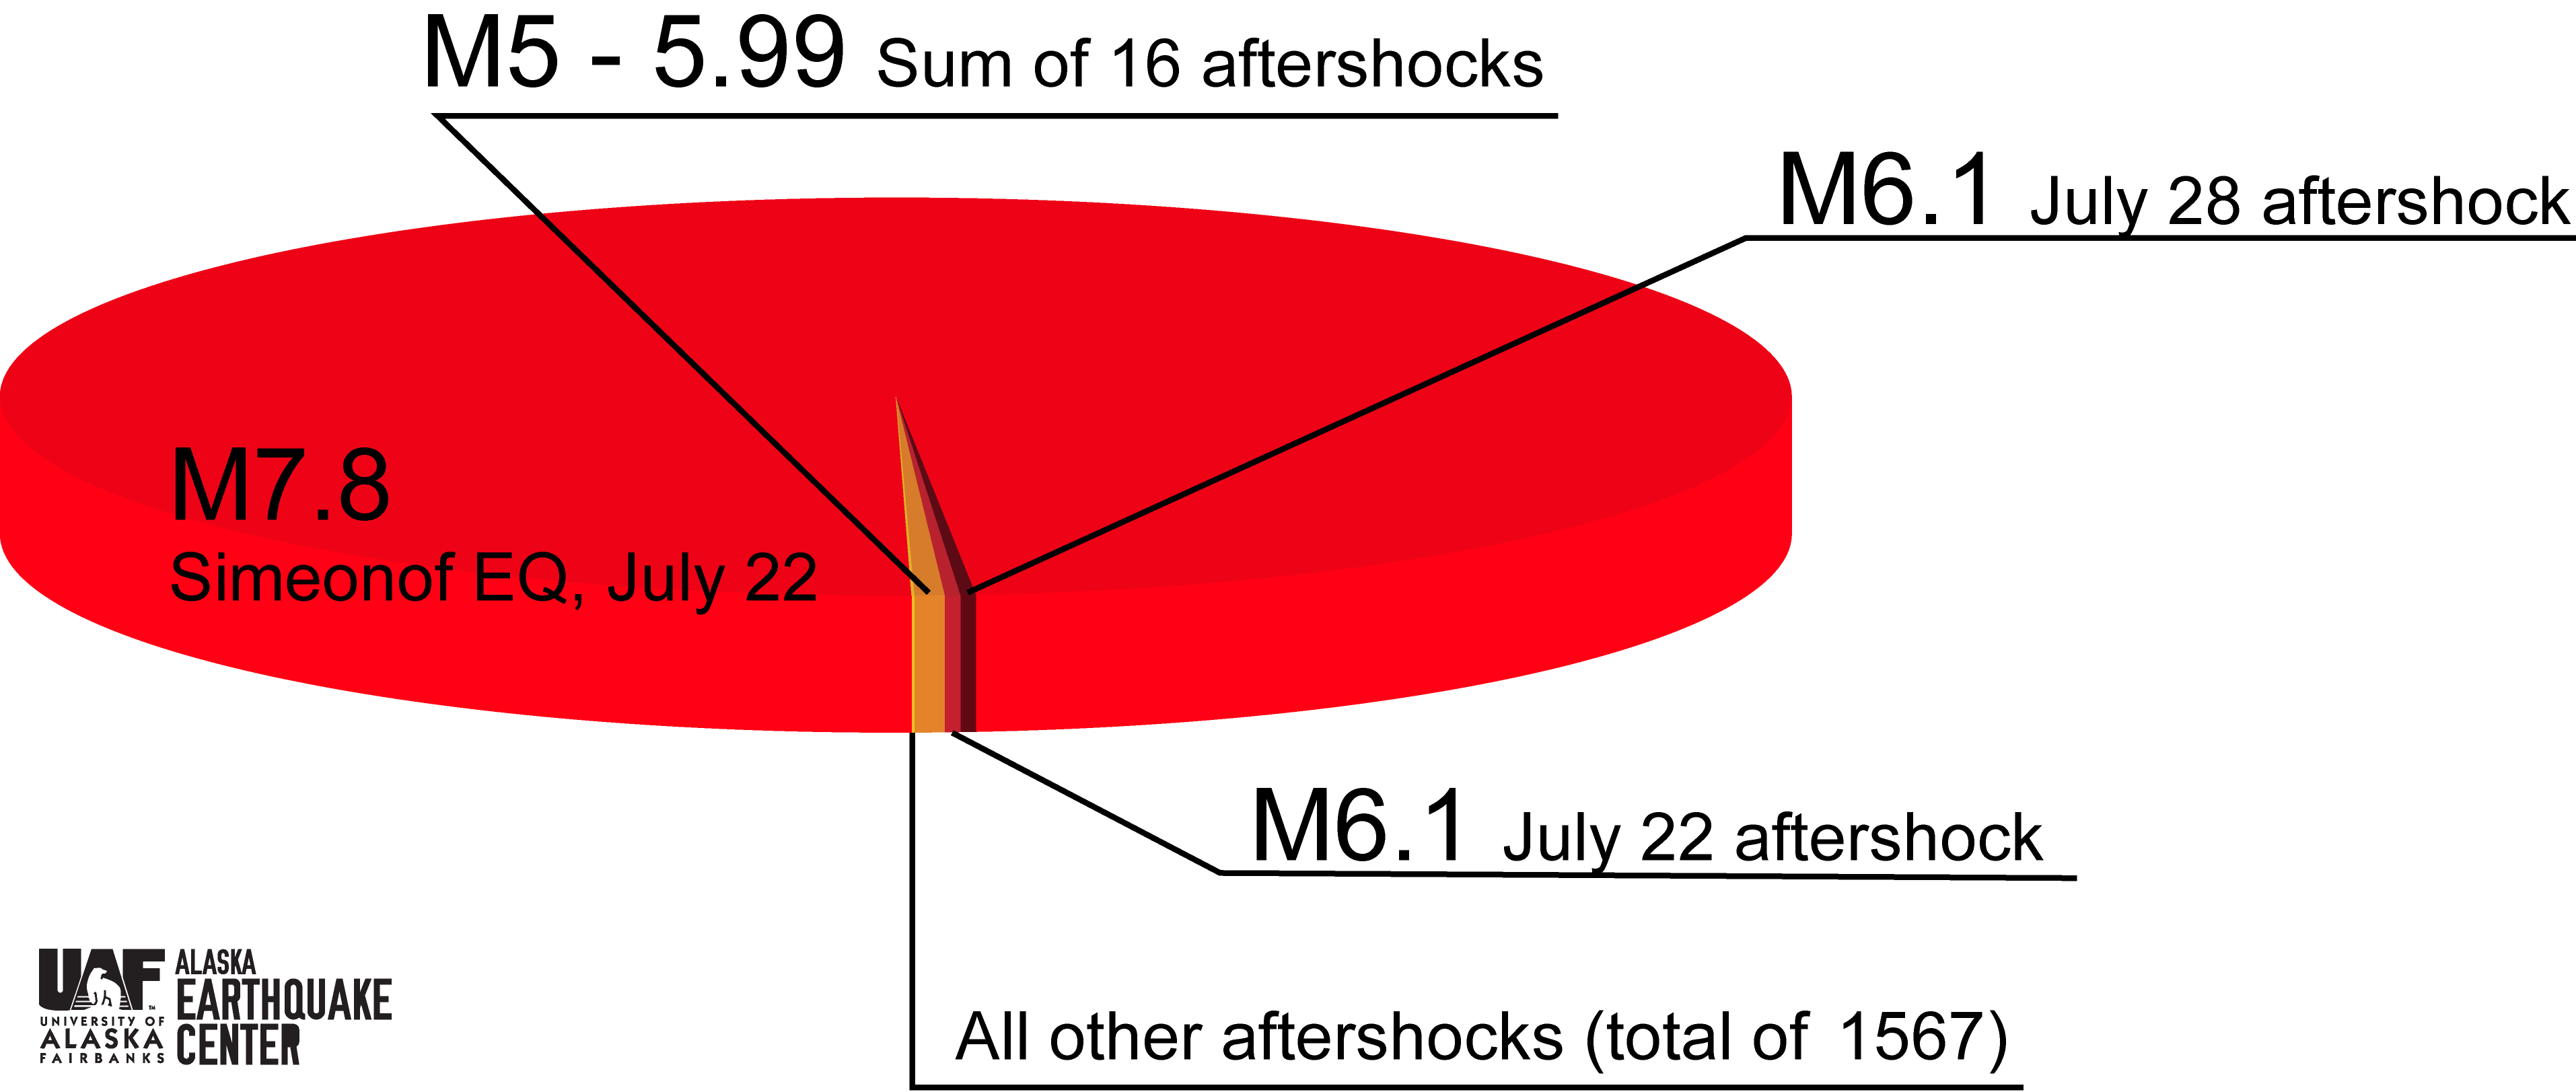
The pie chart here shows the energy comparisons between the Simeonof mainshock, the two M6.1 aftershocks, the energy for all 16 aftershocks between M5 and M5.9, and the energy for all other aftershocks. Energy increases by a factor of 32 with each magnitude unit. Here you can see that the mainshock carries a significantly larger share of energy. Even though large magnitude aftershocks can sometimes feel just as intense, they do not actually release nearly the same amount of energy.
These aftershocks from the Simeonof Earthquake are quite interesting, scientifically, because of where they are occurring, in the “Shumagin Gap,” and also because of how few there have been when compared to other subduction zone mainshock-aftershock sequences.. Up until August 18, just under a full month following the mainshock, there have been 1,587 aftershocks located by Earthquake Center analysts. But if you look back to the November 30, 2018, M7.1 Anchorage Earthquake and its aftershocks, within the first month there were over 6,000! Ten percent of the total energy released during the first month of the Anchorage mainshock-aftershock sequence was attributed to the aftershocks. As you can see in the pie chart here, the story is very different with the Simenonof mainshock-aftershock sequence. This Simeonof sequence is “underproducing,” and scientists are excited to figure out why. For more information on the aftershock forecasts for the Simeonof earthquake, visit the USGS event page.
