


2025 Tracy Arm Landslide
Initial information
On August 10, 2025 at 5:36 a.m. AKDT, a massive landslide occurred near South Sawyer Glacier in Tracy Arm fjord in Southeast Alaska. The Earthquake Center received reports from people out boating of a local tsunami in the Endicott Arm area, with waves of 10–15 ft near Harbor Island (see map). The National Park Service reported a wave of at least 100 ft at Sawyer Island, with vegetation stripped from the slopes. There was no earthquake detected in the area. The region is outside of the Earthquake Center’s recently expanded landslide detection coverage, so there was no automatic detection. We applied our landslide characterization algorithm on the data from Southeast Alaska seismic station. Our initial estimate placed the source near South Sawyer Glacier, with a very large volume, possibly larger than 100 million cubic meters.
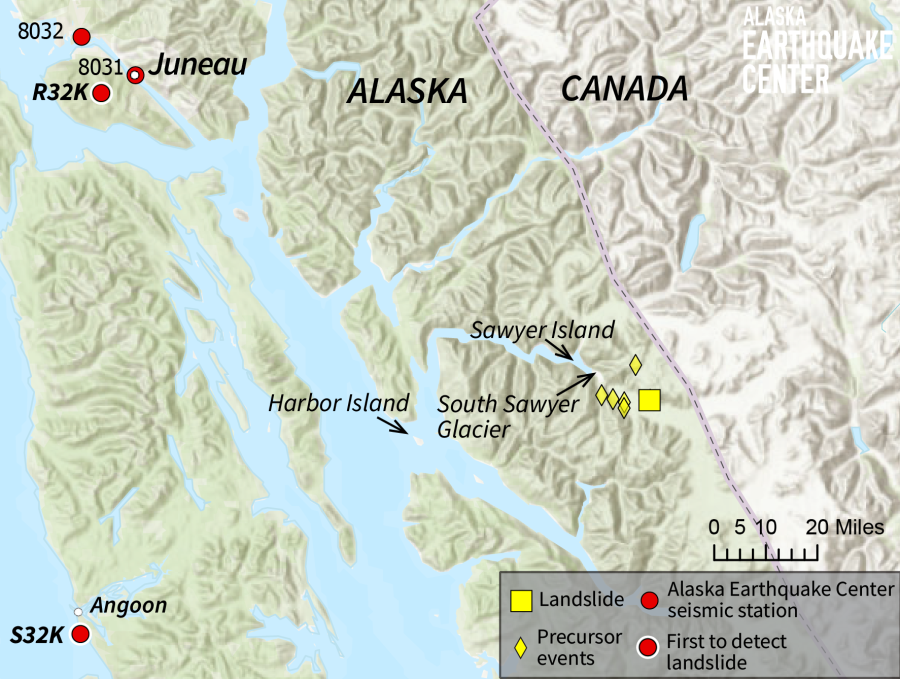
Map of the landslide location and the precursory events detected in the seismic record so far. The red circles show the Earthquake Center’s seismic stations in the region. Station S32K near Angoon and R32K near Juneau were the first to detect the landslide. They are both about the same distance from the landslide. Harbor Island is where several kayakers lost their gear to the tsunami. Sawyer Island is where reports indicate a tsunami of 100 feet scraped trees off the rocky slopes.
A guided look at the features in the first video, taken by the US Coast Guard, of the area hit by the tsunami in Tracy Arm.
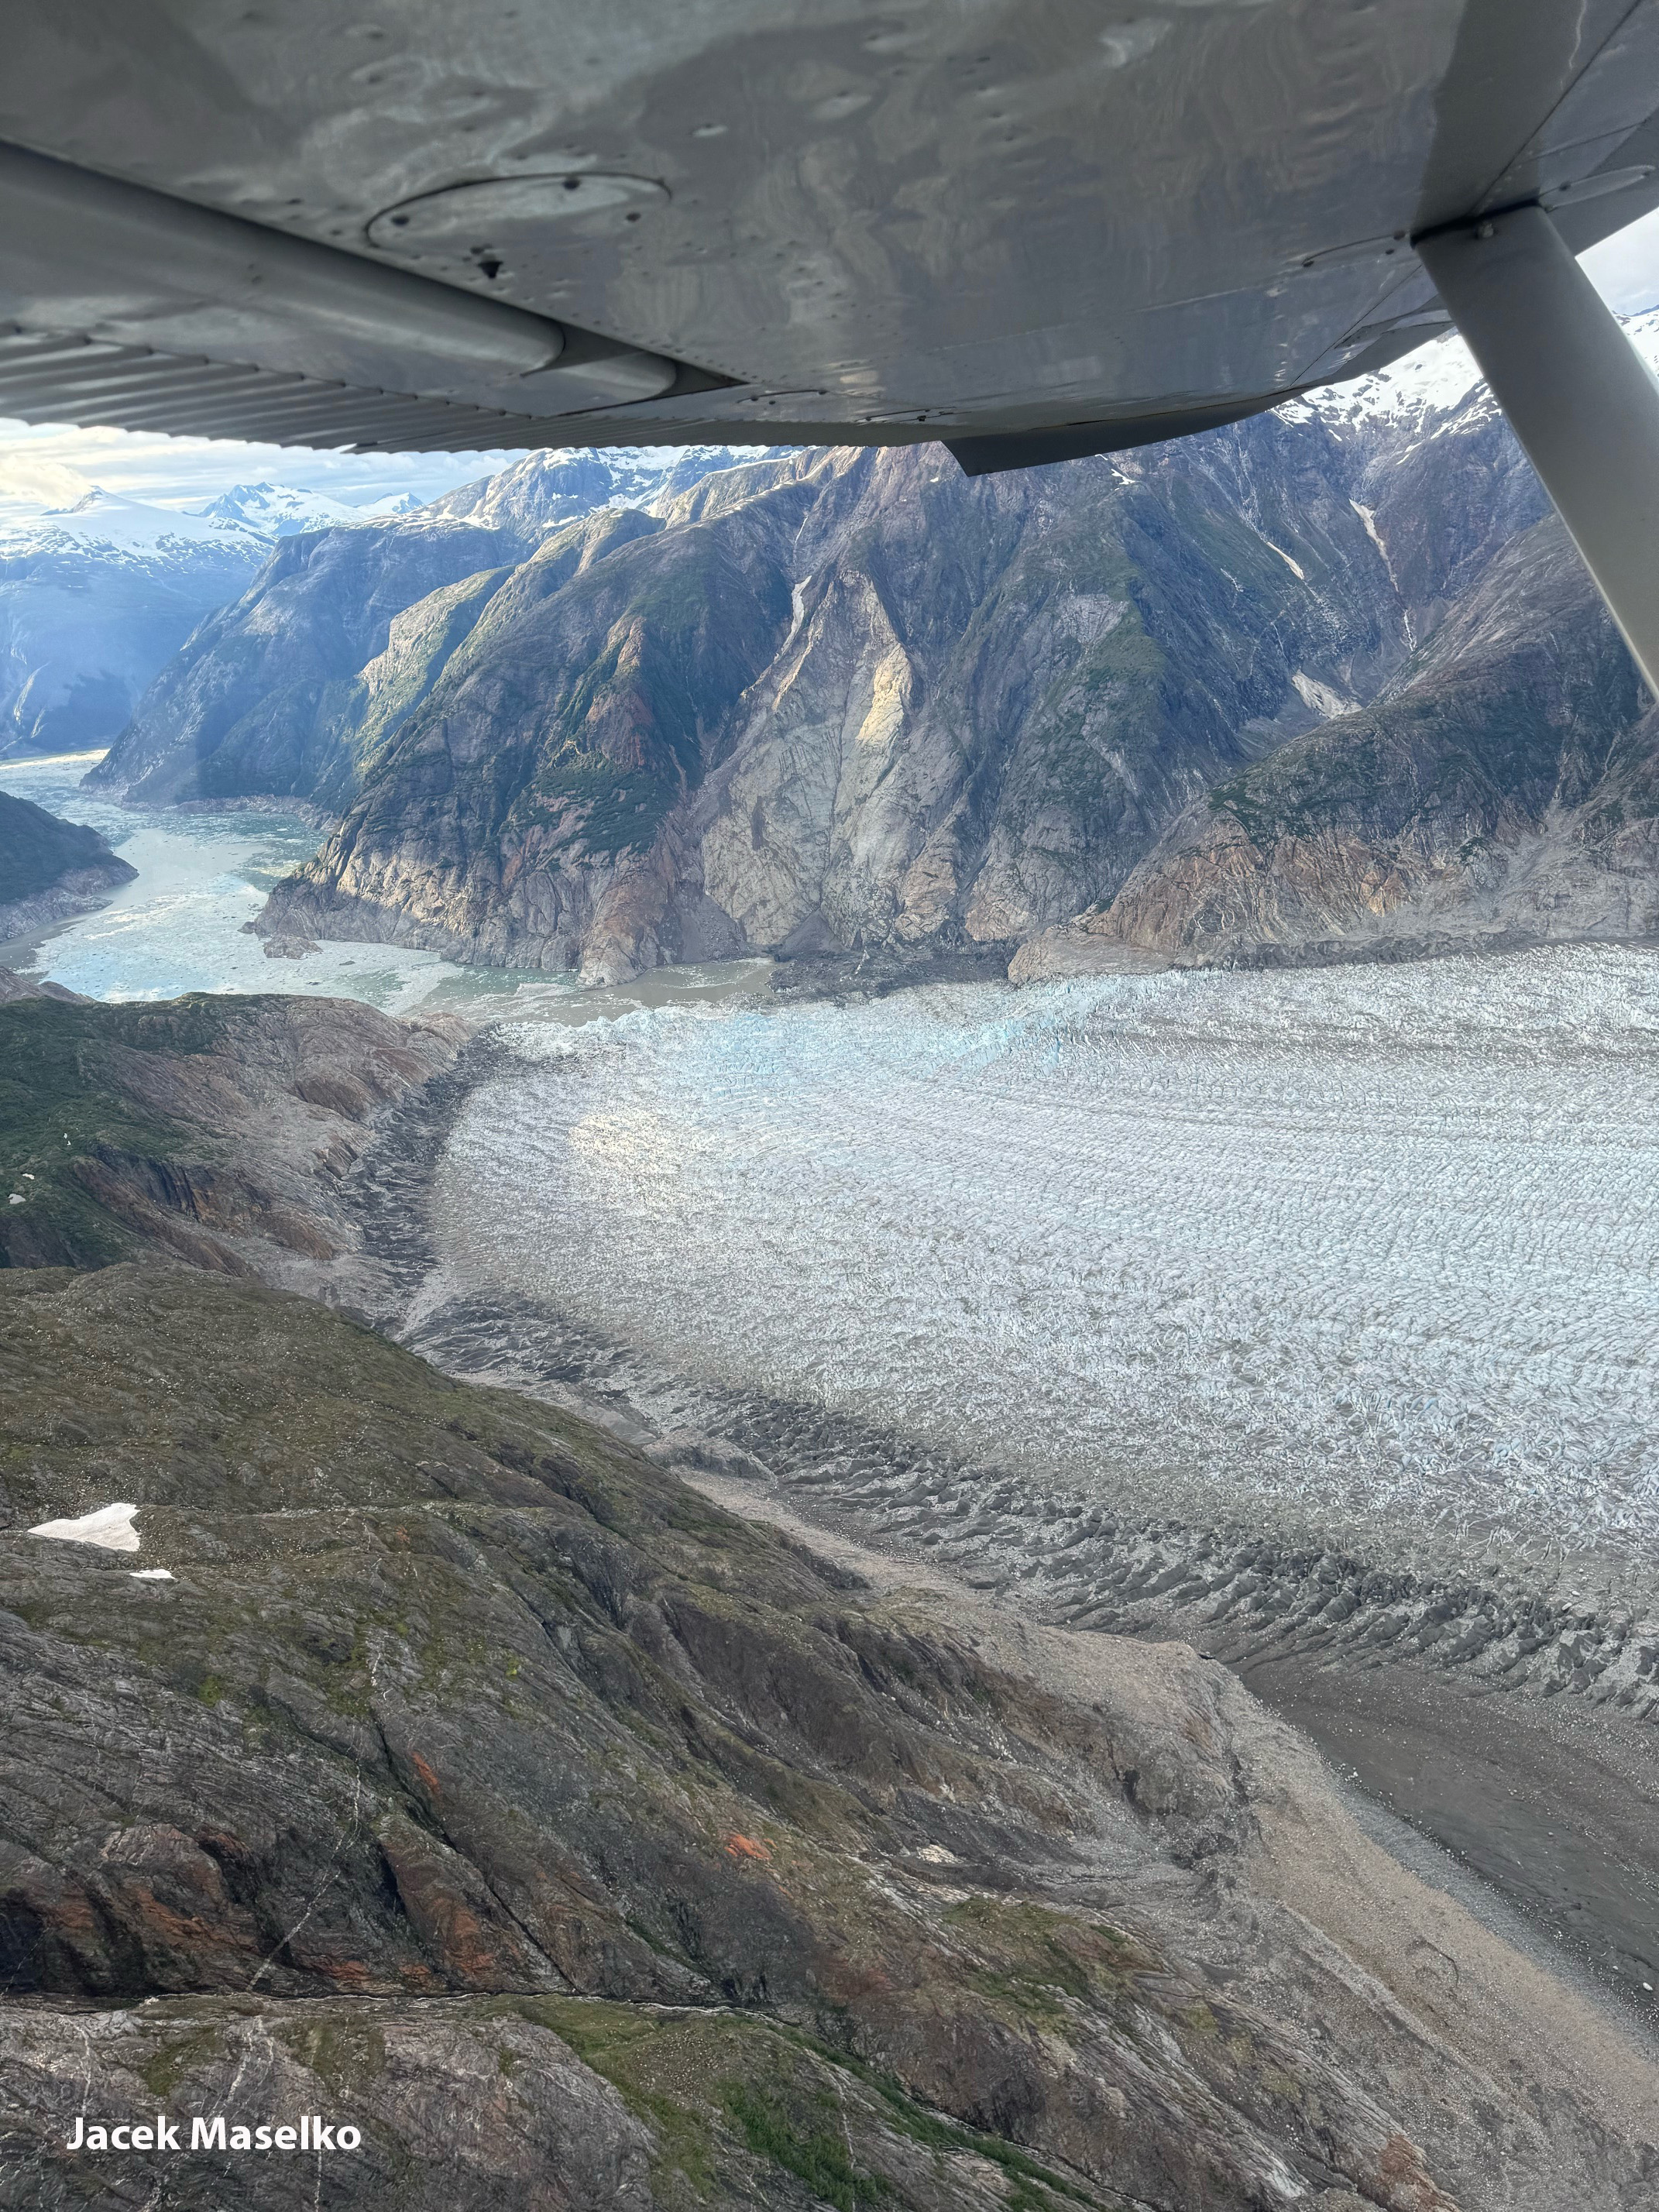
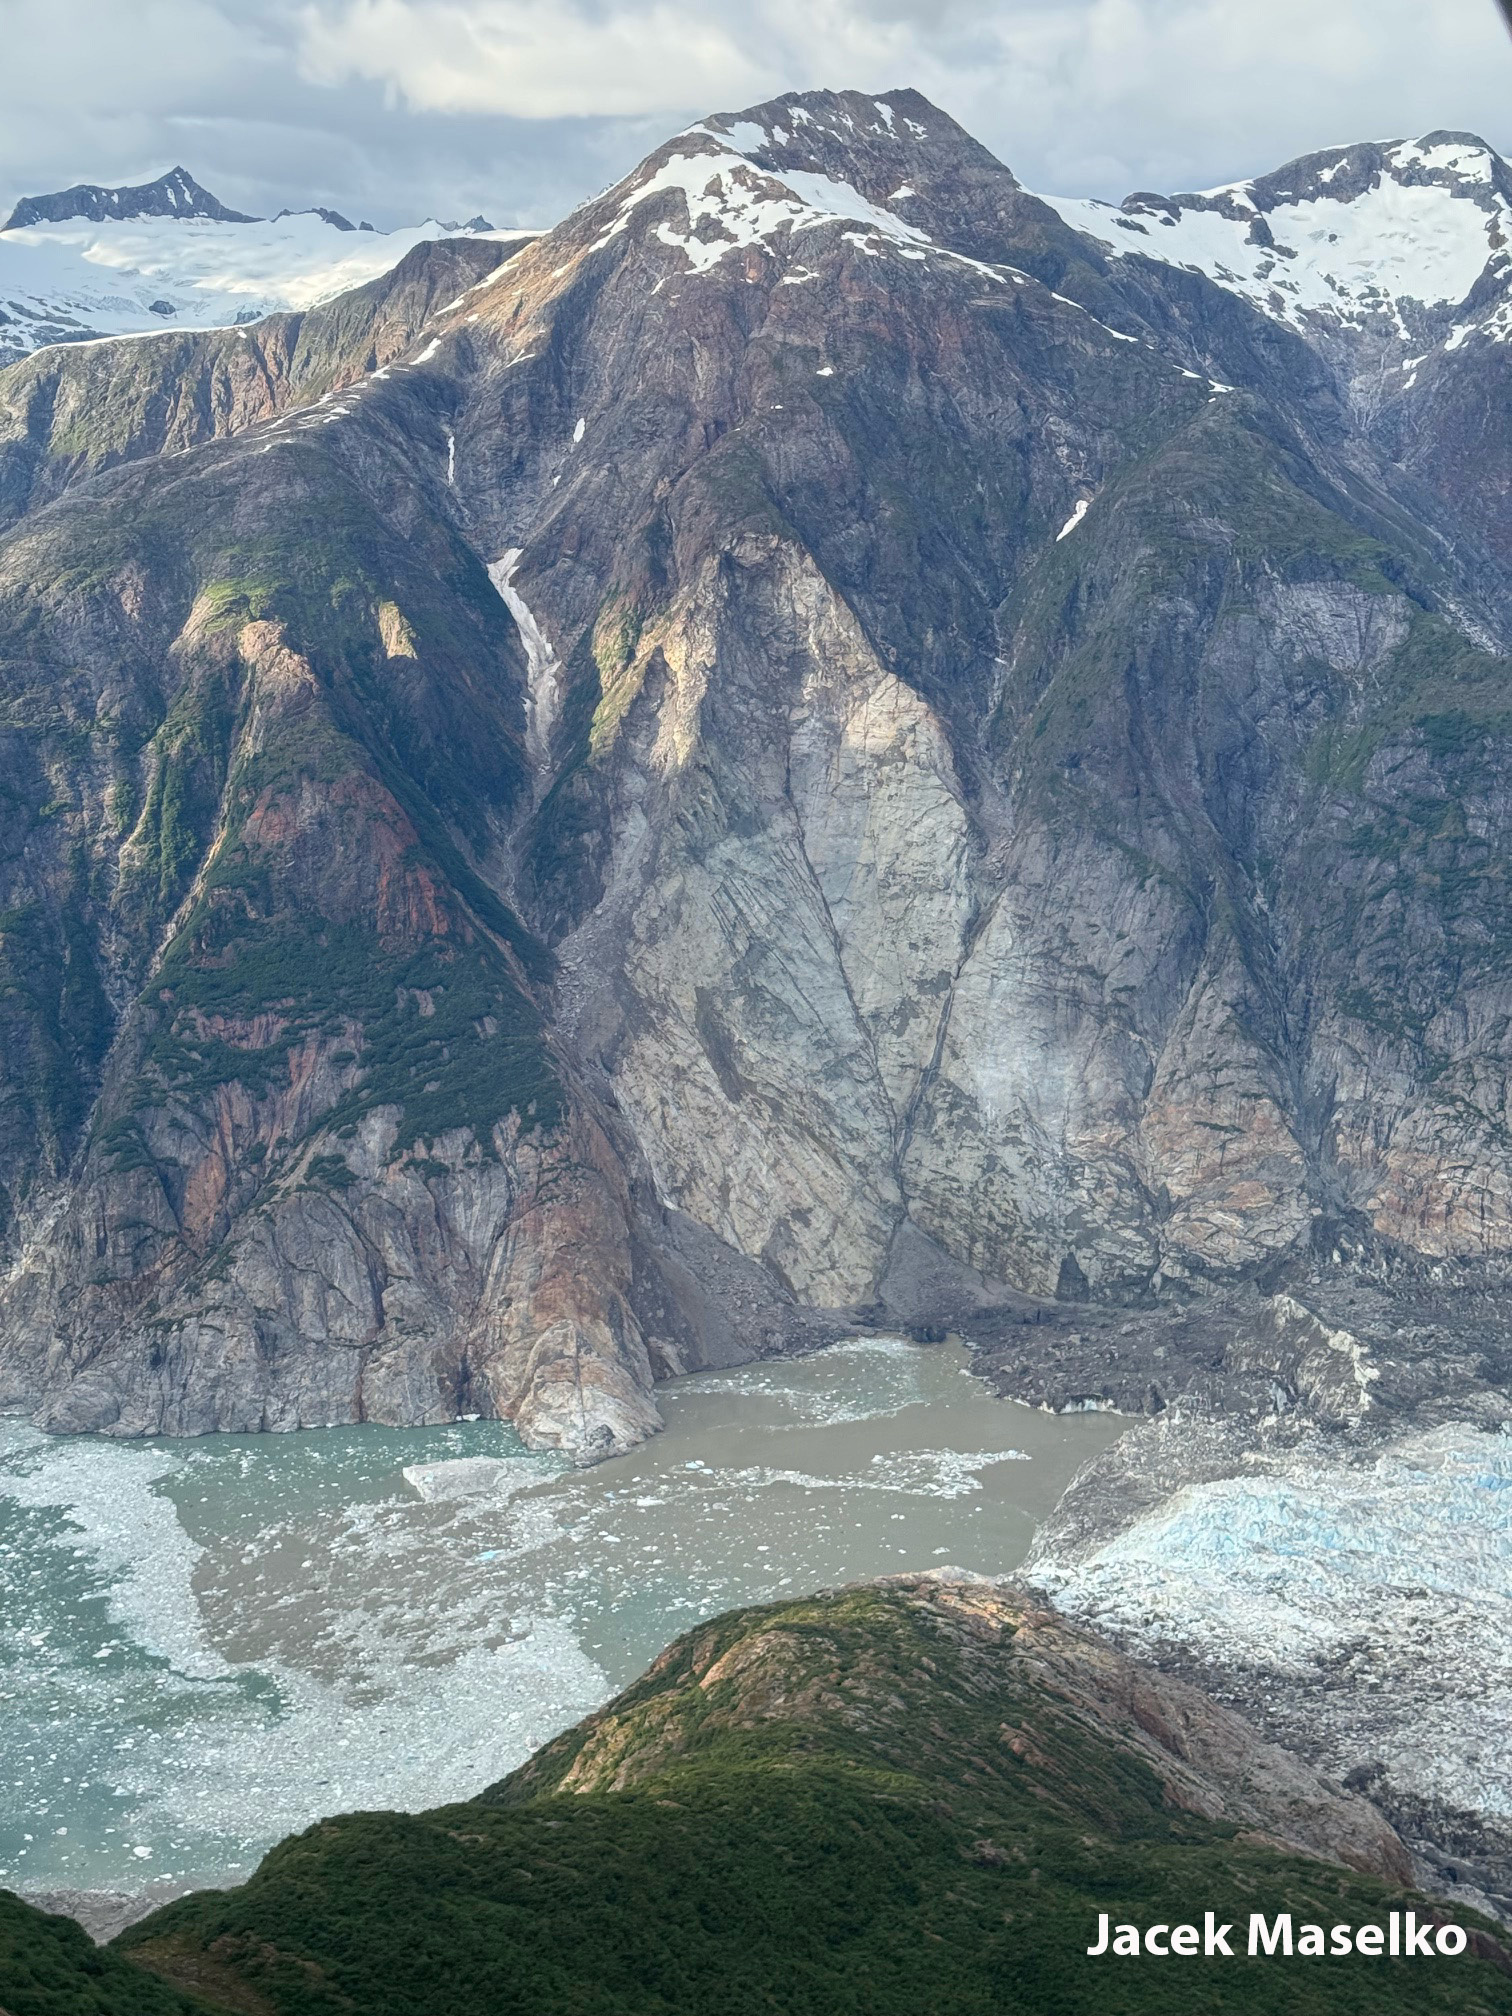
The photos below from August 12, 2025, two days after the August 10 landslide, reveal the scale of this massive failure at the South Sawyer glacier terminus. Taken from a plane at about ~3,500 ft (1,070 m), the light-colored bedrock scar is strikingly visible. The flying elevation makes clear that the failure was a few thousand feet high. Dark landslide debris blankets parts of the glacier terminus, while another portion, along with slide material, entered the water.
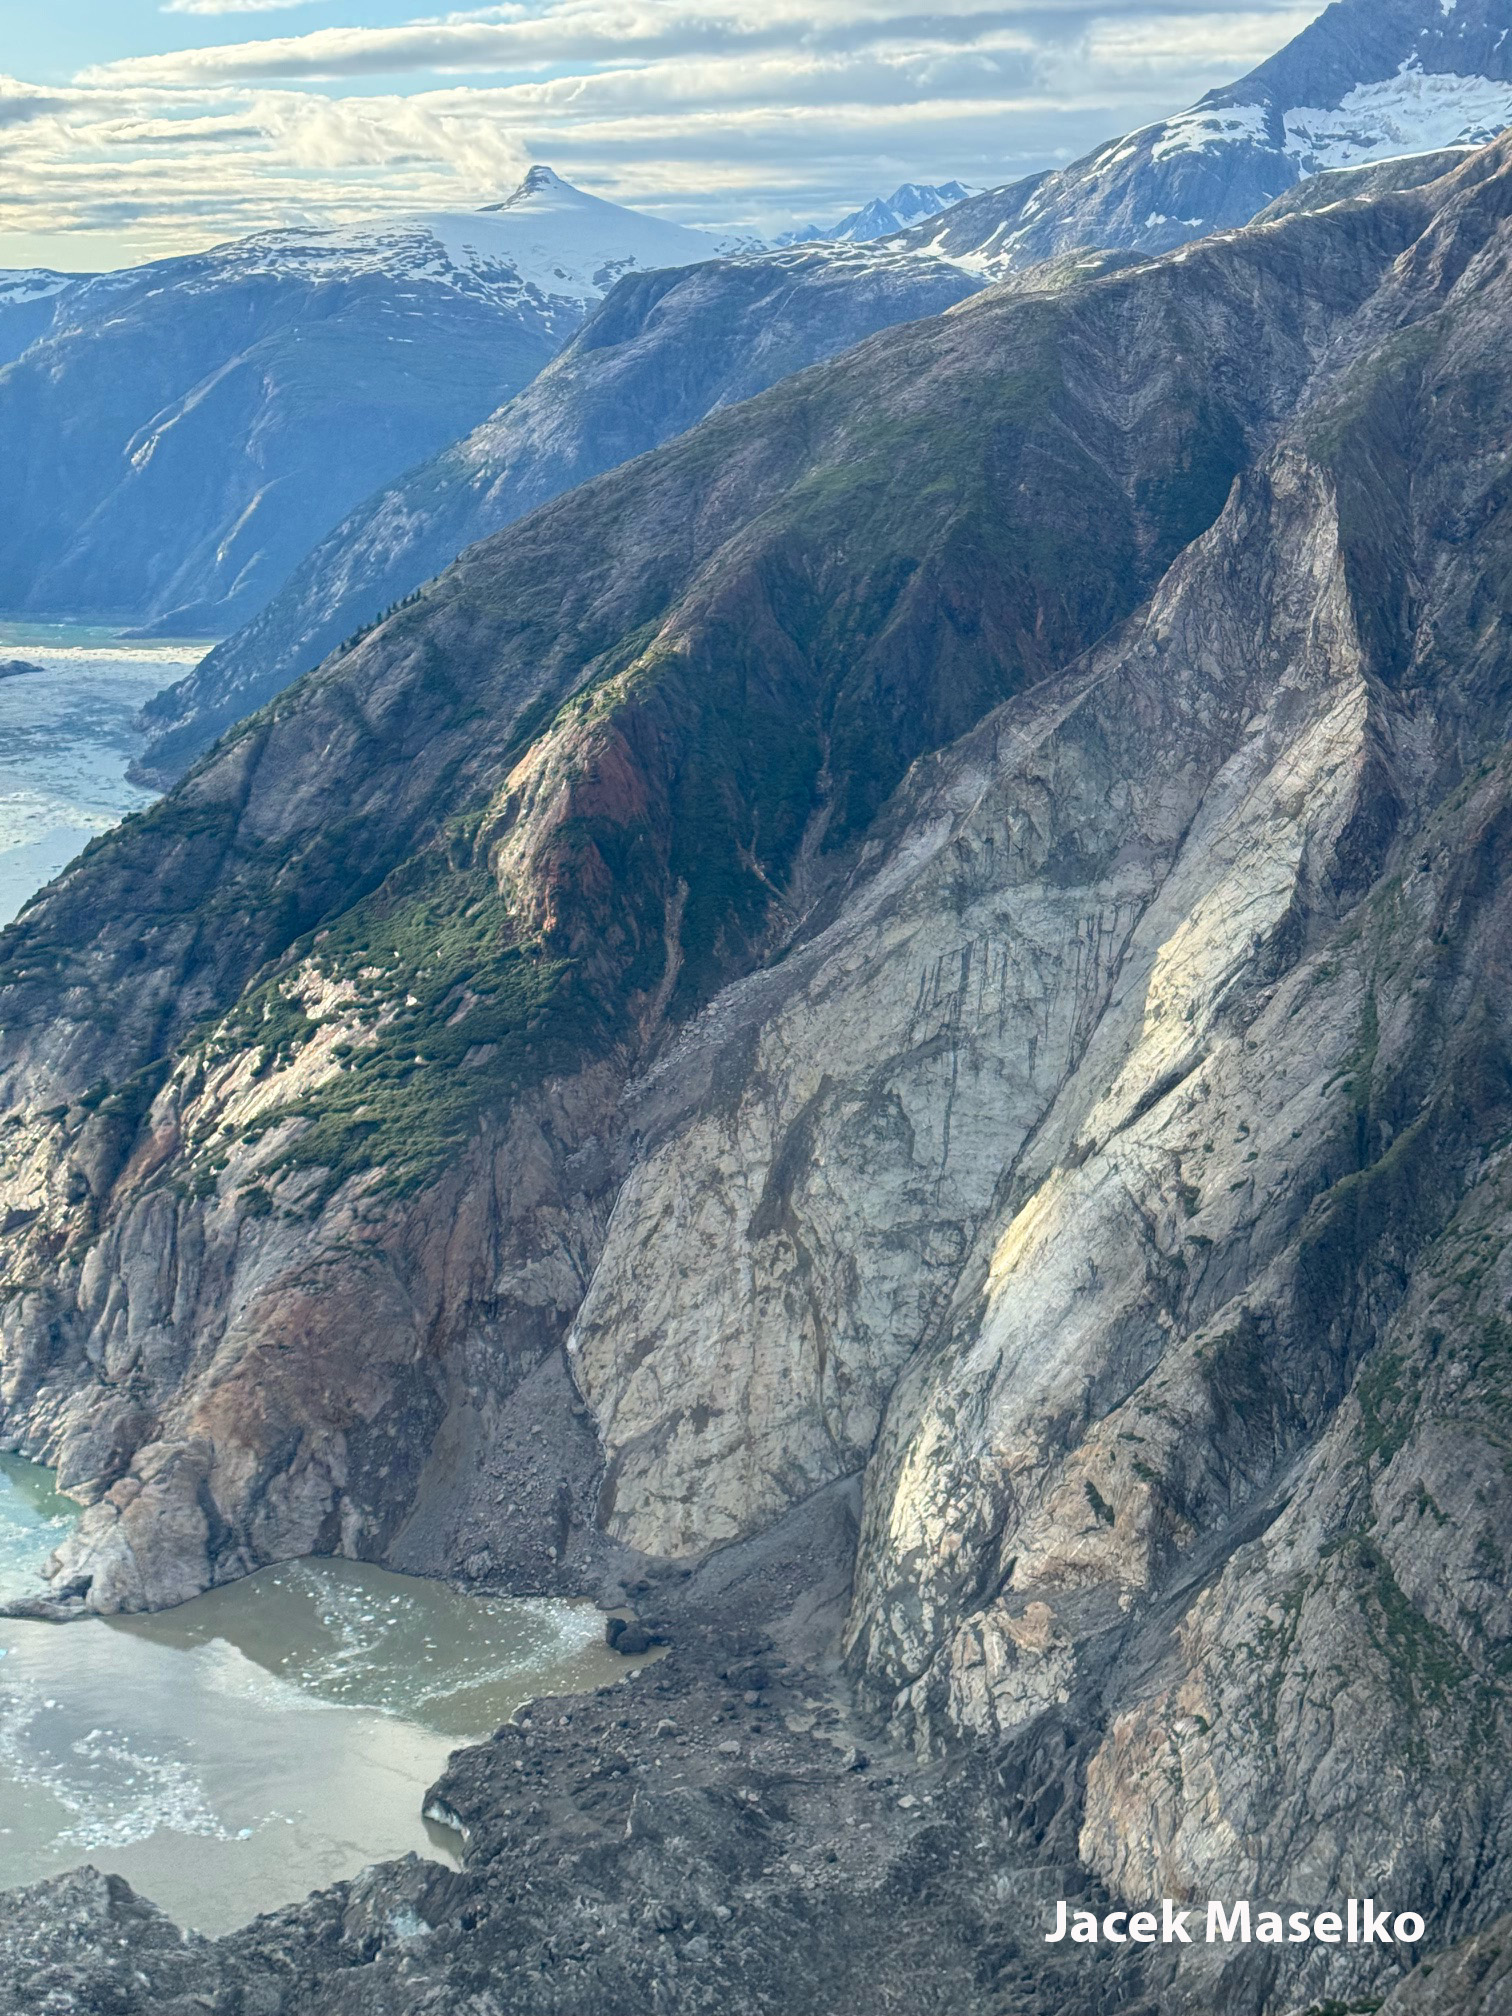
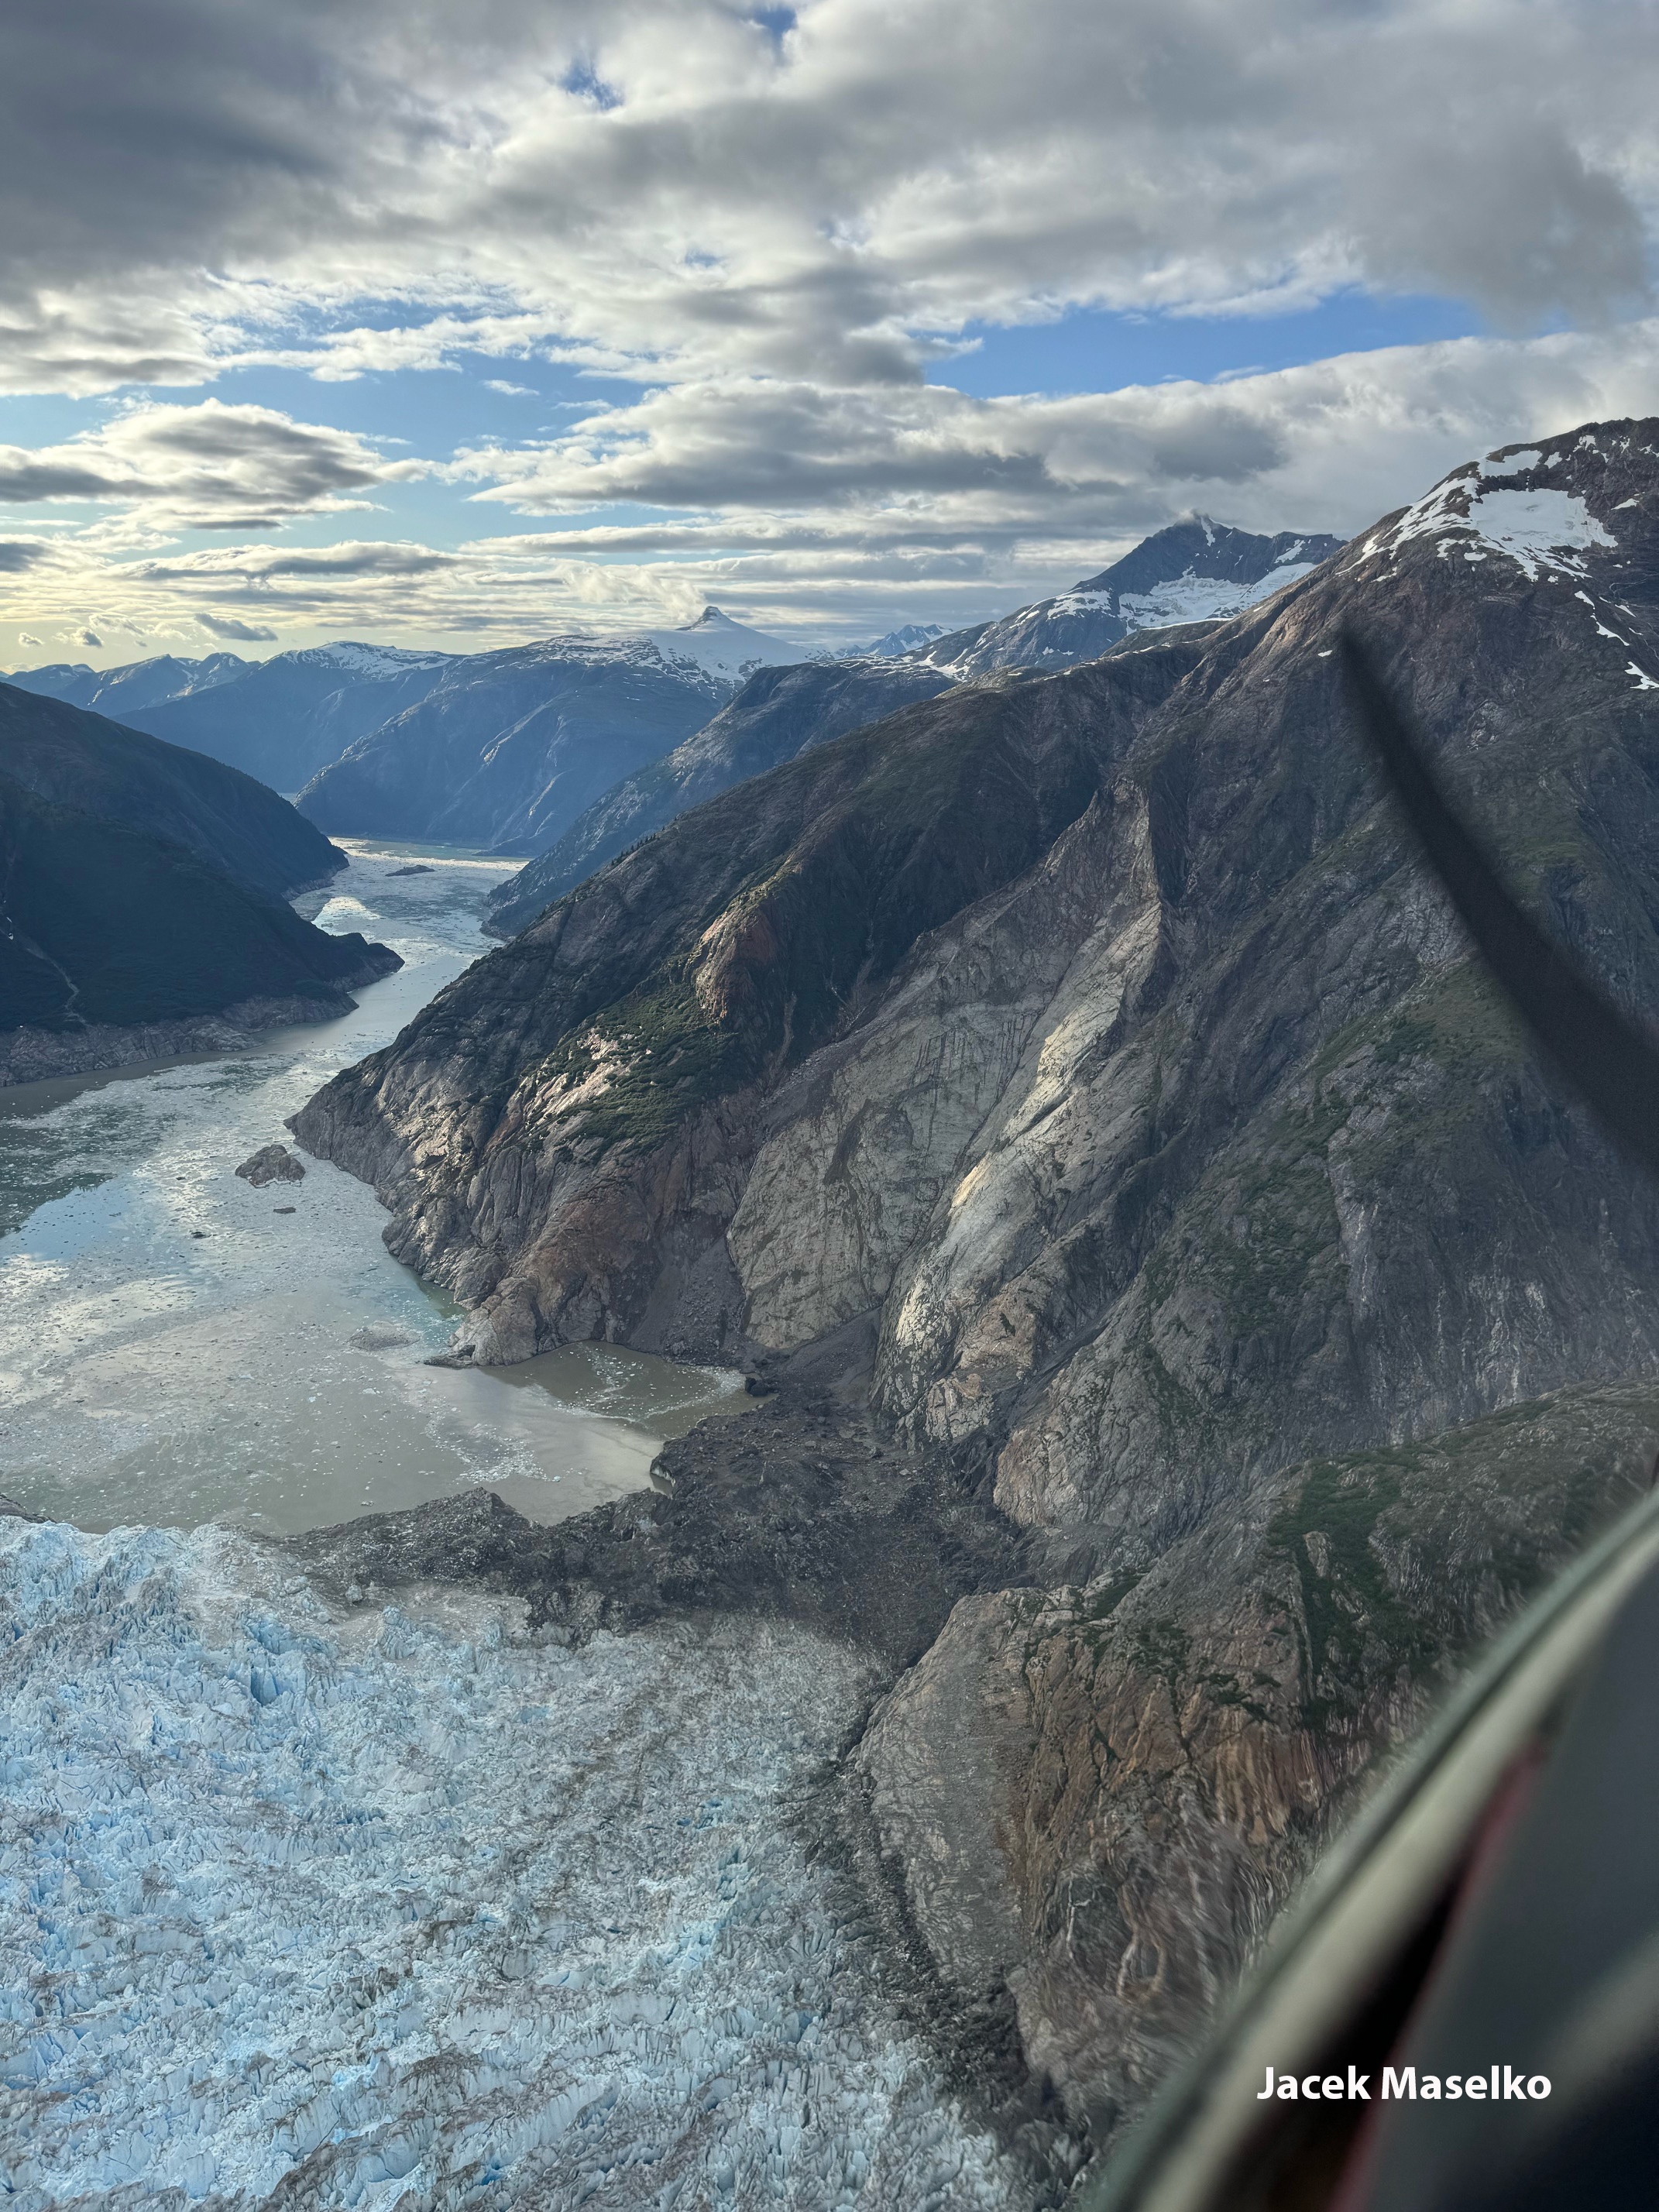
The two photos below clearly show the landslide scar location at the foot of the glacier, with part of the landslide debris spread across the top of the glacier.
Seismic Data
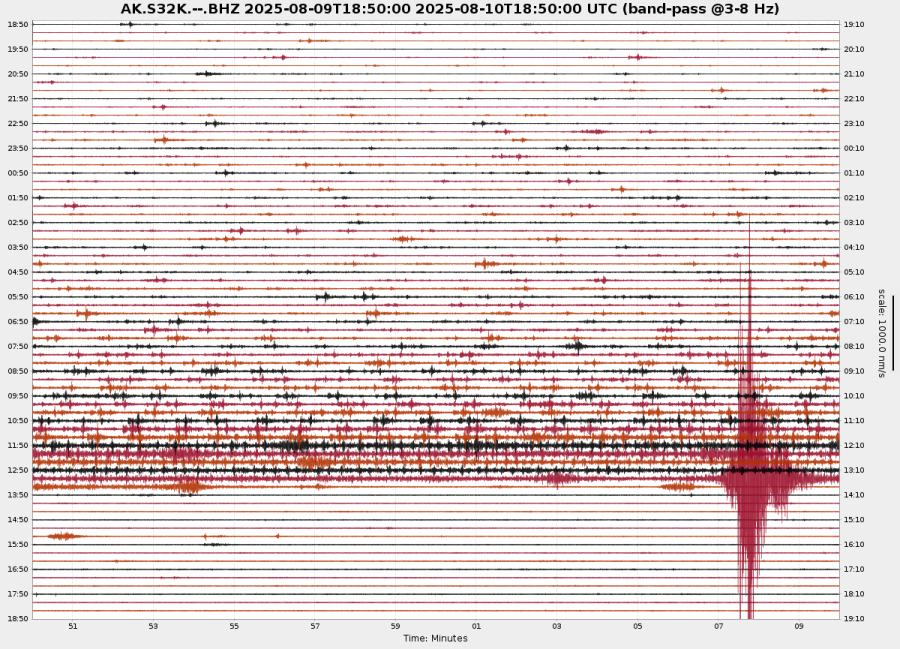
The large landslide clearly shows in the seismic record at the bottom right. Prior to the landslide, the smaller, precursory events increase in number leading up to the major landslide. Seismic data from Earthquake Center station S32K. Figure produced using EarthScope Data Management Center tools.
In this video, listen to a "sonified" version of the precursory quakes and major landslide in Tracy Arm.
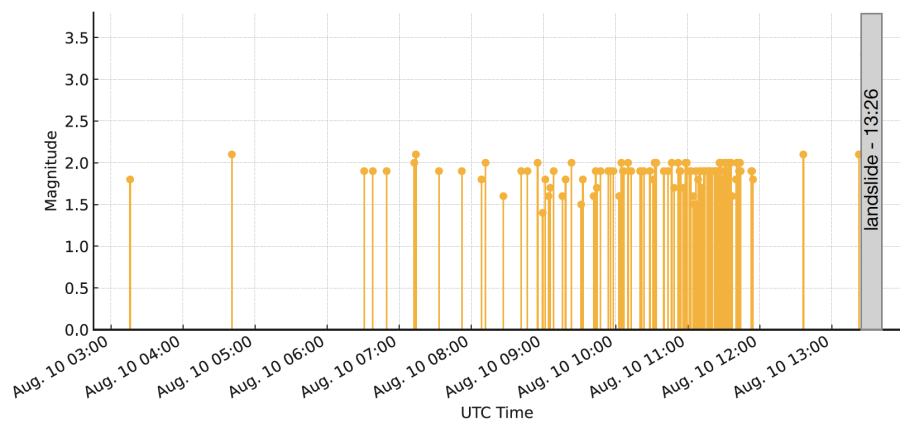
Precursor seismic events that have been incorporated into the Earthquake Center’s seismic catalog as of August 12. These events are highly repeating and all locate in the same area as the landslide.
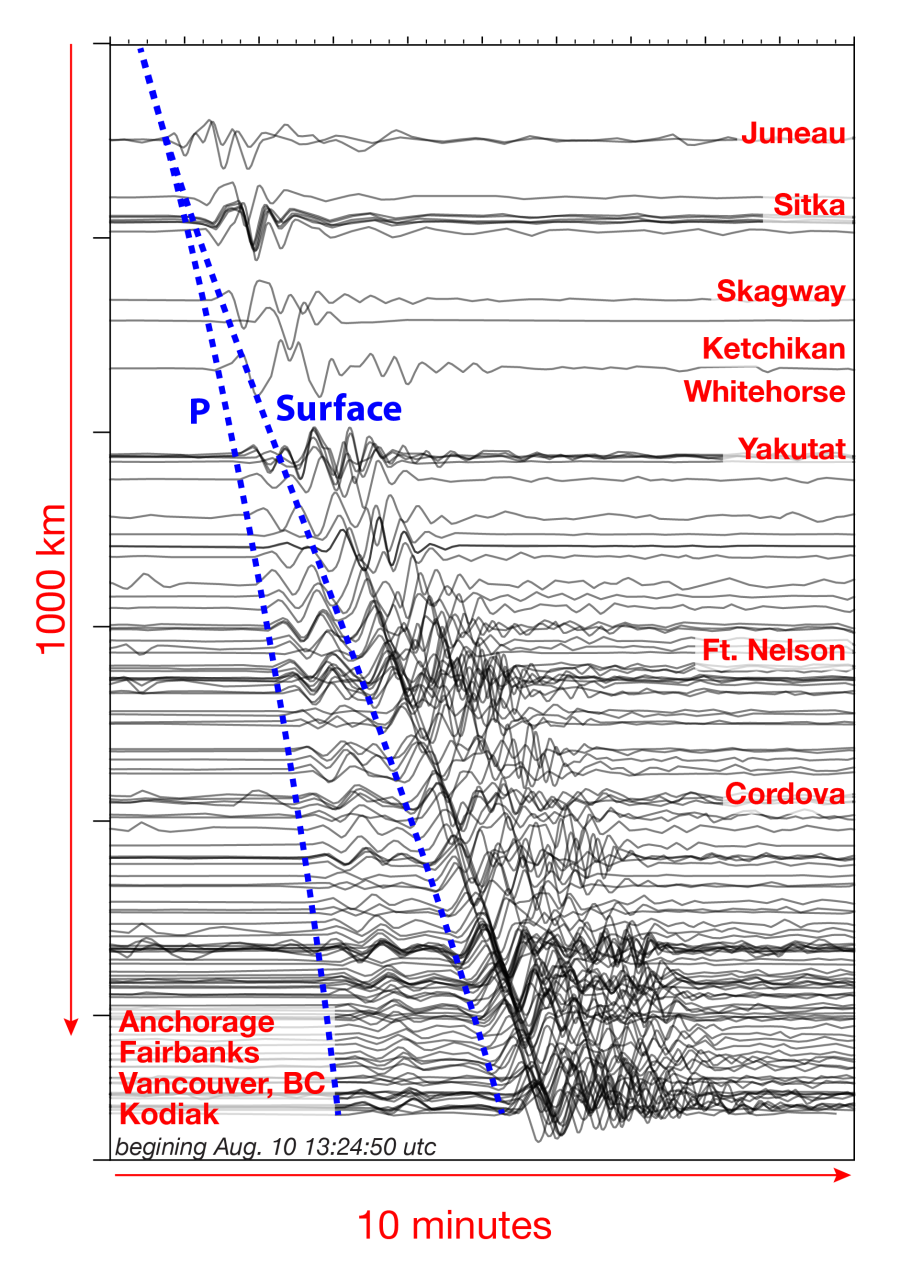
Seismic records within a thousand kilometers of the Tracy Fiord landslide. Close stations record the signal first. At further distances the seismic waves arrive later and are more protracted in time. The amplitude of this seismic signal hundreds of kilometers away can be used to estimate the volume of the landslide. Initial estimates based on these seismic data suggest a volume of 30-250 million cubic meters.
**Technical details: Plot shows vertical component broadband seismograms that have been trace normalized and bandpass filtered on 20-100s.
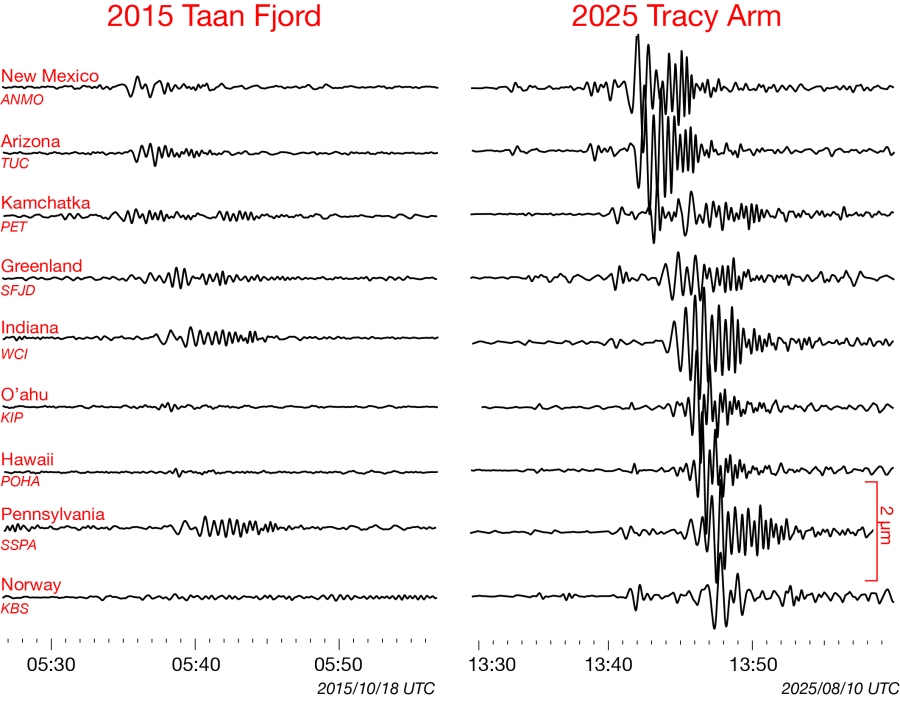
This is a side-by-side comparison of the Tracy Arm landslide and the comparable 2015 Taan Fjord event. The volume of the 2015 Taan Fjord slide had an estimated volume of 70-80 million m³. Volume estimates depend on the height and run out of the landslide, as well as the mass of the material. Regardless of what those parameters end up being, it feels safe to say, based on the seismic record, that the Tracy Arm slide is significantly larger in volume. The comparison suggests a slide well in excess of 100 million m³.Technical details: The seismograms are vertical component (BHZ) records from stations in the Global Seismographic Network at distances of 3200 to 4600 km. Records are filtered on 20 to 100 sec periods and corrected for instrument response.
Tsunami and waves
Below is a spectrogram of the Alaska Earthquake Center station S32K for a couple of days following the Tracy Arm landslide. The spectrogram is in a very low frequency range, so it is showing long waves (33s - 200s waves). There is a pretty clear signal at approximately ~64 seconds that lasts for around 35 hours (horizontal bright line in spectrogram), indicating a seiche may have occurred. A seiche is a standing wave that bounces back and forth in an enclosed area, such as a bathtub or a fjord. This observation is similar to the seiche signal that was observed at the Dickson Fjord landslide in Greenland in 2023. This suggests that the water in Tracy fjord sloshed back and forth every minute for 35 hours after the landslide hit the water!
The US Geological Survey reported that on Wednesday, August 13th, USGS personnel conducted an aerial survey of the area via helicopter, taking photos. USGS satellite and digital elevation model analysis indicate a runup height of 470–500 m (1500–1600 ft) opposite the landslide. The runup area is visible in the image below, the bare area across from the landscape scarp (middle row, far right image).
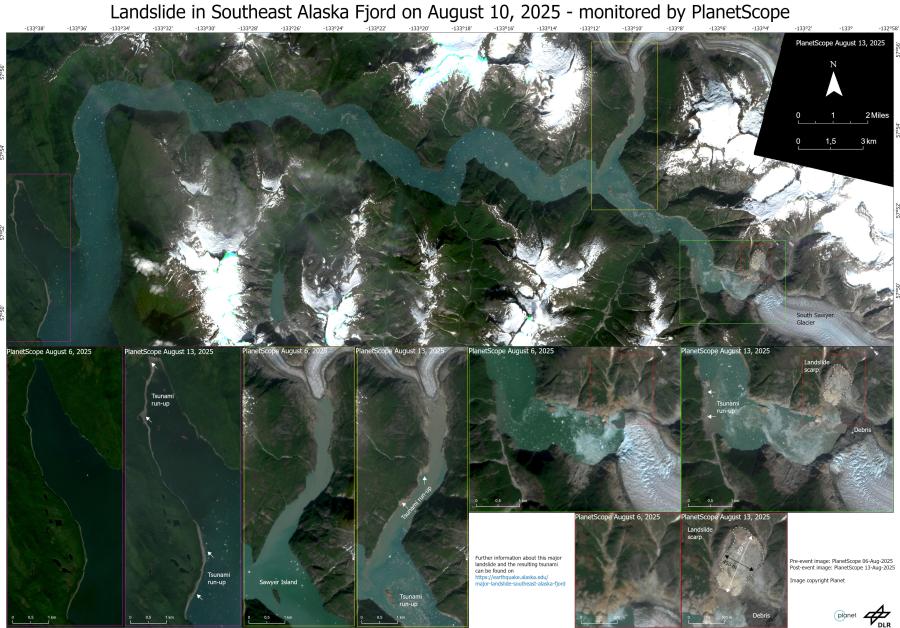
These before-and-after satellite images show places where the tsunami scoured the fjord walls down to bedrock, indicated by arrows. (The locations of the different insets can be found in the main image by the differently colored boxes.) This image uses the visible spectrum, like a normal photograph. Image credit: Planet for the data and Simon Plank, DLR
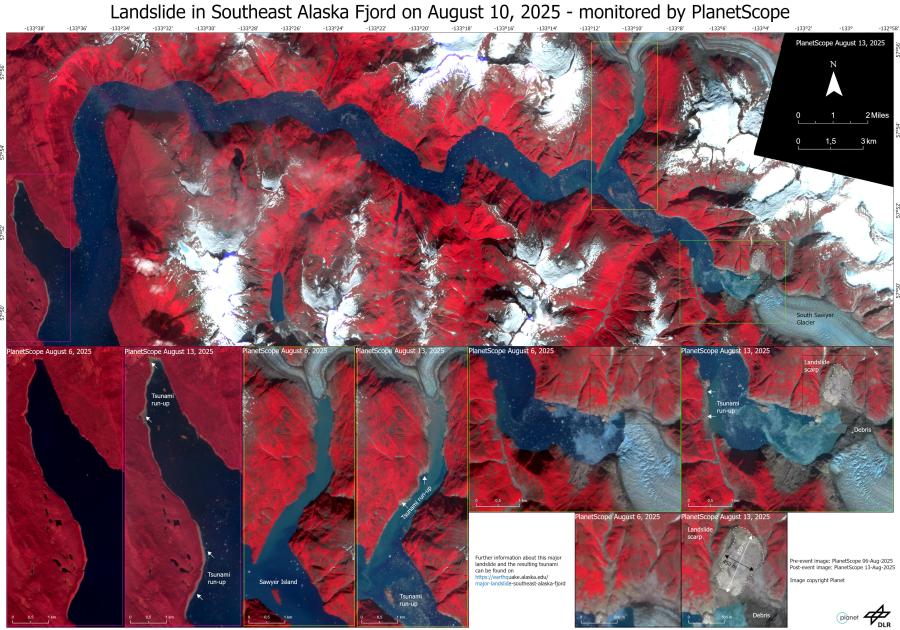
These satellite images use Near Infrared to show vegetation (in red) before and after the tsunami. Arrows indicate where the tsunami scoured the fjord walls down to bedrock. (The locations of the different insets can be found in the main image by the differently colored boxes.)Image credit: Planet for the data and Simon Plank, DLR
Learn more
Major landslide in Southeast Alaska fjord (Earthquake Center article, 8/12/25)
2025 Tracy Arm Landslide-Generated Tsunami (US Geological Survey)
The Case for a Landslide Monitoring Program (Earthquake Center article, 5/6/26)
Waiting to Fail: Research about 2025 Alaska landslide and tsunami warns that more are coming (Geophysical Institute, storymap)