


The past few weeks have seen a notable rise in attention to the possibility that Mount Spurr Volcano is nearing eruption, in part because of escalating seismicity. The Alaska Earthquake Center tracks a variety of seismic activity across the state, with a focus on potentially damaging earthquakes. While we do detect and locate earthquakes associated with volcanoes, our priorities are somewhat different from those of the Alaska Volcano Observatory (AVO).
AVO’s component of Alaska’s seismic monitoring system is focused on volcanoes. The Earthquake Center’s main objective is to accurately track felt earthquakes—including those at volcanoes—detected across Alaska on a statewide network.
Mount Spurr earthquakes began increasing gradually in April 2024, and the AVO raised its alert level to yellow/advisory in October 2024. In March 2025, signs began pointing to a likely eruption.
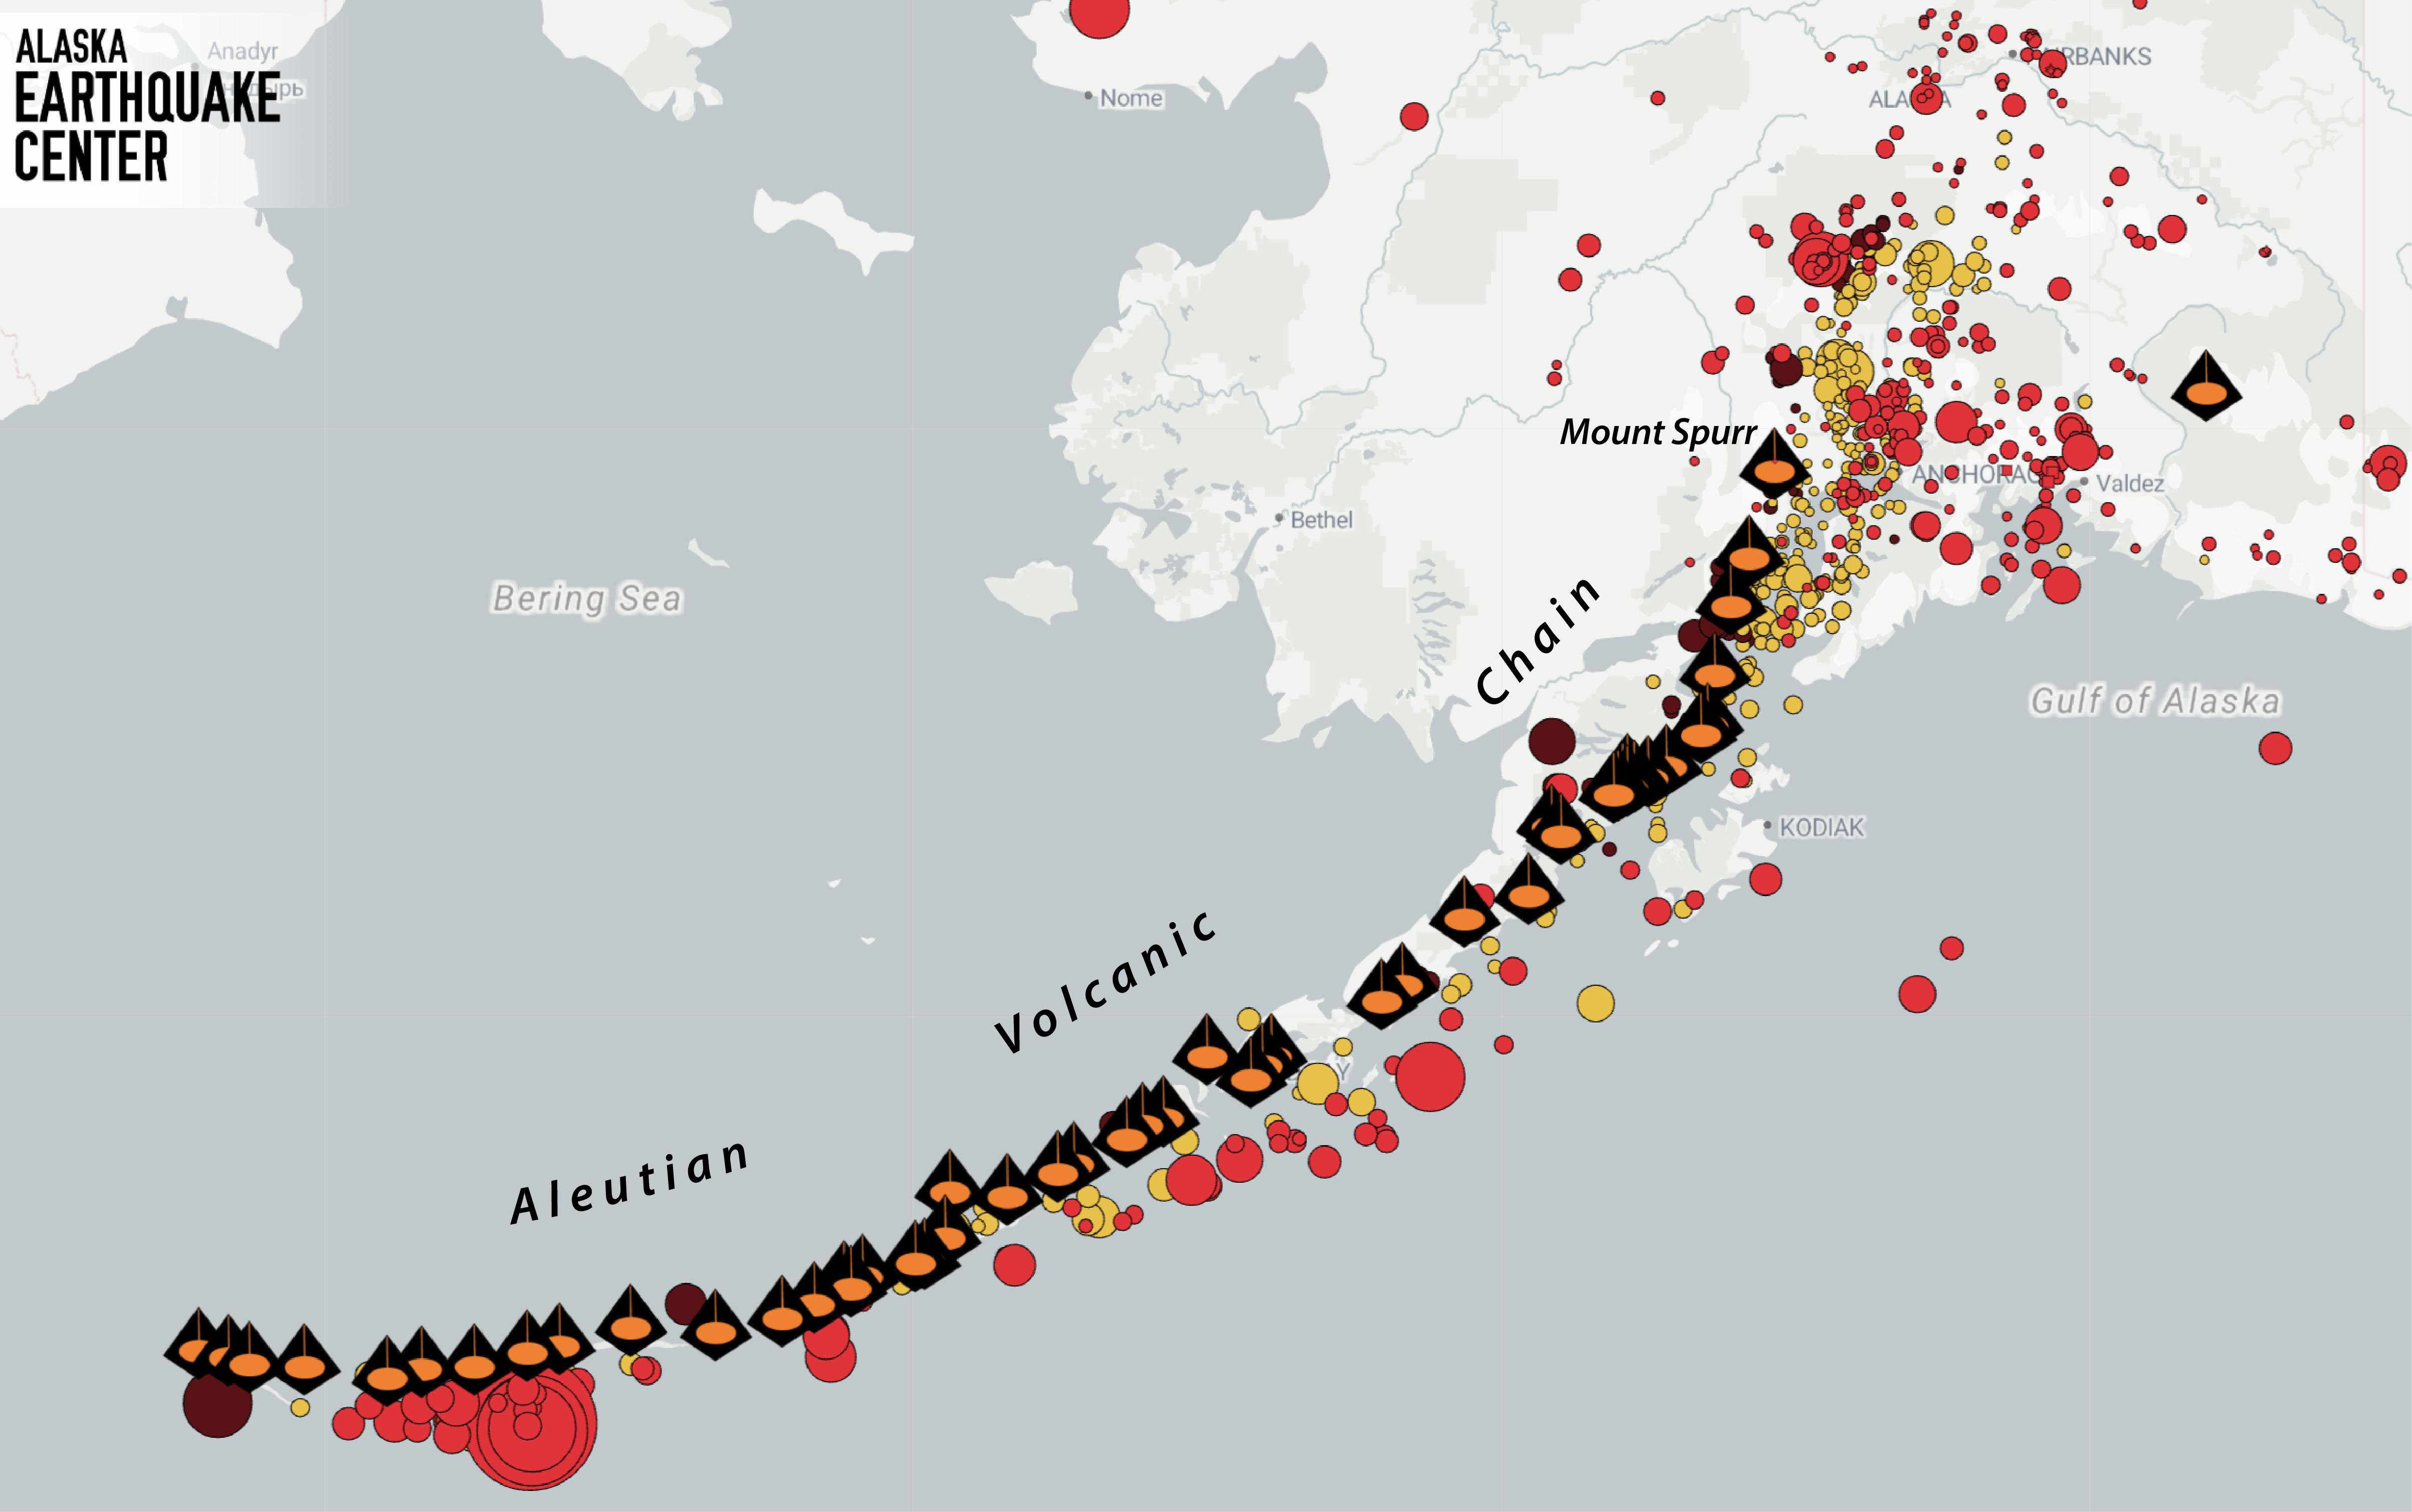
Located 78 miles northwest of Anchorage, Mount Spurr is a prominent peak in the Aleutian volcanic chain (Figure 1). Over the past century, it has gained attention due to several significant eruptions and ongoing periods of volcanic activity, with the last eruption in 1992. (For a complete volcanic history, visit the AVO site on Mount Spurr activity.)
Because we monitor earthquakes of note, we observe the earthquakes that often (but not always!) accompany eruptions. Southwestern Alaska also produces the state’s large megathrust earthquakes, along the same segment of the notorious circum-Pacific “Ring of Fire” that generates the magma feeding Alaska’s Aleutian volcanic arc. Distinguishing between subduction zone earthquakes and volcanic seismicity is an important part of assessing the different hazards.
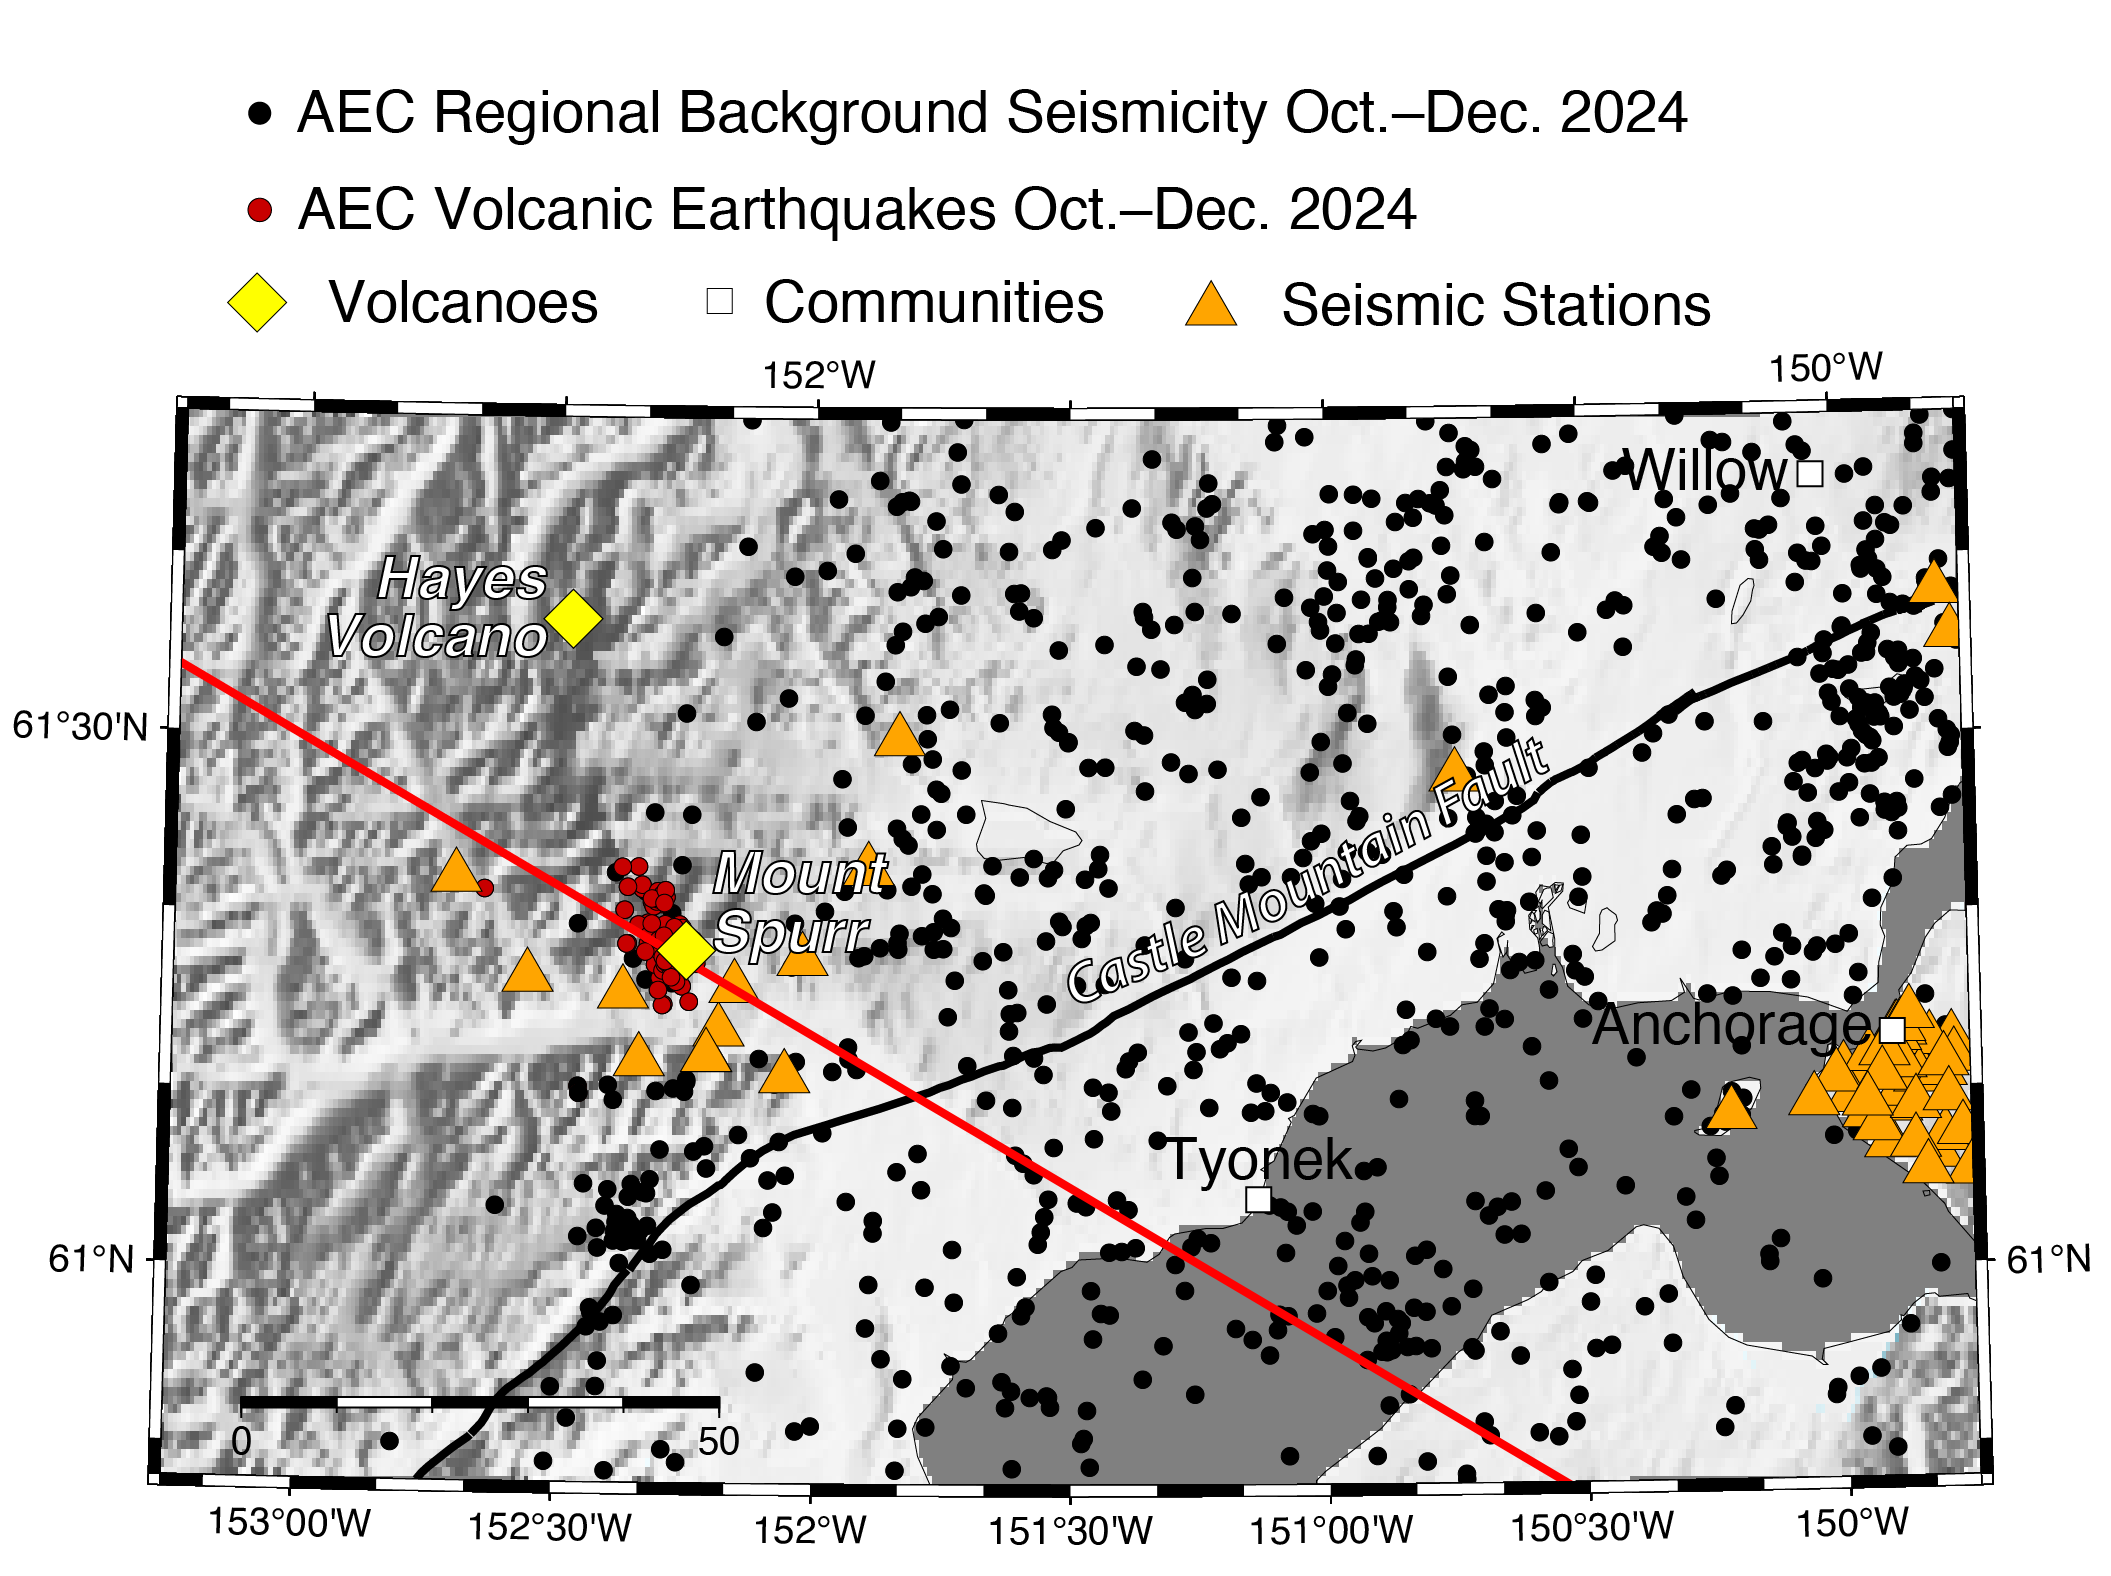
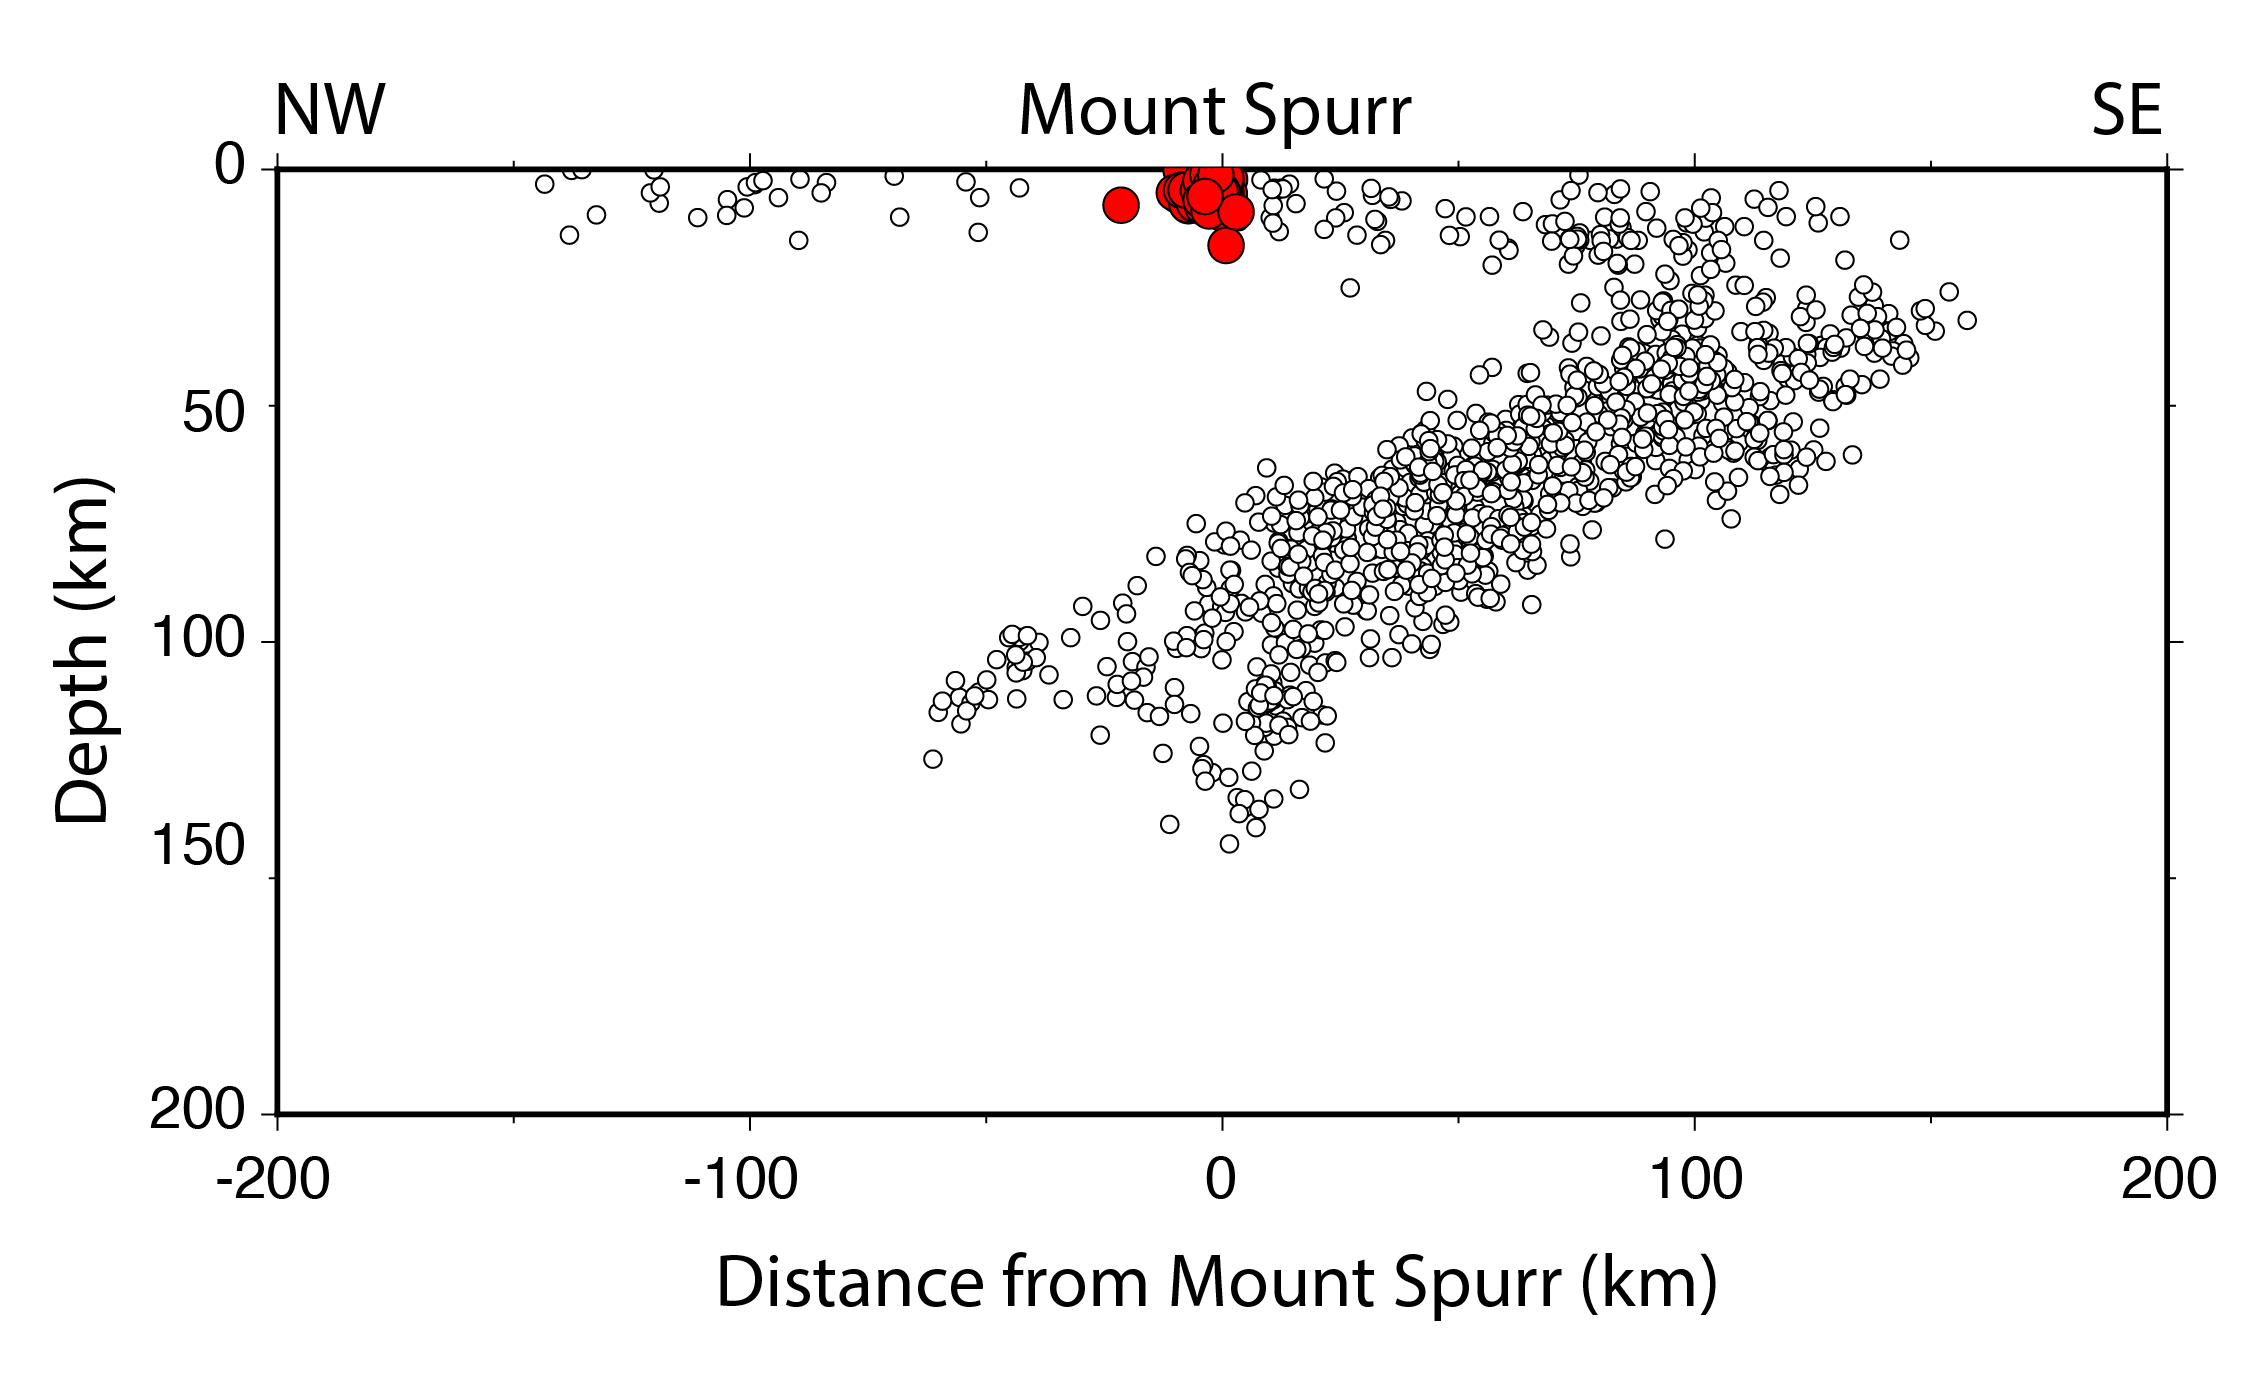
An increase in seismic activity near volcanoes often indicates movement of magma or gas beneath the surface. As magma and gas accumulate and expand, they cause the volcano to bloat and crack. This cracking is picked up by seismic sensors, and Earthquake Center analysts know to tag these events as volcanic because they are shallow and happen near volcanoes (Figures 2 and 3). How much and what type of activity is of interest differs for the Volcano Observatory and the Earthquake Center.
Data from every station within Alaska’s seismic networks are shared across organizations that review all types of seismic events. In the past year, AVO seismic data analysts processed almost 3,700 earthquakes just in the vicinity of Mount Spurr. This high number results in part from the very low threshold that AVO has set for the seismic activity they detect and verify, providing a level of detail for scientists to scrutinize the inner workings and stage of unrest of known active volcanoes.
At the Alaska Earthquake Center, our seismic data analysts review about 45,000 seismic events each year, the vast majority of which are earthquakes. We have a somewhat higher threshold for the events that we review, but then again, we also have our sights on the entire state. Our focus on capturing felt events also brings us insight into other types of seismic information whose clearer understanding improves our earthquake detections.
While the Earthquake Center and the Volcano Observatory focus on different aspects of seismic activity, enhanced understanding of Alaska’s geologic hazards is at the heart of it all.
For more information on the recent activity at Mount Spurr, check the AVO site on Mount Spurr activity.