
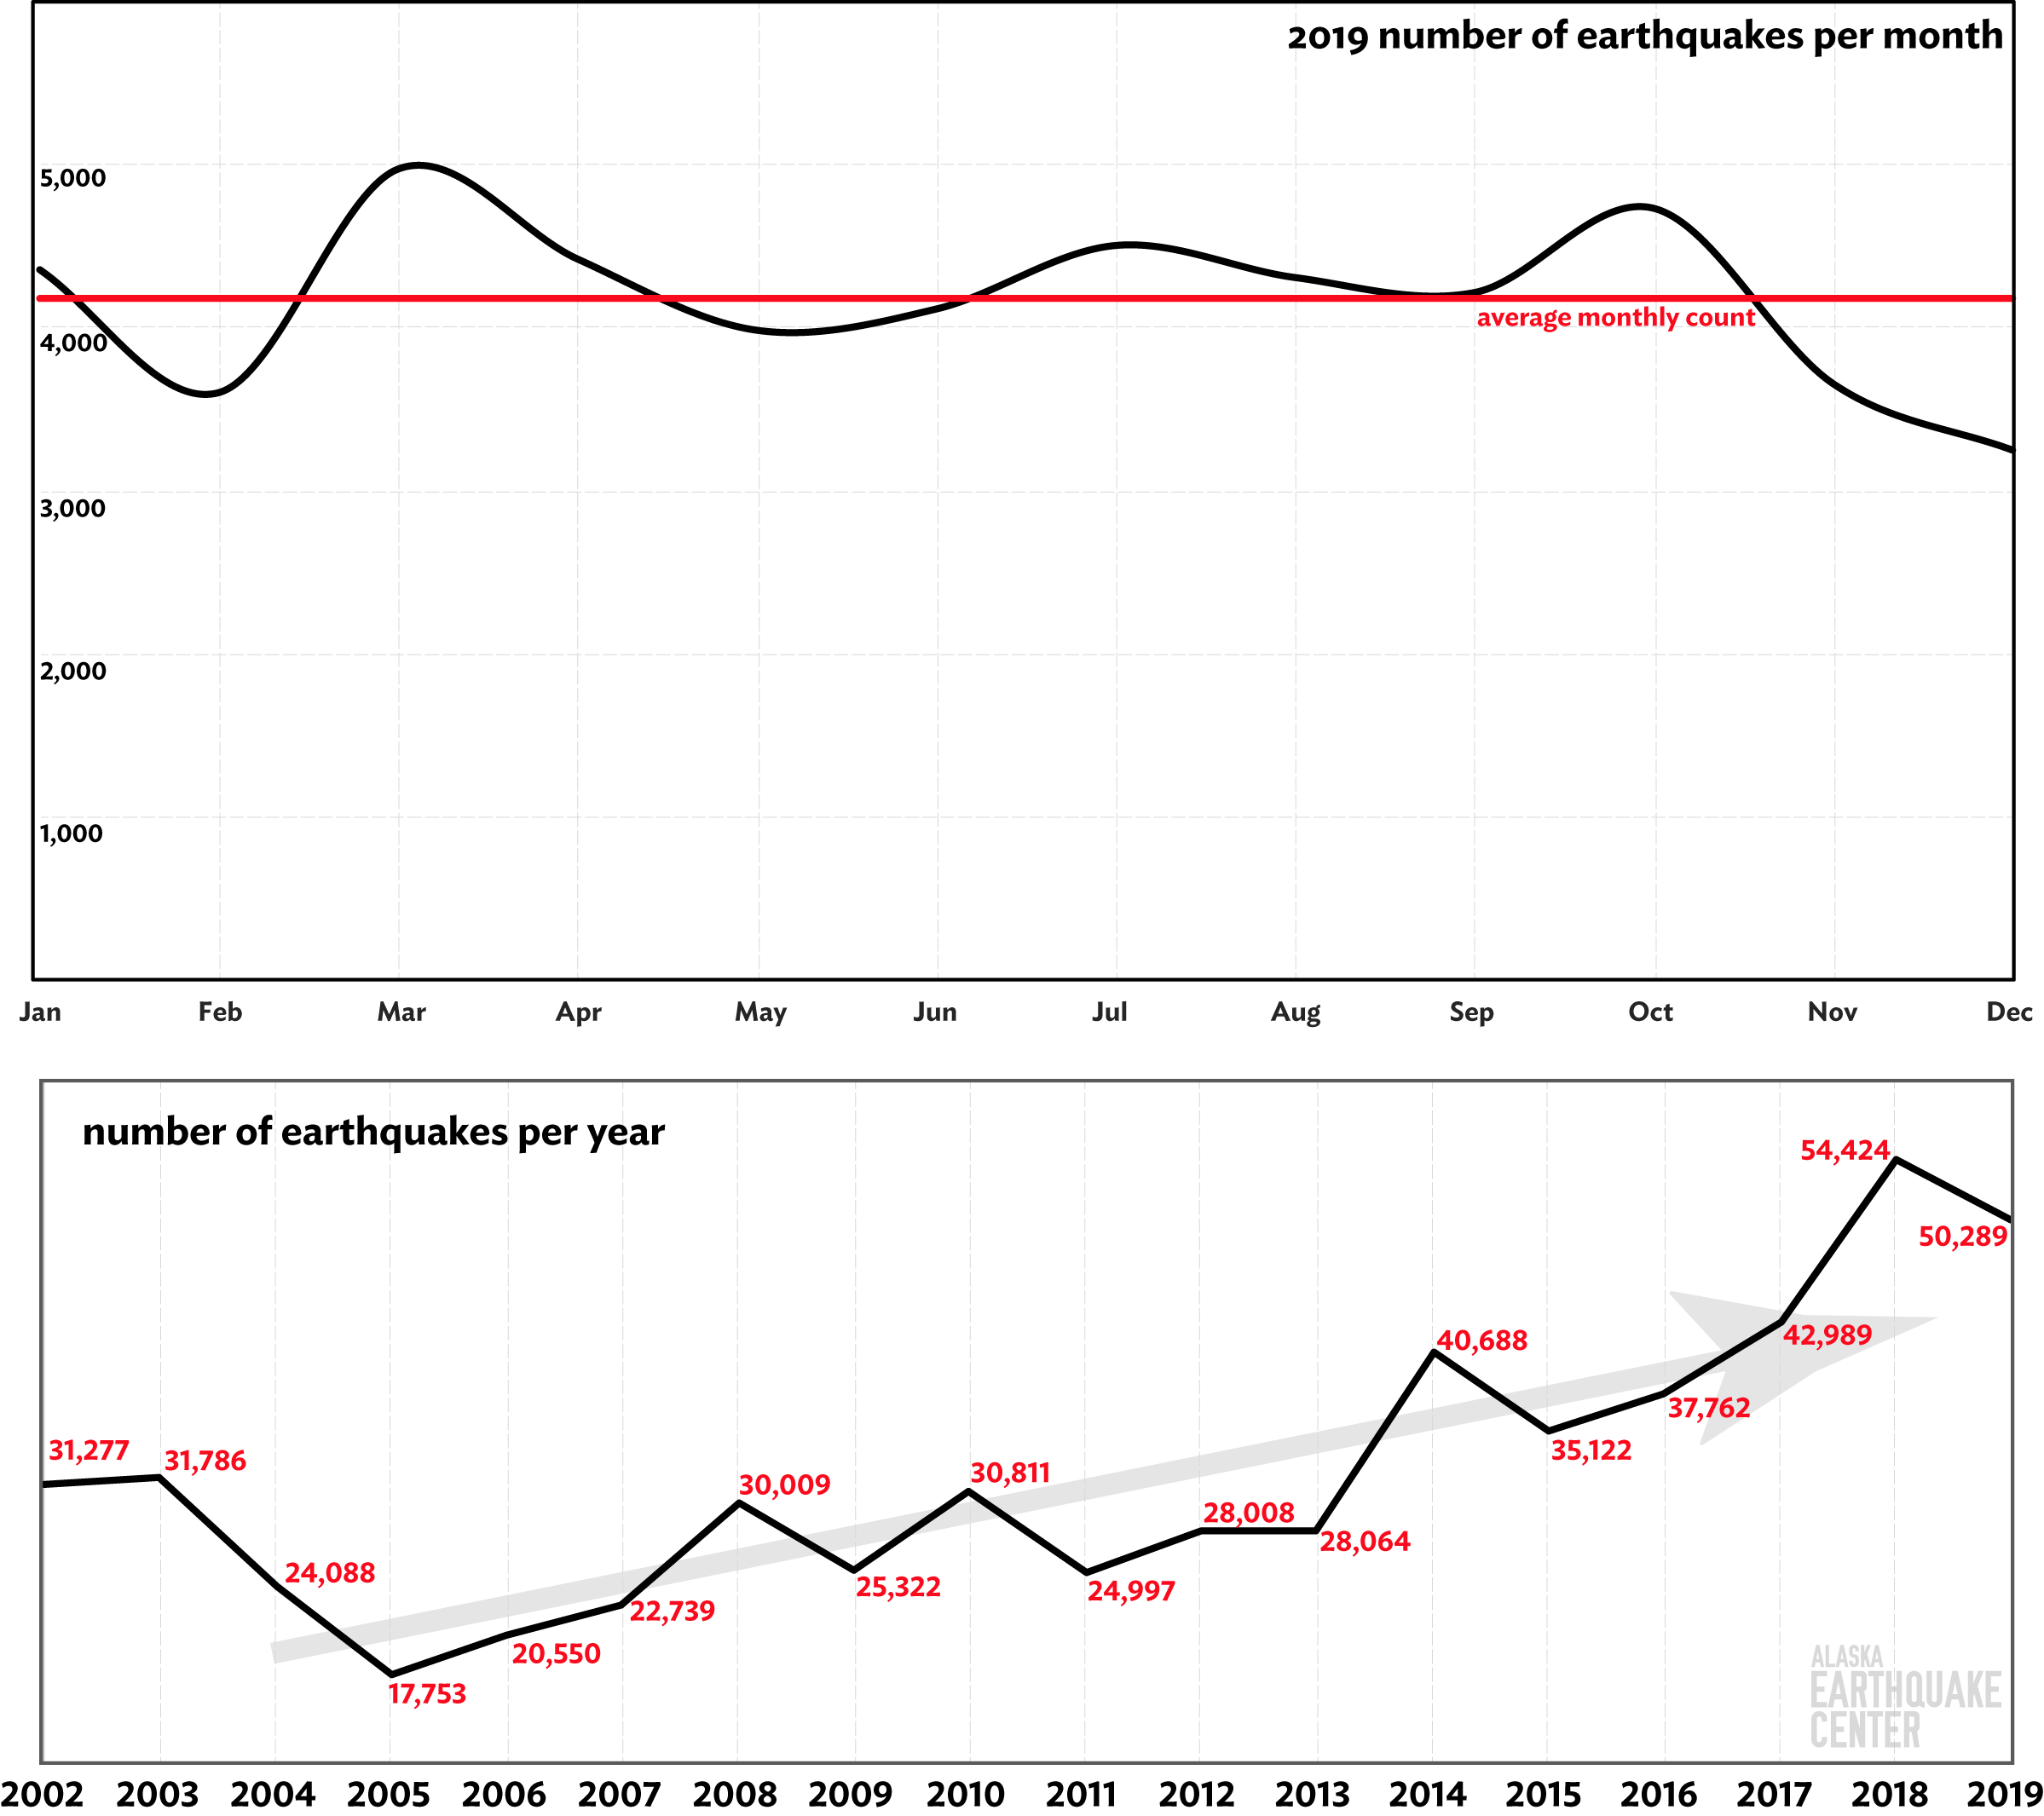
(Bottom) The number of earthquakes per year since 2002. On average, the number of events per year is slowly increasing. This is due to increased station coverage and years with active aftershock sequences and swarm activity.
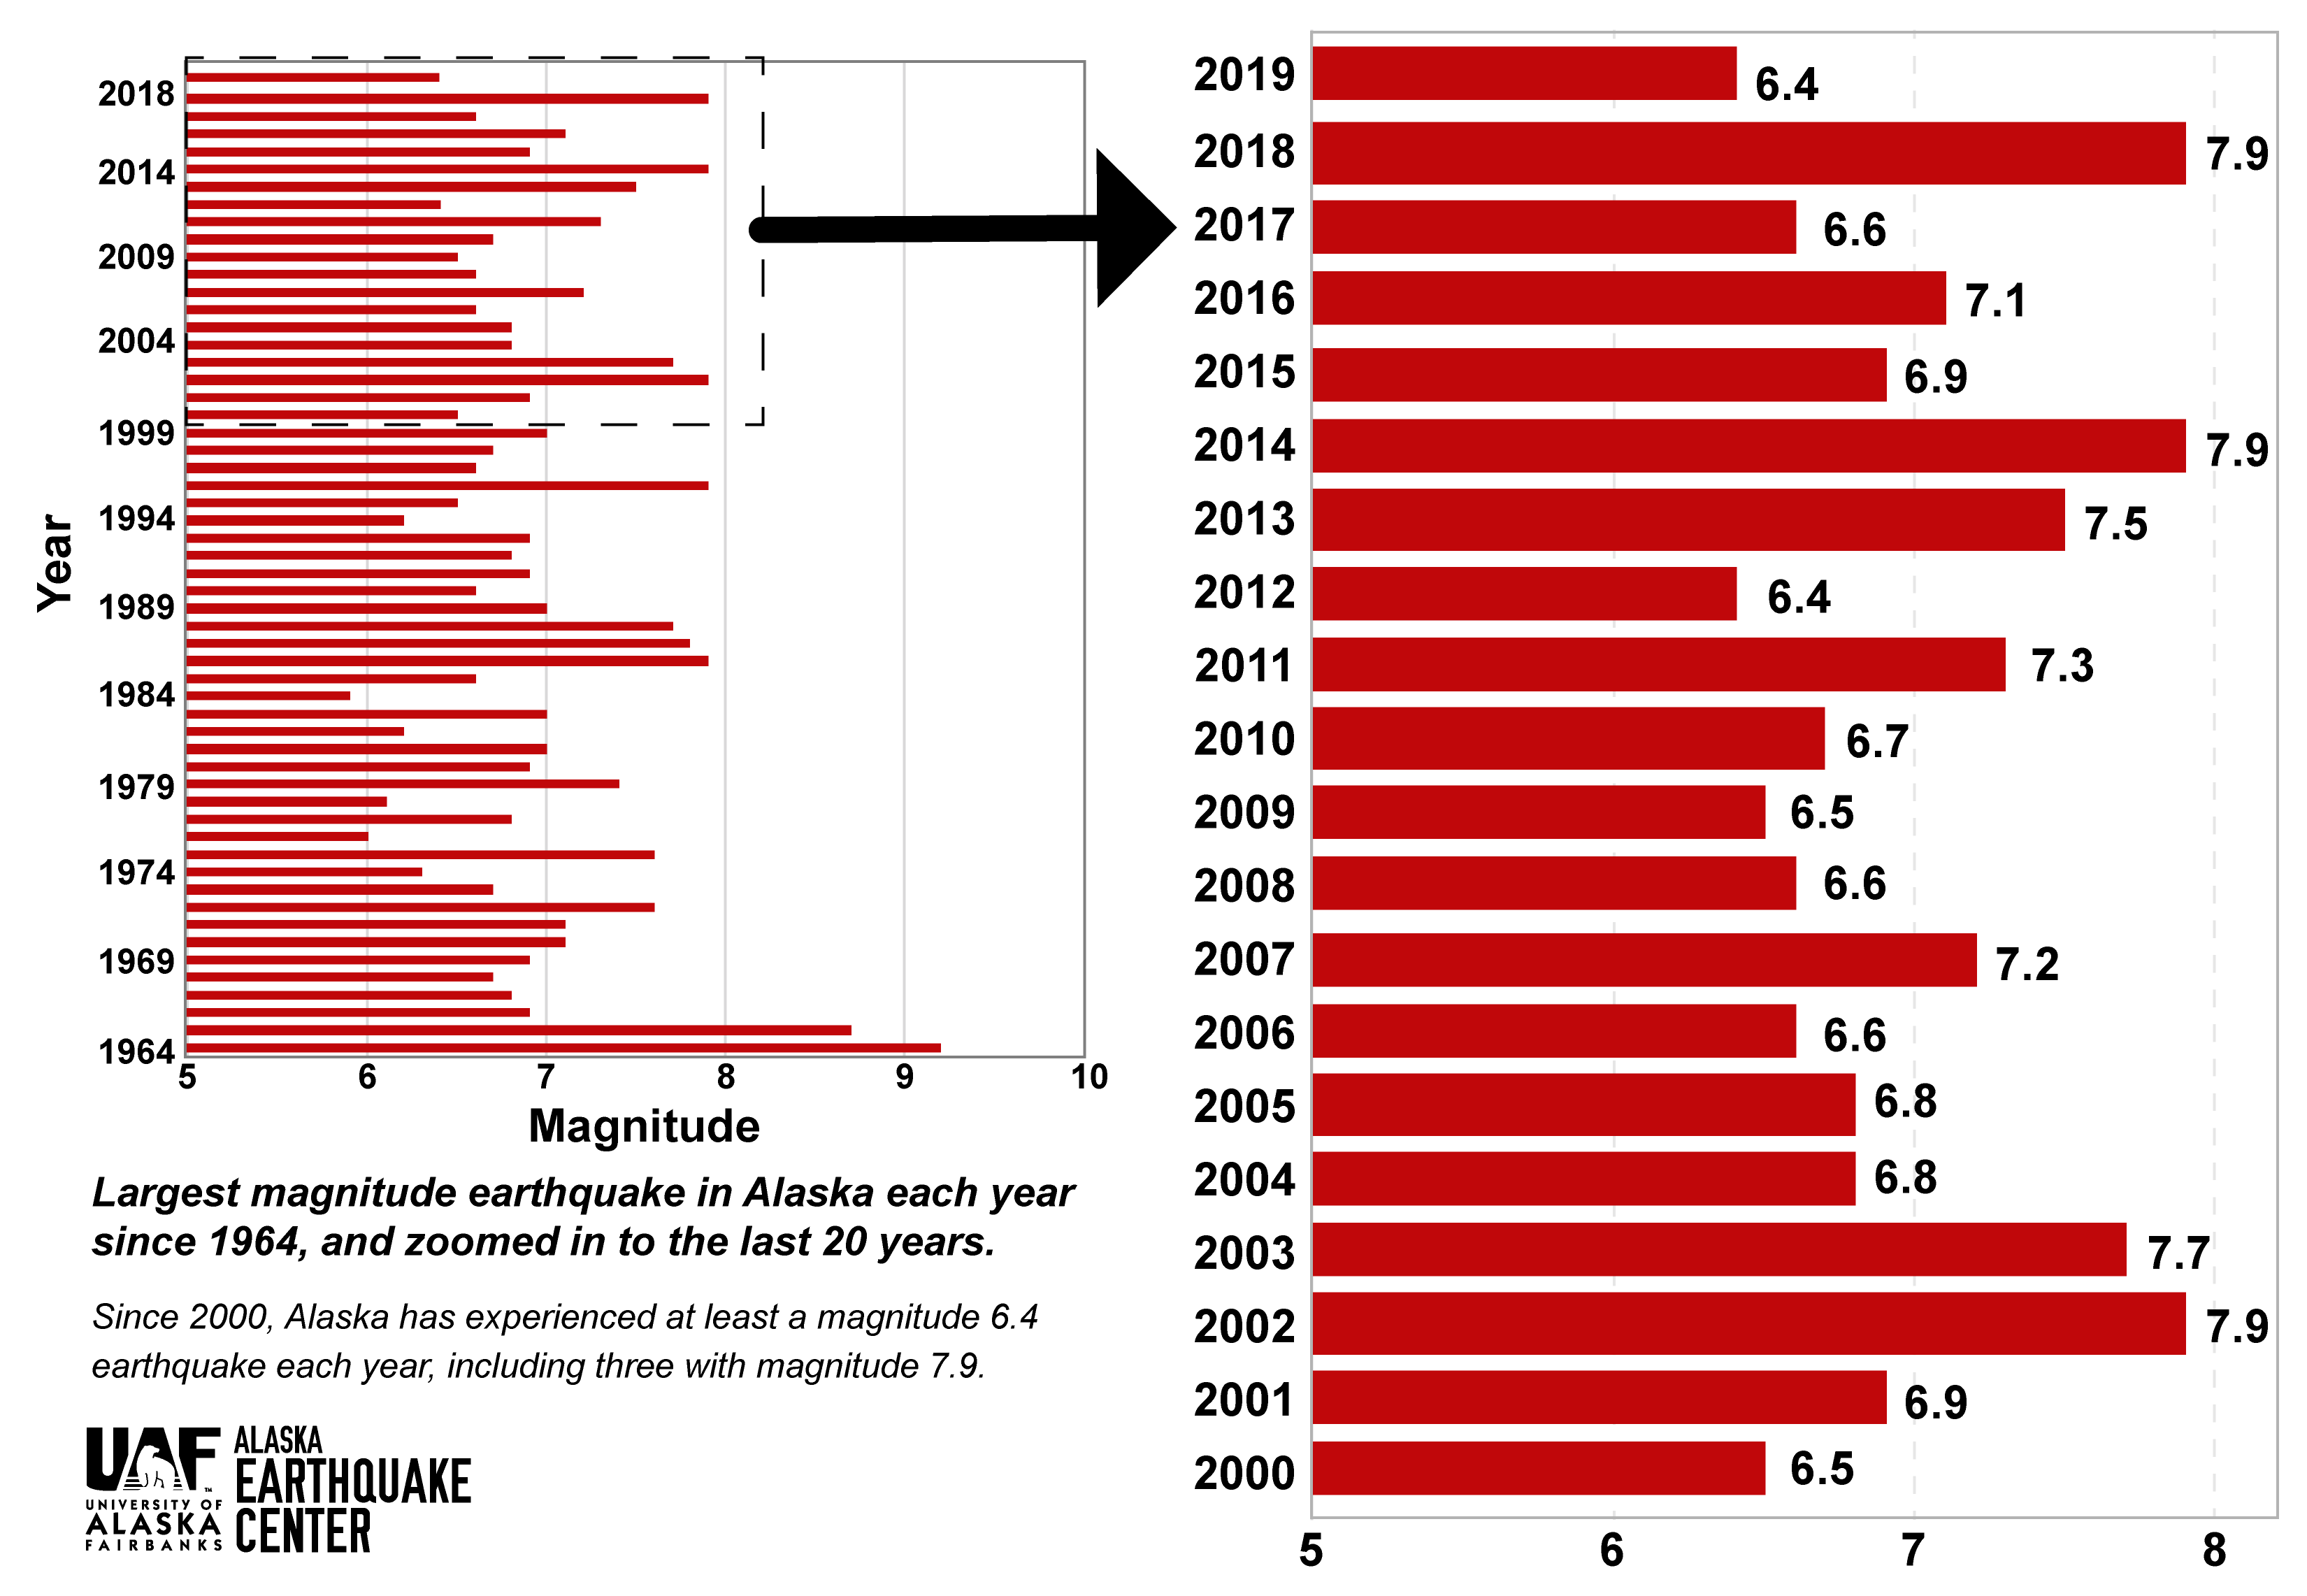
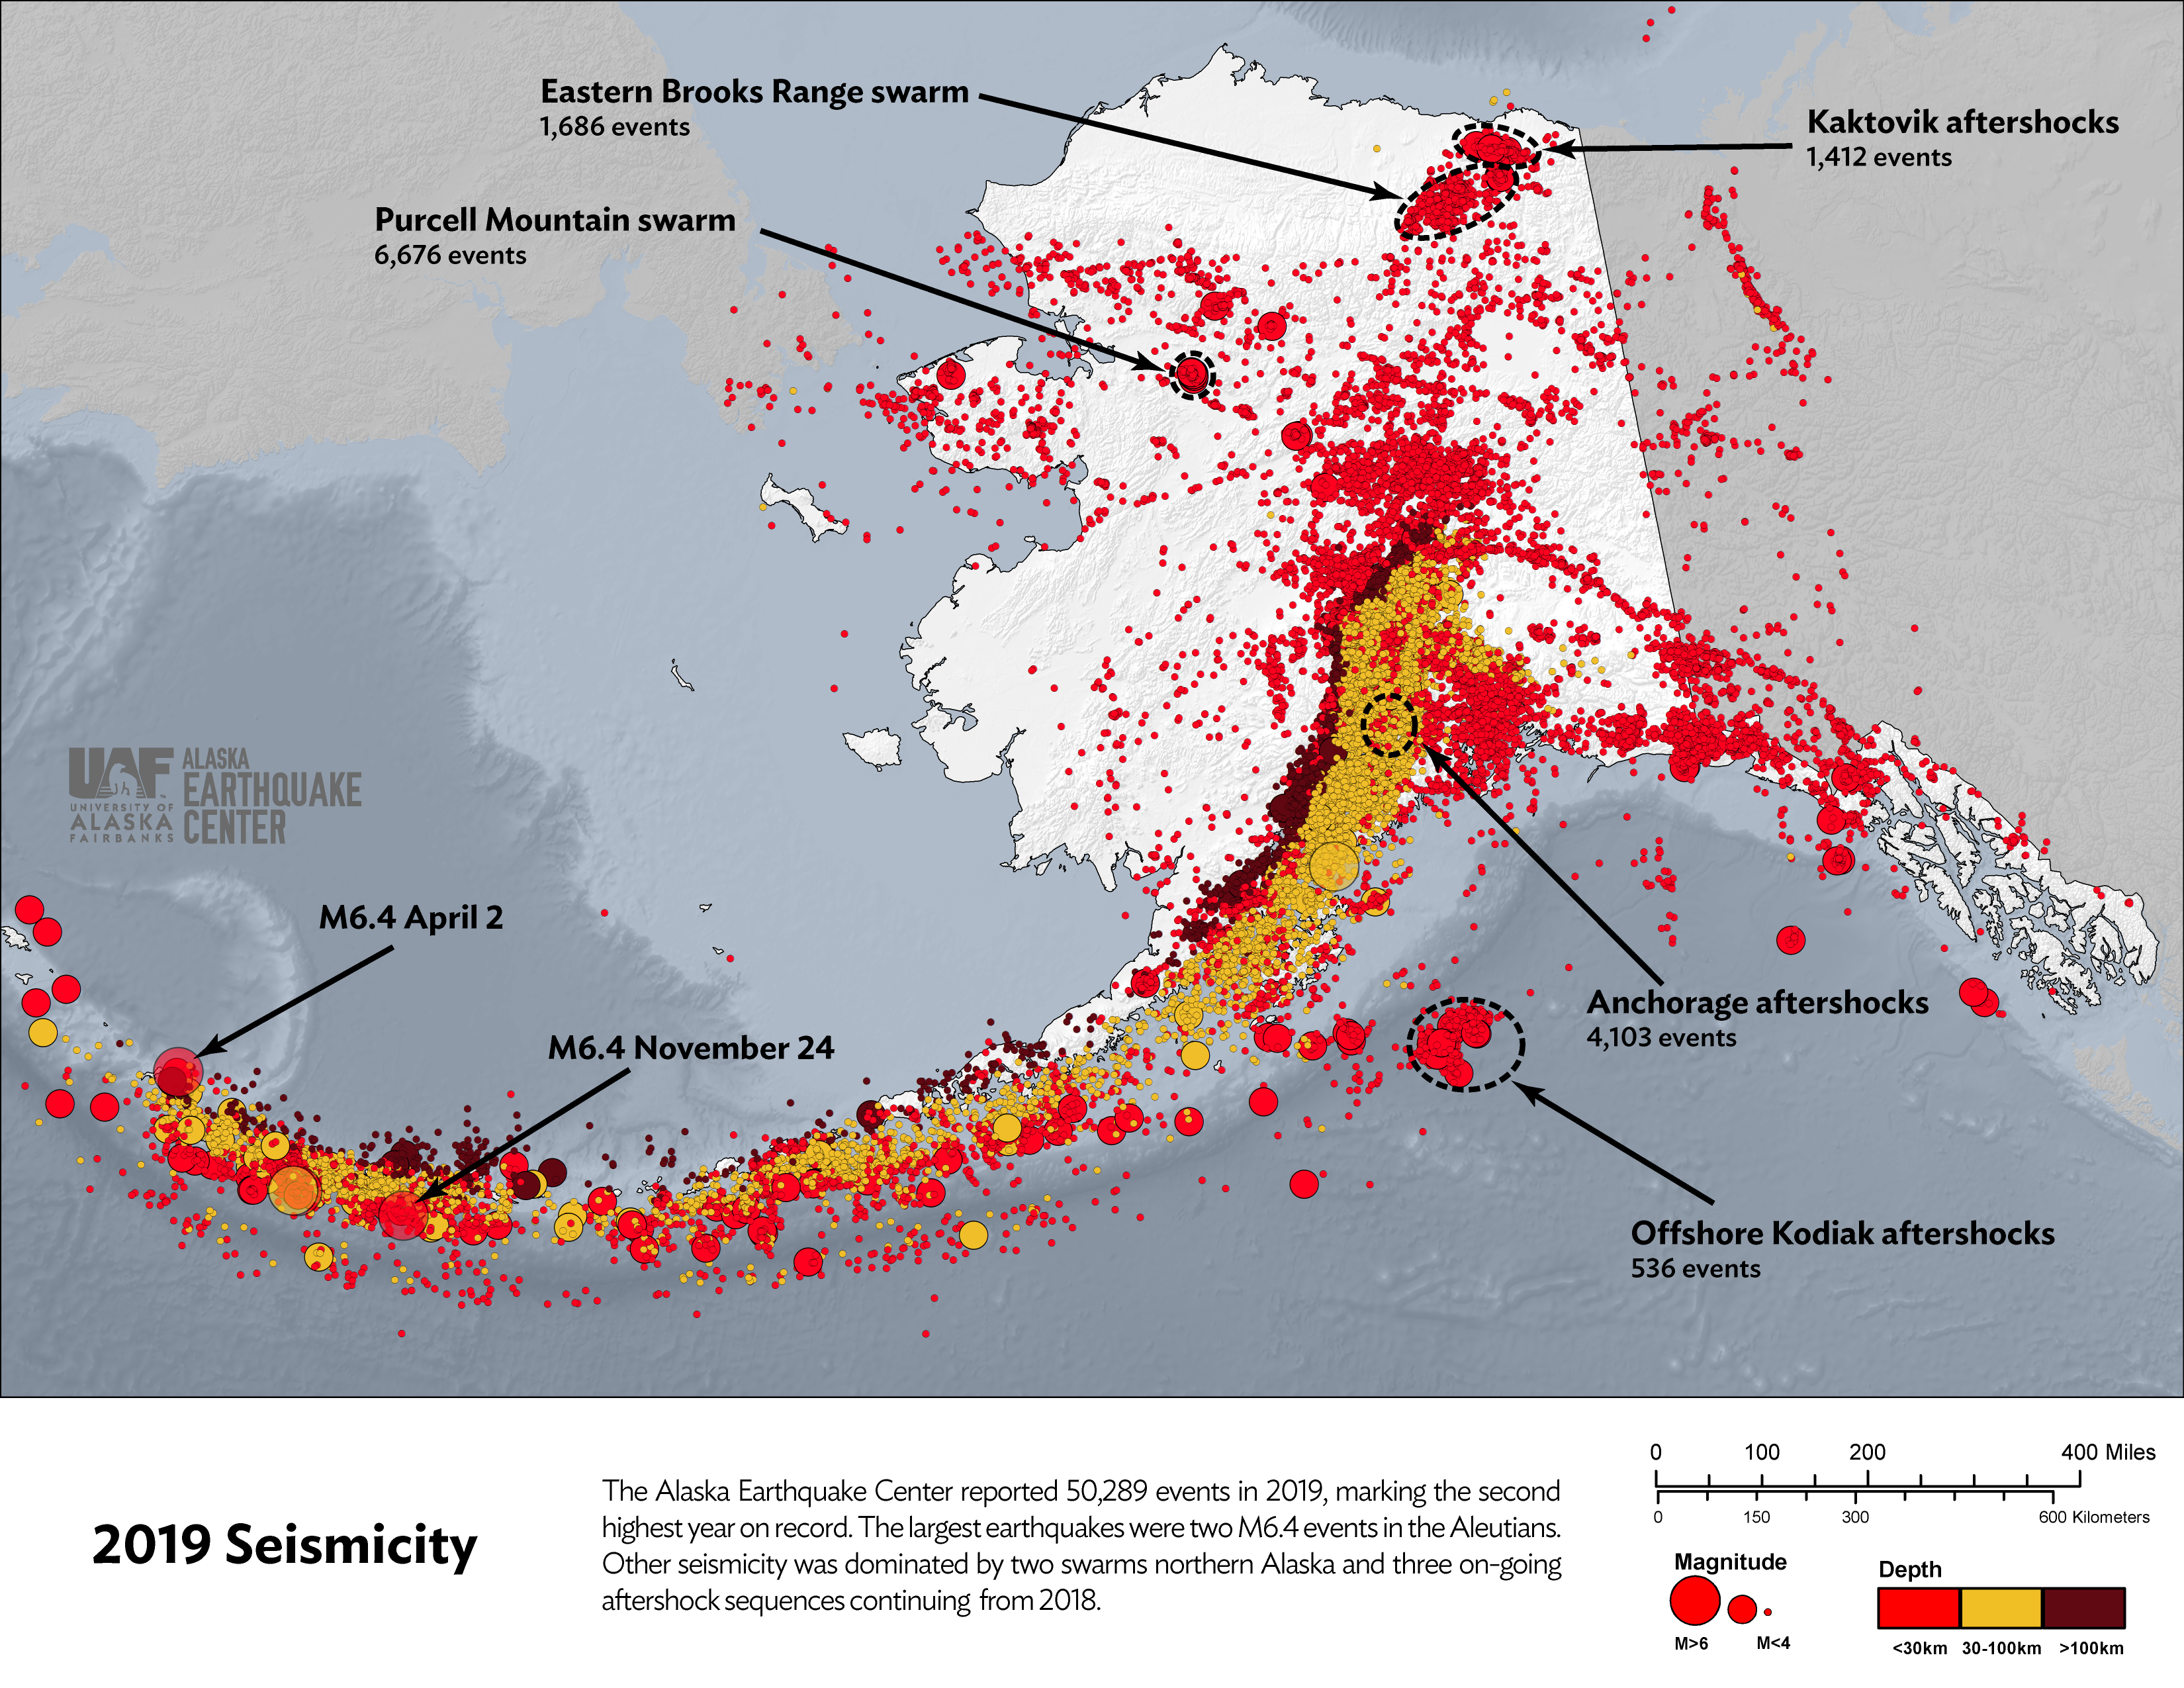


Seismicity in Alaska had another stand-out year in 2019. With a total of 50,289 reported earthquakes, 2019 finished as a runner up to the record-breaking 2018 (figure 1). The earthquake depths ranged between 0 and 165 miles (265 km). The largest earthquakes were two magnitude 6.4 events: one on April 2 in the Rat Islands and one on November 24 in the Andreanof Islands regions of the western Aleutians. The last time the largest event for the year only reached magnitude 6.4 was in 2012 (figure 2). Although there were no major earthquakes, the continuing aftershocks from the November 30, 2018 Mw 7.1 Anchorage earthquake and August 12, 2018 Mw 6.4 Kaktovik earthquake added substantially to the total for 2019. We continued to record aftershocks of the January 23, 2018 Mw 7.9 Offshore Kodiak earthquake, but the total number of those for the year was just slightly more than 500 (figure 3).
Other major contributors to the high total were the eastern Brooks Range swarm and a new swarm in the Purcell Mountains in the central Brooks Range region (figure 3). An earthquake swarm breaks the rules for the more usual mainshock-aftershock earthquake sequence. There is ongoing earthquake activity with varying event rates and magnitudes in a particular area, but without one large earthquake that triggers the activity. (Learn more about swarms in our previous article “What is an earthquake swarm?”.) Aftershocks from a large earthquake generally follow a pattern, so we can forecast about how long an aftershock sequence will last. Swarm activity is highly variable, so it’s impossible to determine how long they will continue. The Purcell Mountain swarm’s activity peaked in March and again in October, resulting in those months having the two highest totals of reported earthquakes (figure 1).
The number of detected earthquakes is also higher than in the past because of the continued presence of the USArray network. The dense network coverage of mainland Alaska has allowed us to detect earthquakes in previously unmonitored regions, as well as much smaller earthquakes, so we can build a more complete picture of the full sequence of aftershocks and swarm activity.
Last fall we reported on the status of these sequences (“Checking in on Alaska’s swarms and aftershocks”). Below is the end-of-year update on these sequences.
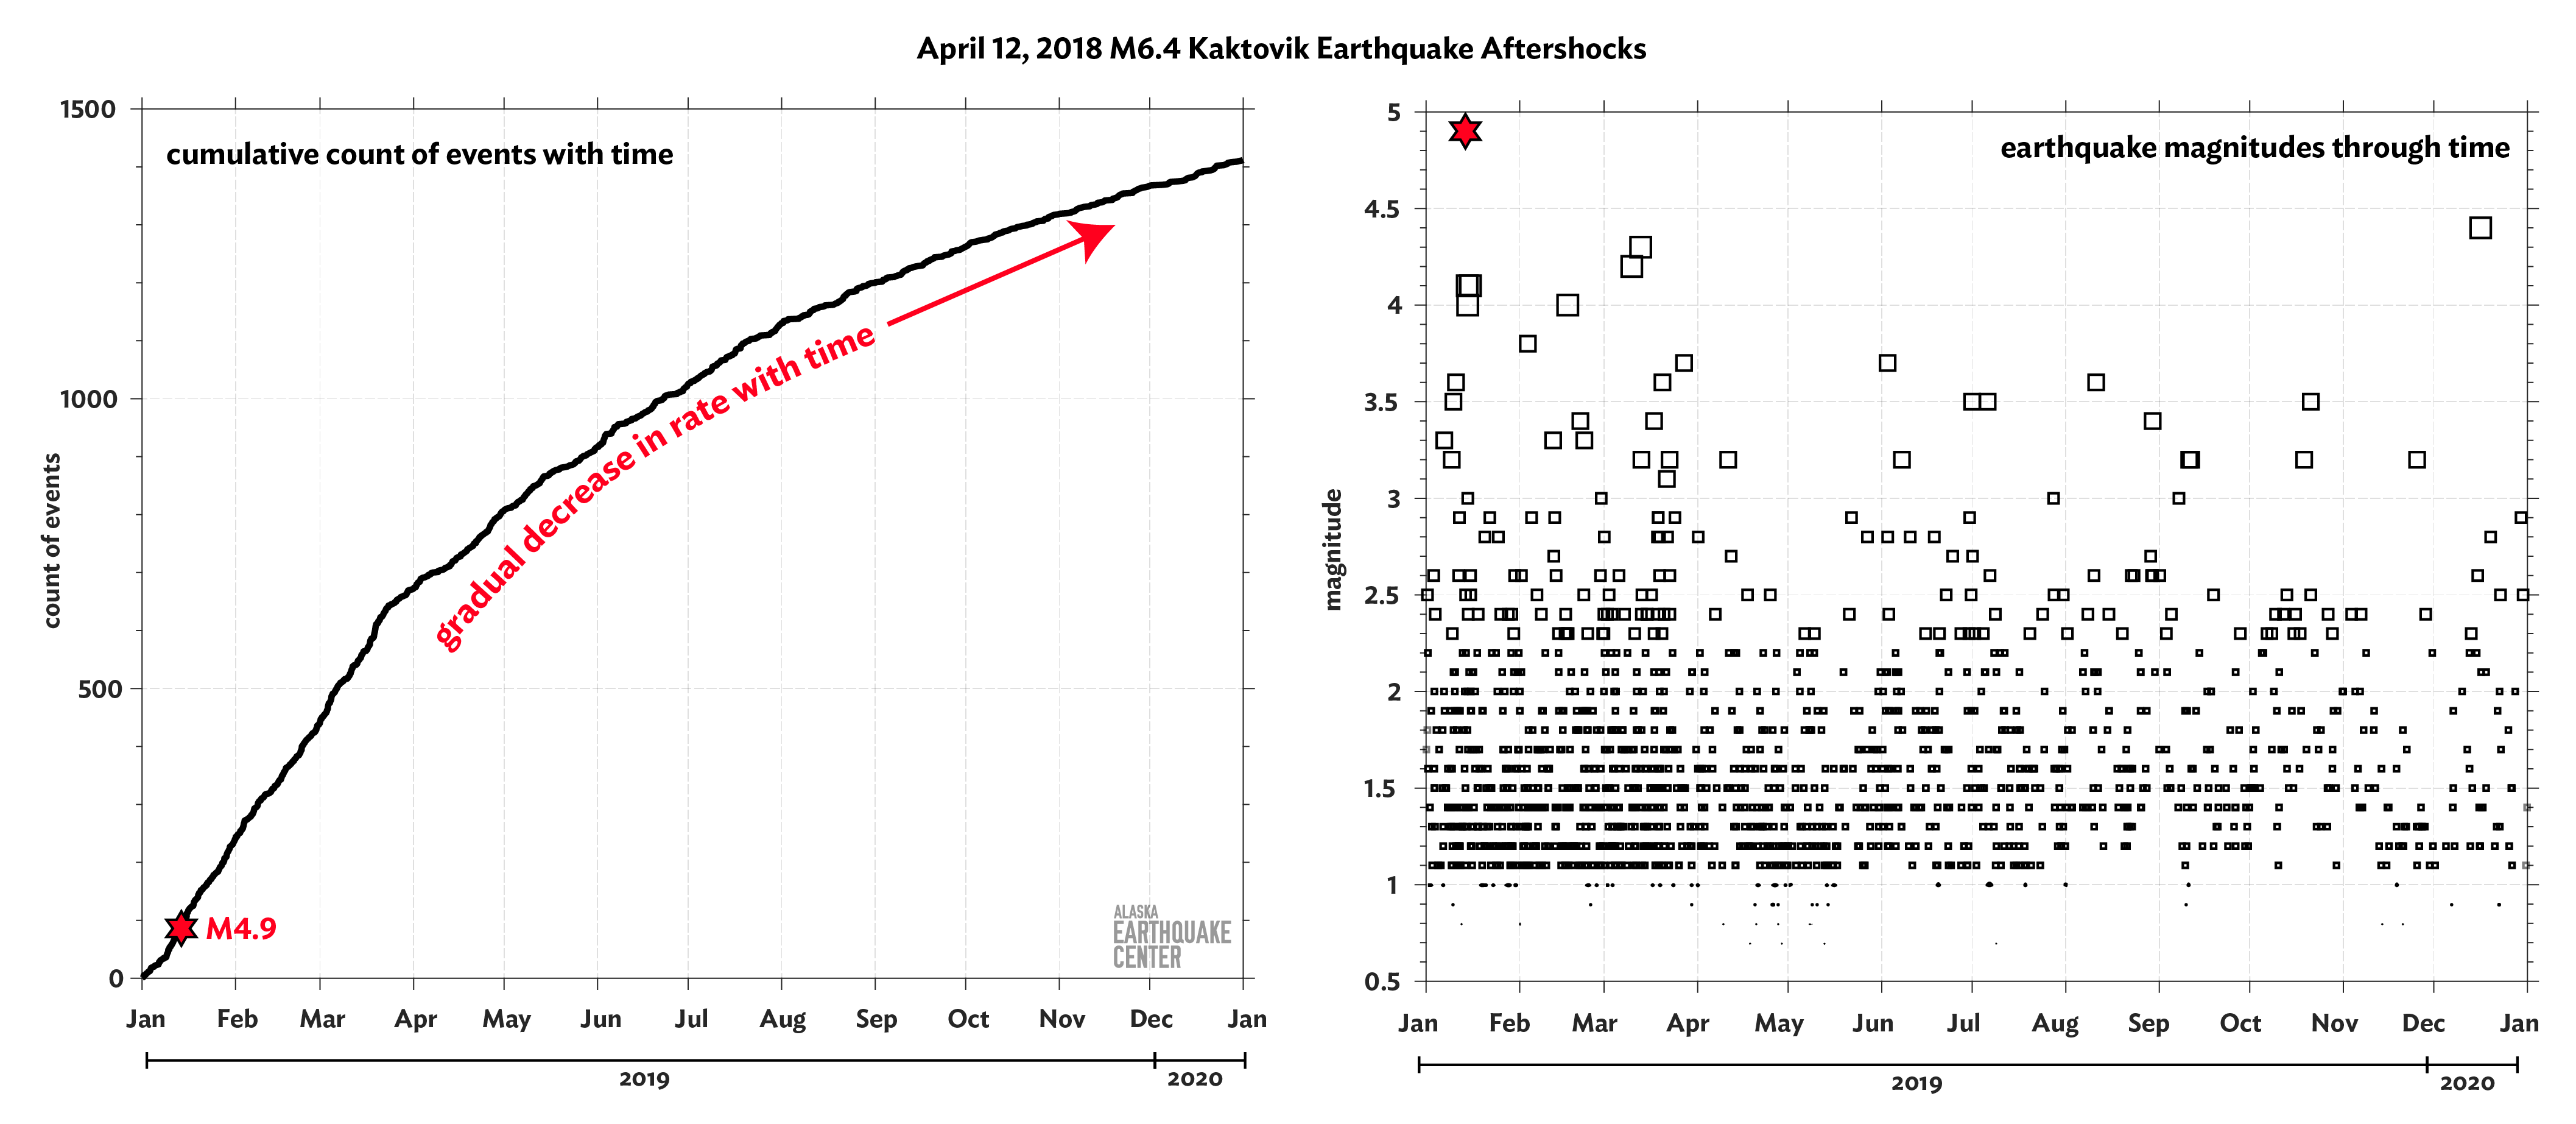
On August 12, 2018 a magnitude 6.4 earthquake occurred about 50 miles south of Kaktovik in the northern foothills of the eastern Brooks Range. It was the largest earthquake ever recorded in the region. It generated a very energetic aftershock sequence, as is typical for crustal earthquakes. In 2019 we recorded 1,412 aftershocks from this earthquake, with magnitudes ranging between 0.5 and 4.9. While the rate of aftershocks has been steadily declining, we expect aftershocks to continue for at least another year and possibly longer (figure 4).
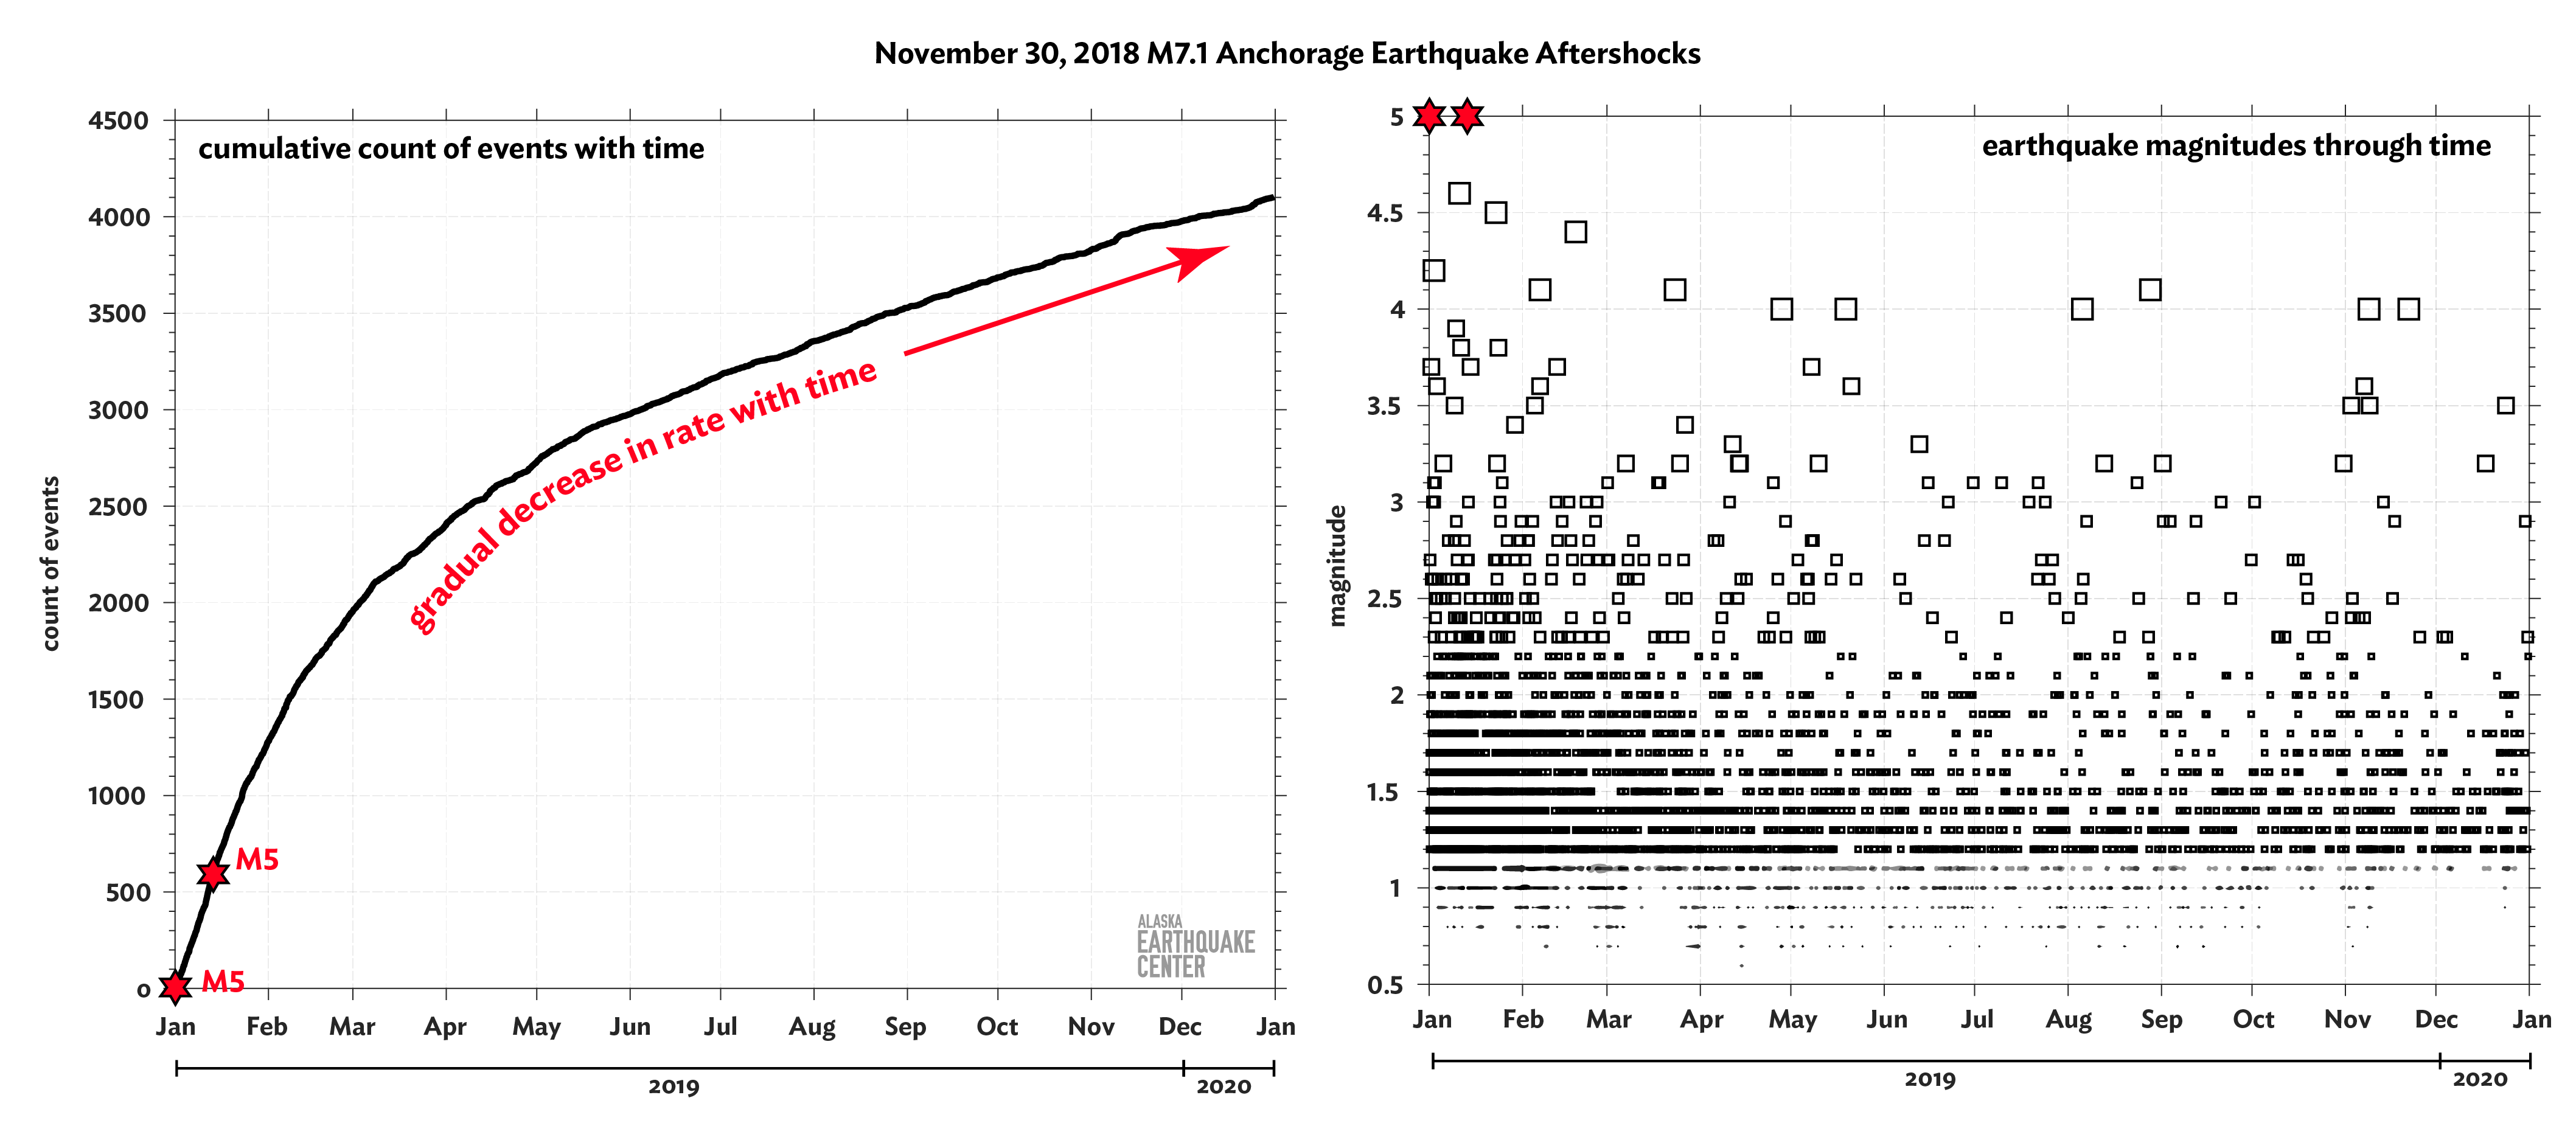
On November 30, 2018 a magnitude 7.1 earthquake occurred about 10 miles north of downtown Anchorage and ruptured a fault between about 20 and 35 miles deep. It caused the strongest ground shaking in the area since the 1964 Mw 9.2 Great Alaska earthquake. While the November 30 earthquake did not cause casualties or serious injuries, its economical and psychological impacts on the local population were profound. It caused widespread power outages, structural and non-structural damage to public and private buildings, damage to roadways and railways, and resulted in closures of several schools and multiple businesses. It generated a very energetic aftershock sequence, which was not expected of an earthquake of this type. In 2019 we recorded 4,103 aftershocks with magnitudes ranging between 0.5 and 5.0. While the rate of aftershocks has been somewhat declining, there are still aftershocks large enough to be felt. We expect this aftershock sequence to continue for another year (figure 5).
The eastern Brooks Range swarm kicked into high gear in the summer of 2018. The activity subsided during winter and spring, but picked up again in late summer and early fall of 2019. The cause of this intriguing seasonal shift is unknown. We recorded a total of 1,686 earthquakes within this swarm in 2019, with magnitudes ranging between 0.6 and 3.5. While the activity level was not as high as in 2018, it still remained above the background level as of the end of 2019. The eastern Brooks Range swarm is unusually large, covering an area about 40 miles by 60 miles (70 km by 100 km), about three times the size of other known swarms in Alaska. We continue to monitor this swarm closely (figure 6).
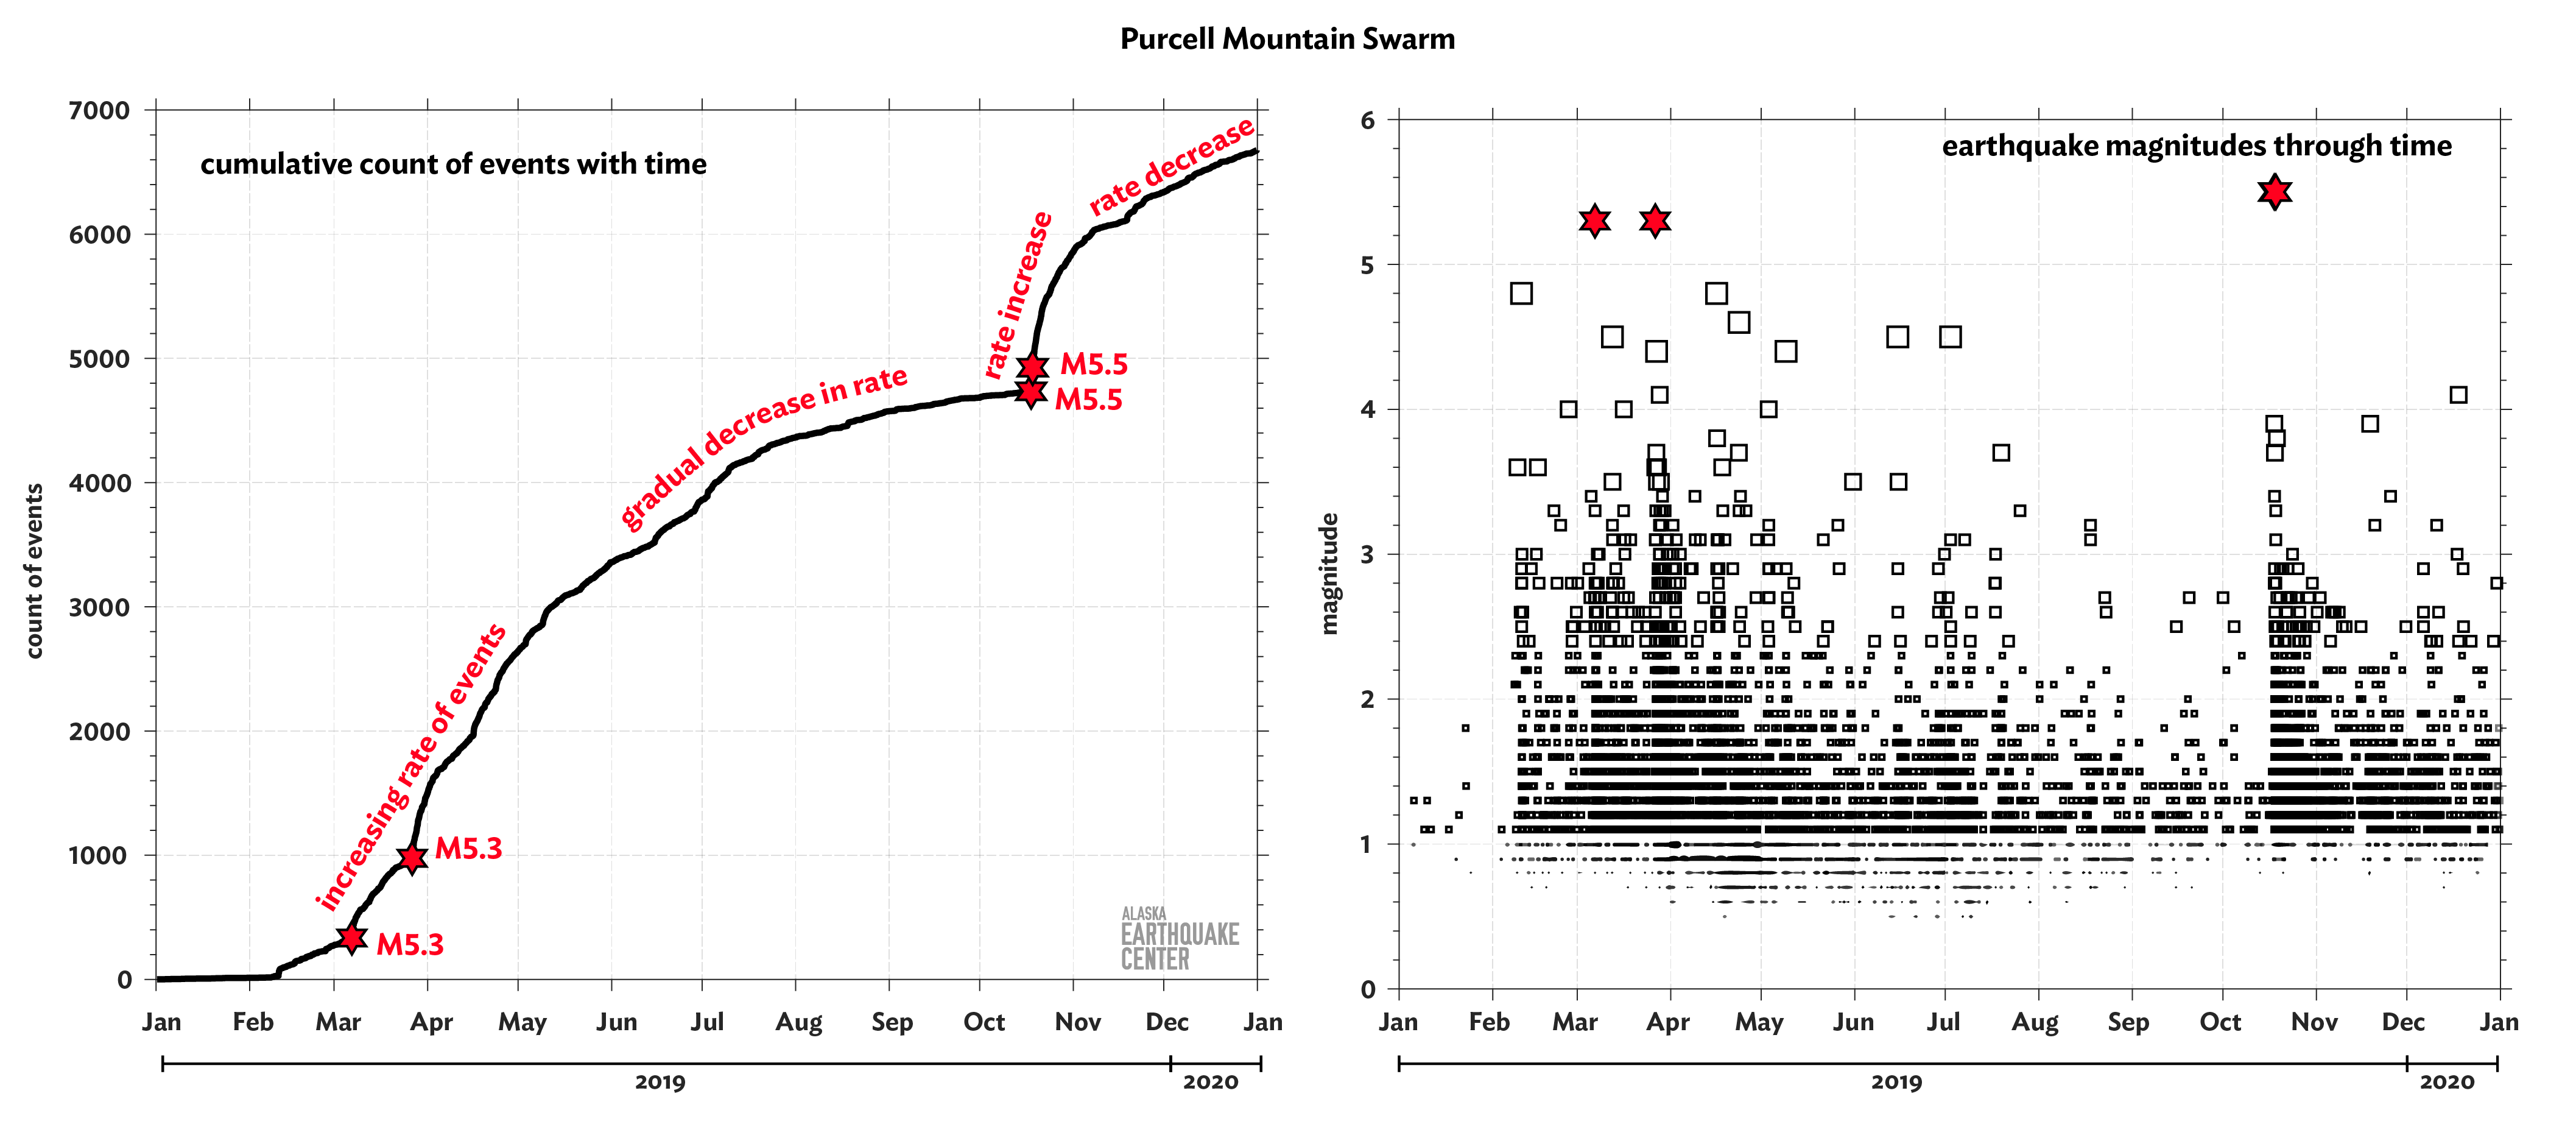
This swarm began rather suddenly in early February. We recorded a total of 6,676 earthquakes in this swarm with magnitudes ranging between 0.4 and 5.5. The activity peaked in March and October with a pair of magnitude 5.3-5.5 earthquakes in each month respectively. This swarm contributed over 10% of events towards the 2019 total, with the majority of the swarm events with magnitudes less than 3. As of the end of December, activity remained above the background levels. We will keep a close eye on this hot spot as long as the activity remains high (figure 7).
Watch the map below to see the earthquakes distribution in space and time. Each frame shows one day's worth of earthquakes as white dots.