


Alaska's 55,000 earthquakes in 2018 smashed the state's previous record of 42,989. The high total was due to several vigorous aftershock sequences and earthquake swarms along with improved earthquake monitoring across the state thanks to the USArray project. For many Alaskans, these sequences faded from mind as they tapered off, but they haven't ended yet. Here's an update on five swarms and aftershock sequences we're watching, what we should expect from them, and what we still hope to learn.
We'll answer the big question first. We expect the aftershocks from the November 30 Anchorage earthquake to last about two-and-a-half years, which means they are likely to continue until around June of 2021. That's not as bad as it sounds.
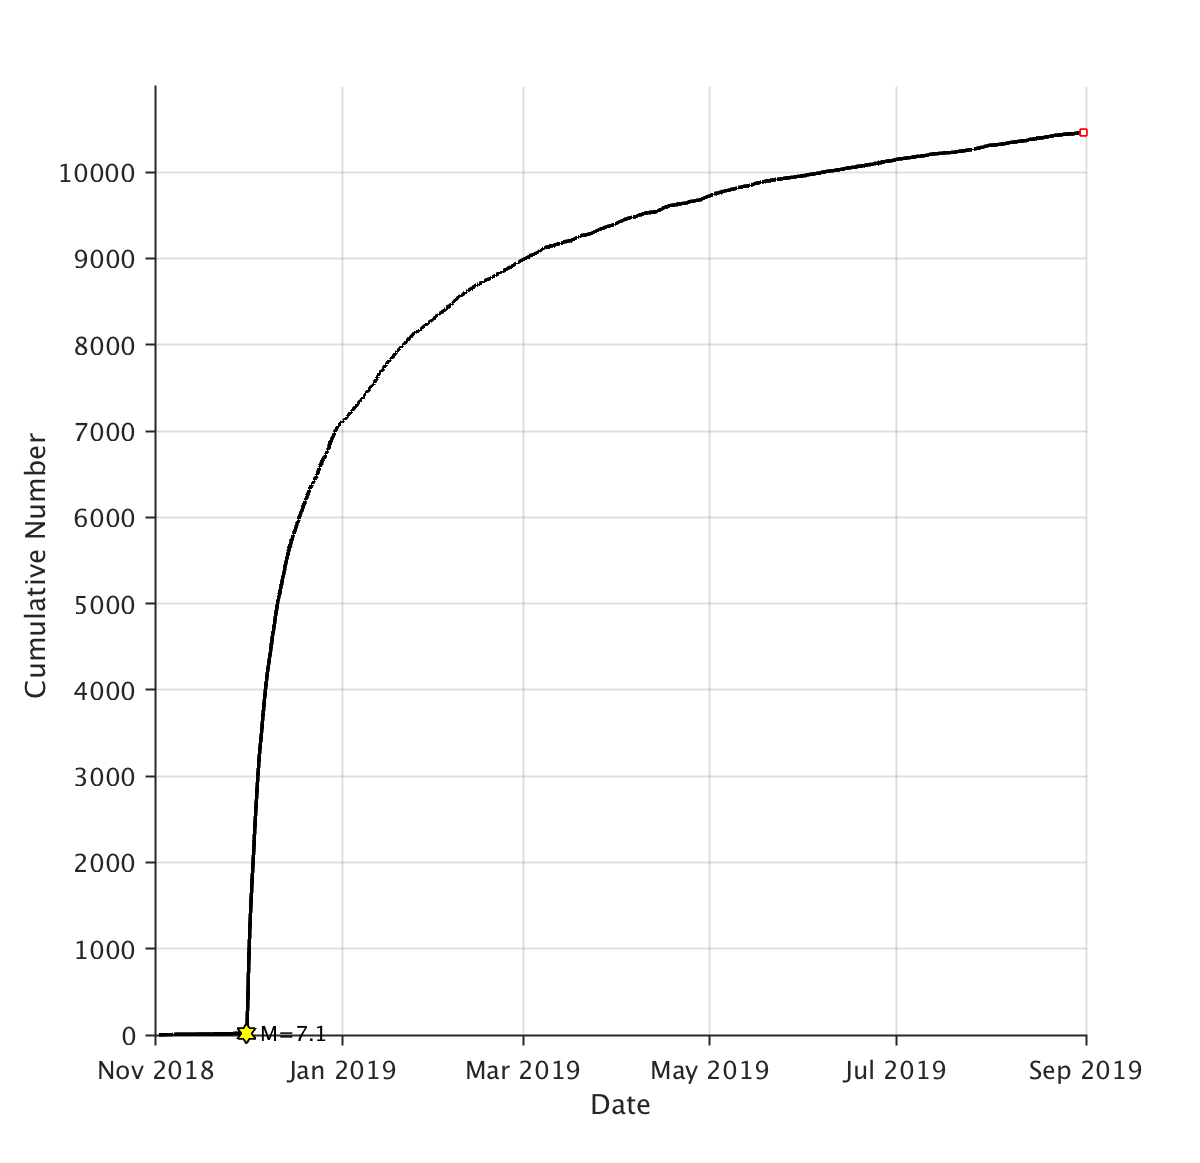
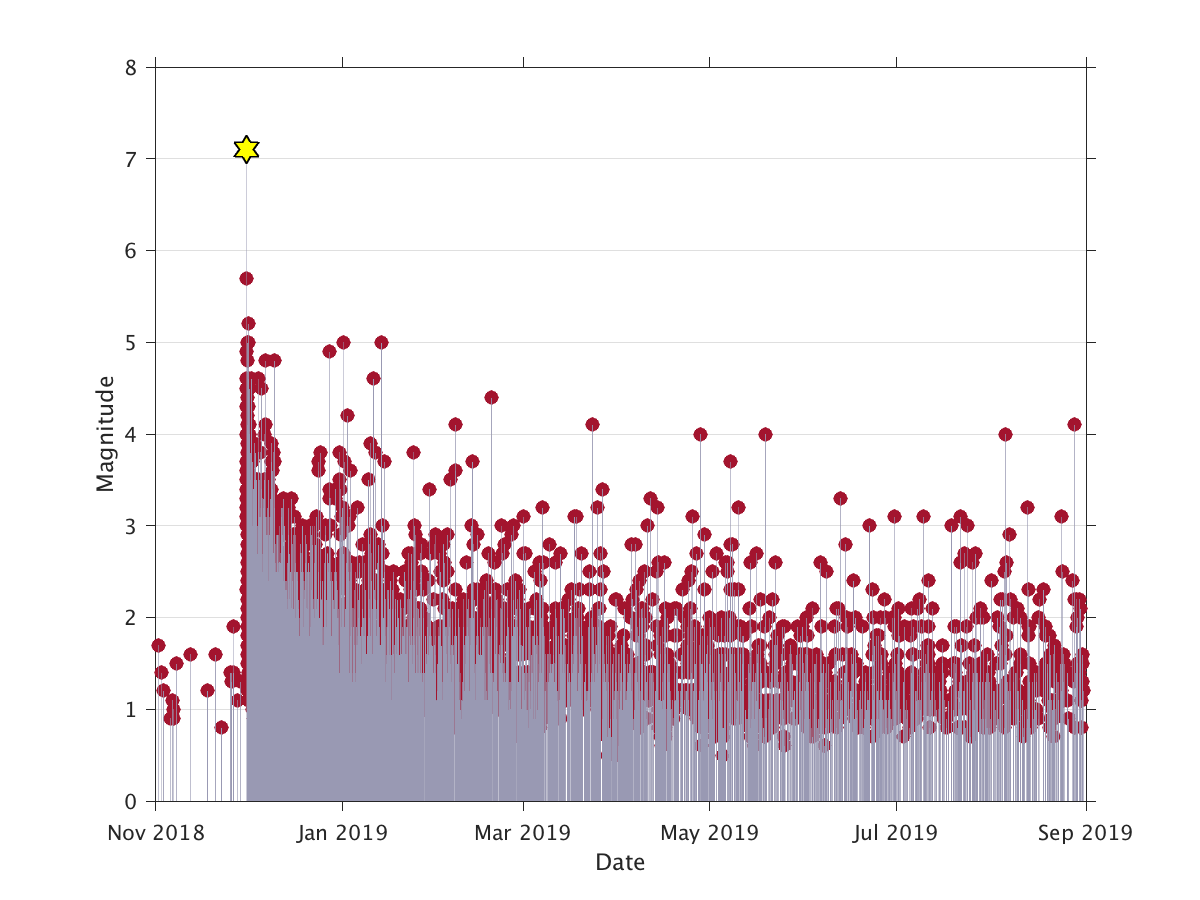
The rate of aftershocks has decreased dramatically. We've recorded 10,200 aftershocks through August, but 7,000 of those struck in the first month after the earthquake. There have been 45 aftershocks of magnitude 4 or greater, but only three since May. We haven't recorded a magnitude 5 aftershock since January 13, and magnitude 4 earthquakes are now coming weeks apart instead of days or hours.
People in Southcentral should expect to feel more aftershocks, but only infrequently. Right now, we're seeing about half a dozen Anchorage aftershocks per day, and most are far too small to feel. Our station coverage is very good in that area, so we can reliably record aftershocks down to magnitude 1.2. We're recording many aftershocks smaller than magnitude 1 as well.
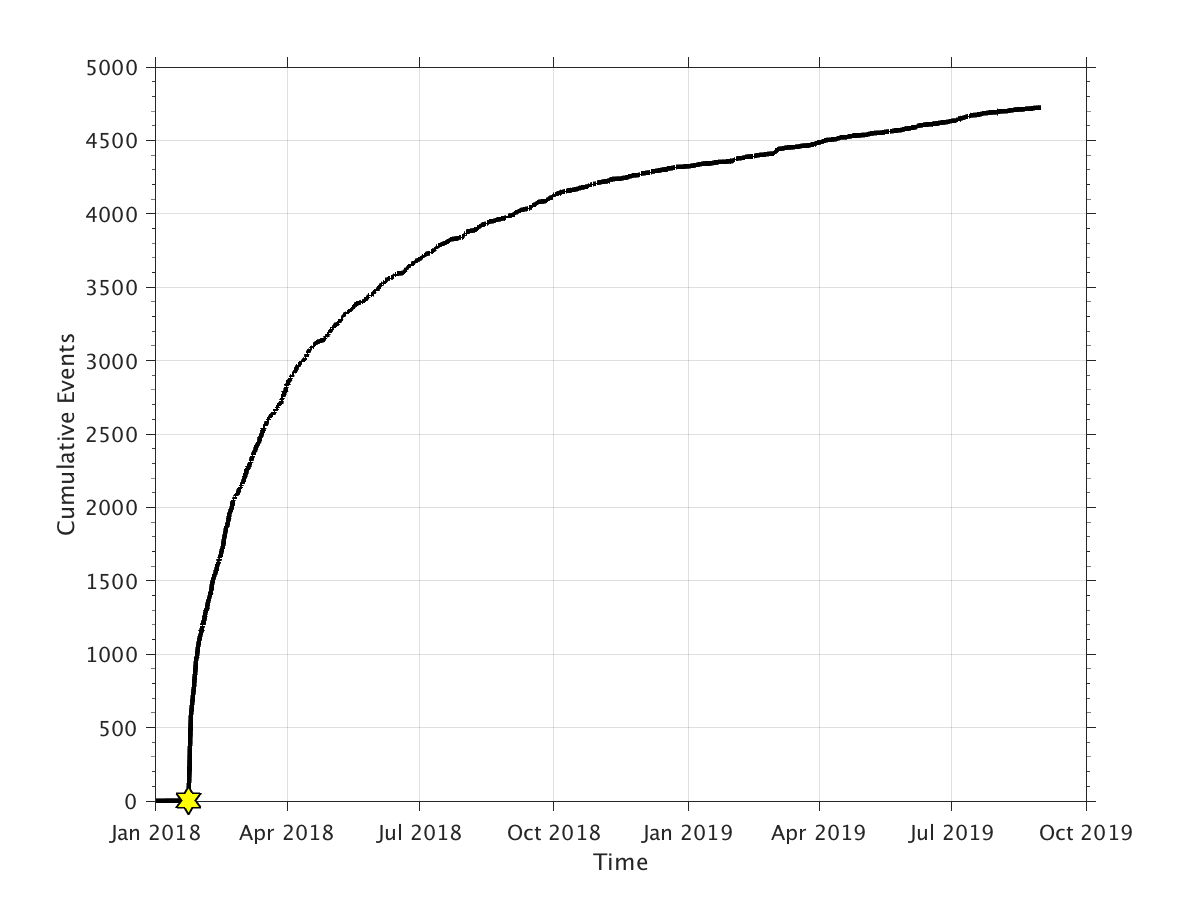
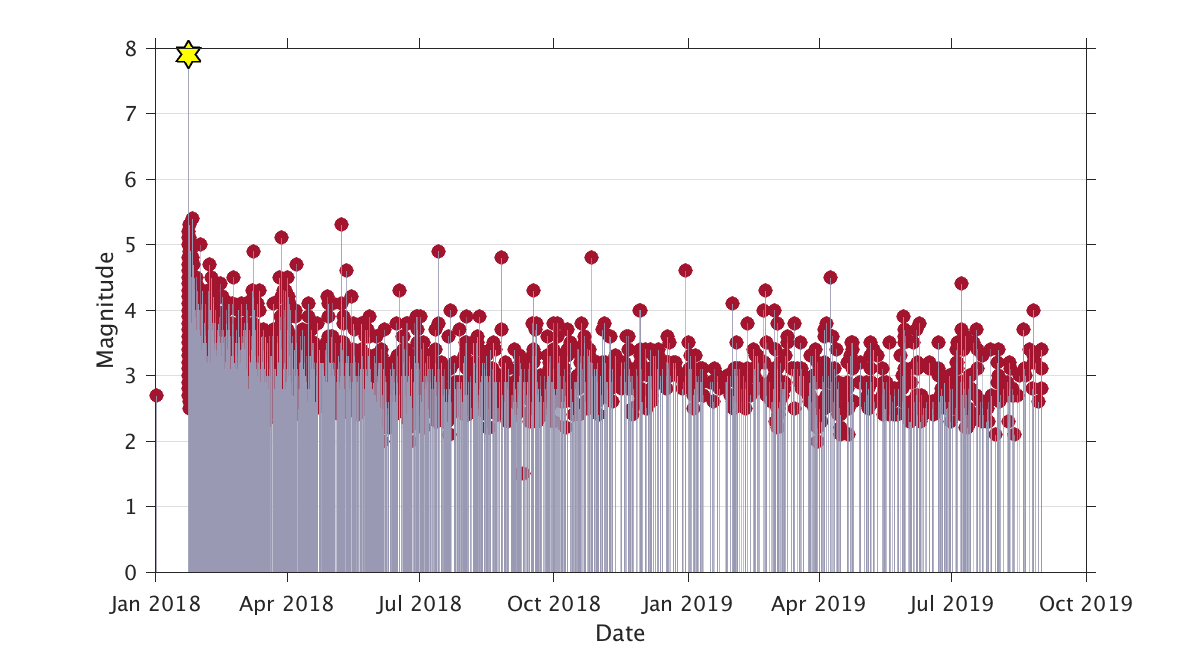
The Offshore Kodiak earthquake on January 23, 2018 was overshadowed by the Anchorage earthquake, but it was a big deal at the time. Its tsunami proved to be too small to be dangerous, but the tsunami warnings and evacuations were an important test of coastal Alaska's preparedness.
We've recorded 4,725 aftershocks from this sequence, but that number is misleading. Because the rupture zone is so far offshore, we can only reliably record aftershocks down to around magnitude 3. A better indicator of the strength of the sequence is that we've recorded about 140 aftershocks of magnitude 4 or greater, more than triple the number of M4+ Anchorage aftershocks. The most recent Offshore Kodiak magnitude 4 aftershock was on August 25.
Fortunately, the Alaska Amphibious Community Seismic Experiment is retrieving ocean-bottom seismometers from the Offshore Kodiak rupture zone right now. These instruments record and store data rather than transmitting it in real time, like our land-based stations do. We hope the data from the ocean-bottom instruments will allow us to locate many more aftershocks, which should greatly improve our understanding of the complex network of faults that ruptured during this earthquake.
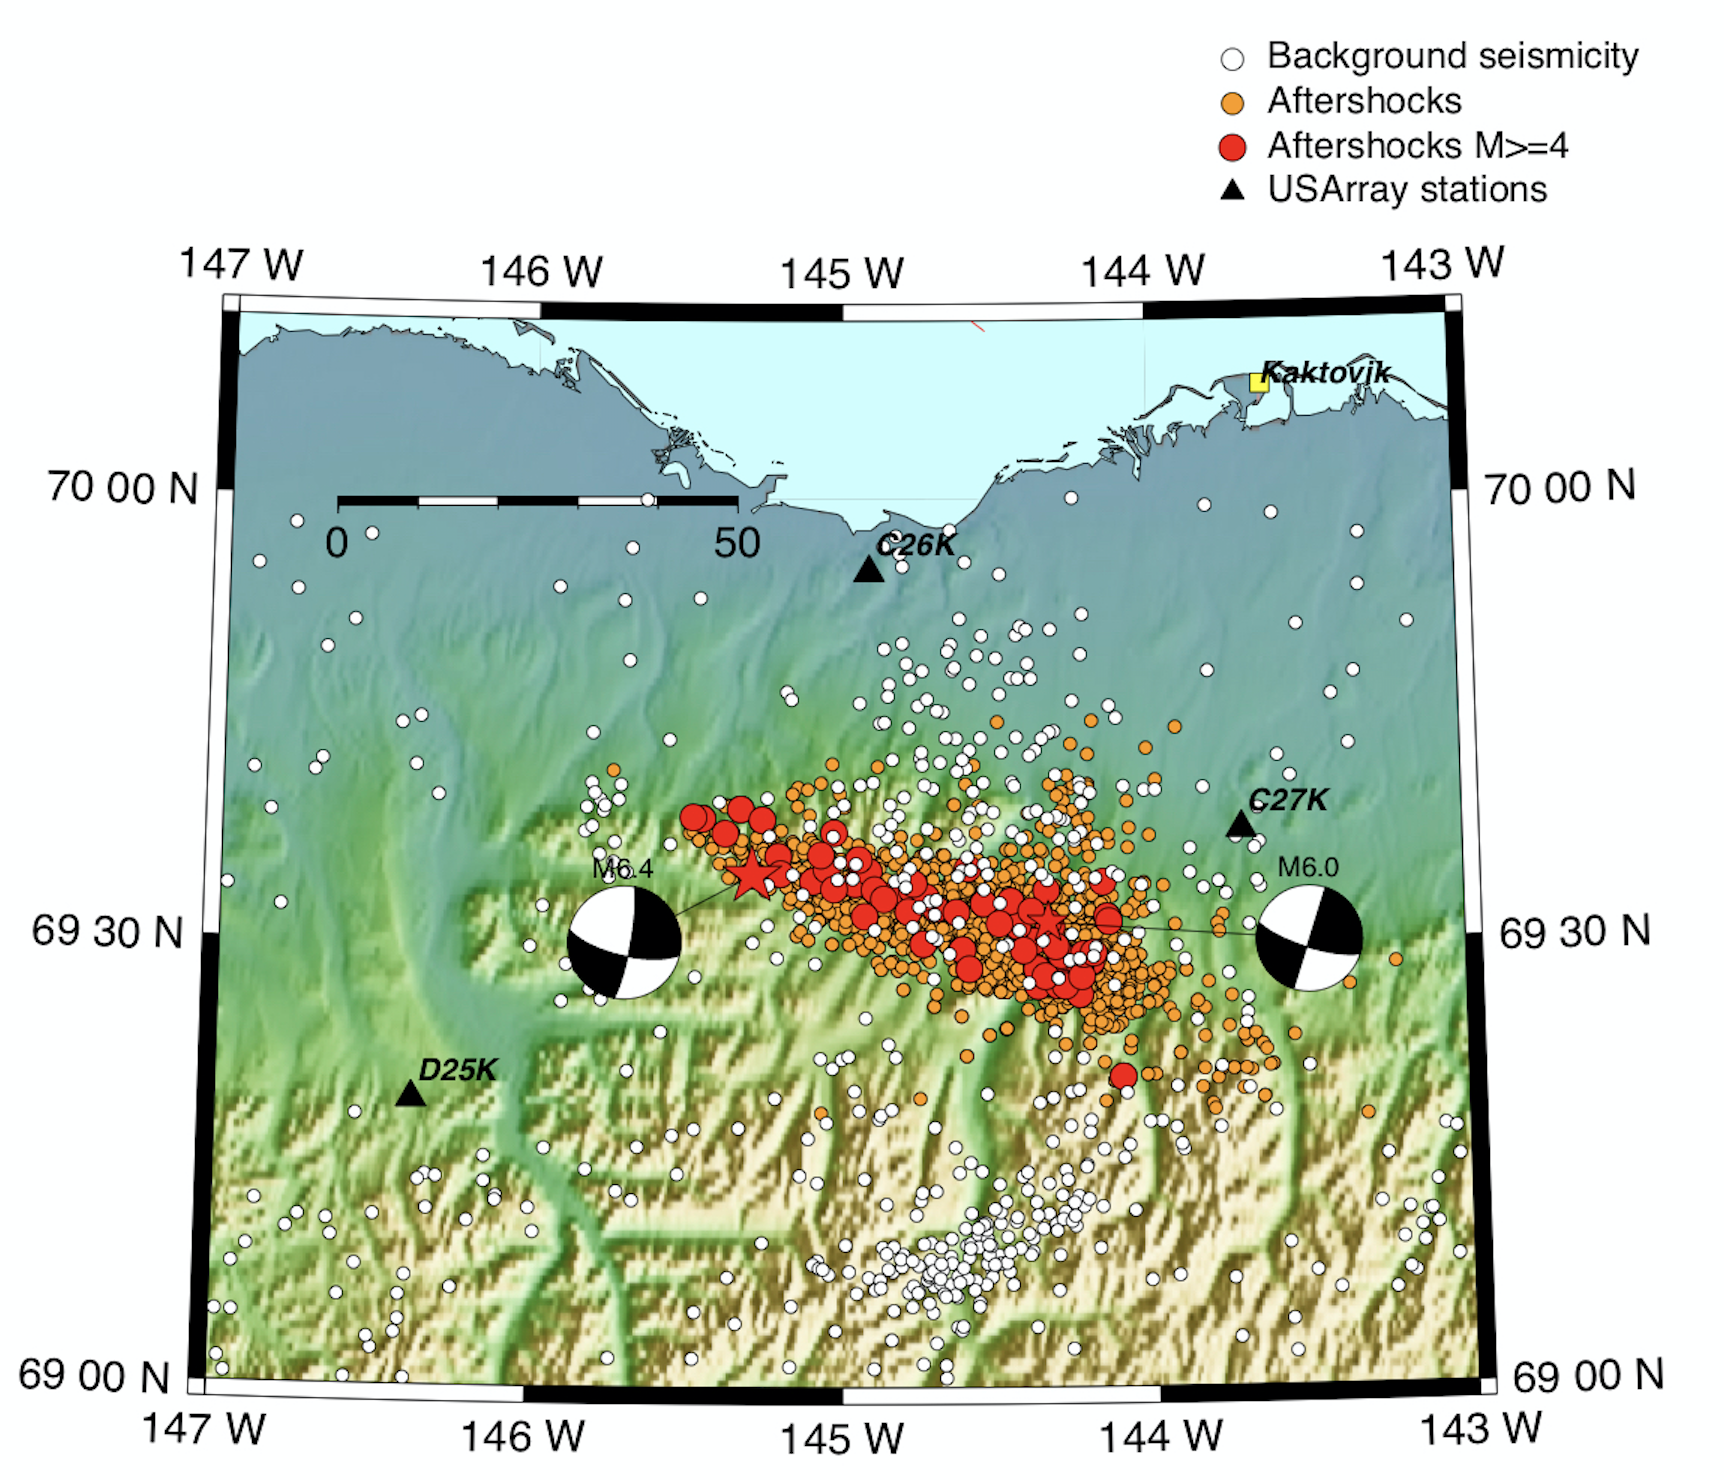
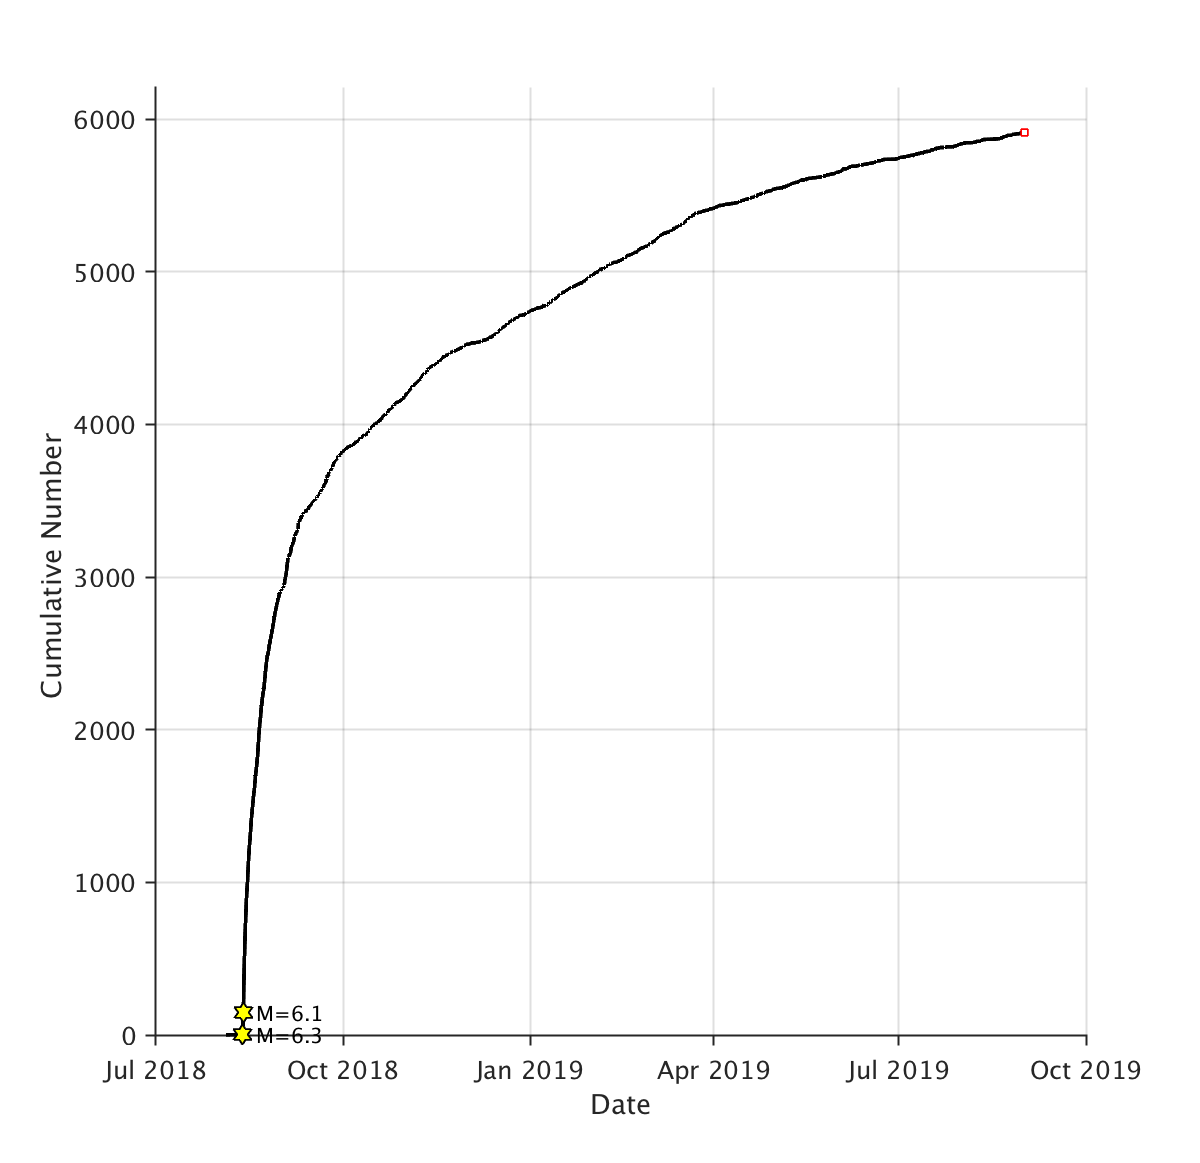
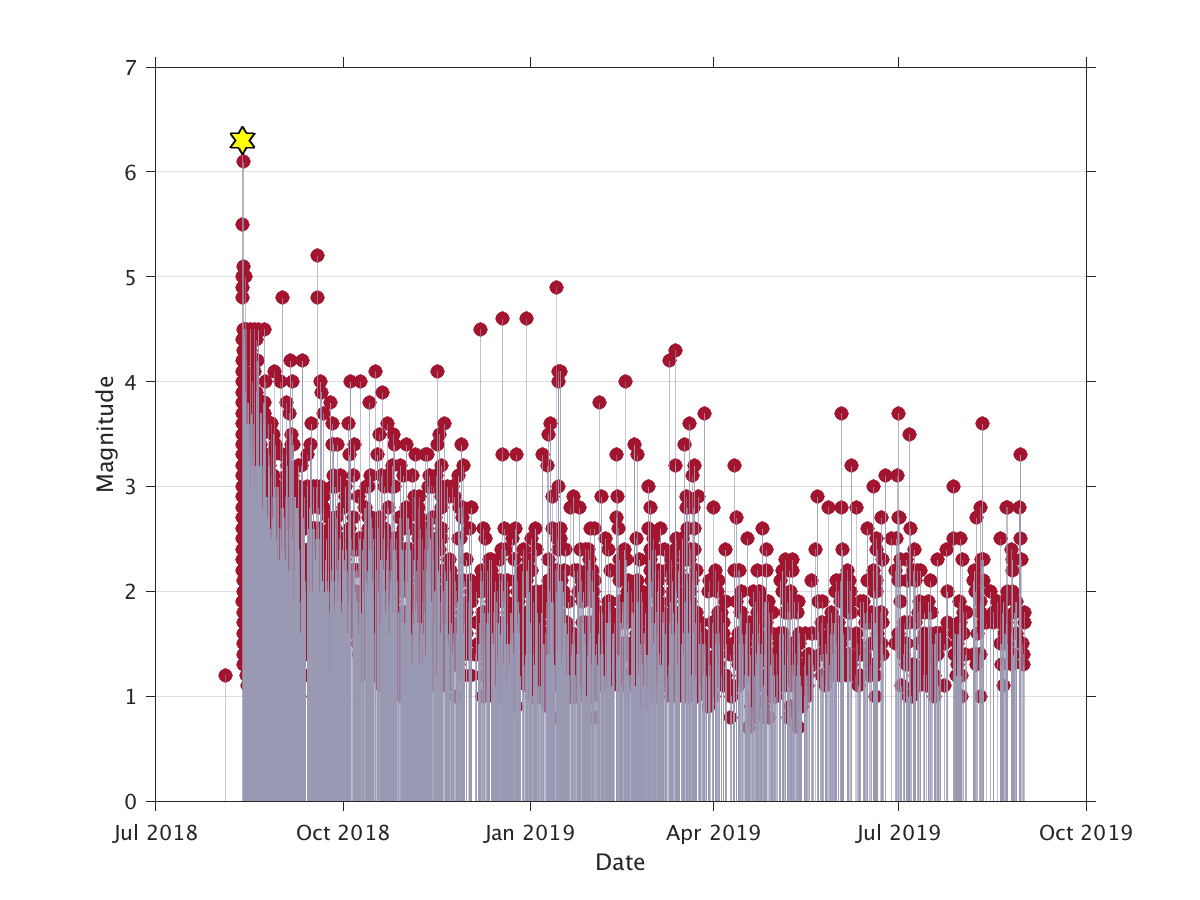
The August 12 2018 magnitude 6.4 Kaktovik earthquake was the largest ever recorded north of the Brooks Range. Thanks to the USArray stations installed in the area since 2016, we can record aftershocks down to around magnitude 1, which is critical for studying the sequence. Had this earthquake happened before the USArray project, the nearest station would have been more than 100 miles away, so we would have had far less information. In fact, without the USArray stations, it's likely that we would have missed everything smaller than magnitdue 2.5. We've recorded nearly 6,000 Kaktovik aftershock so far.
There have been about 70 aftershocks of magnitude 4 or greater, but most occurred within a few weeks of the mainshock. The most recent was on March 13. Unfortunately we cannot accurately estimate how long the Kaktovik sequence will last. To estimate duration, we would need to know the background seismicity rate, which we can't establish due to the very sparse monitoring in northern Alaska prior to the USArray project.
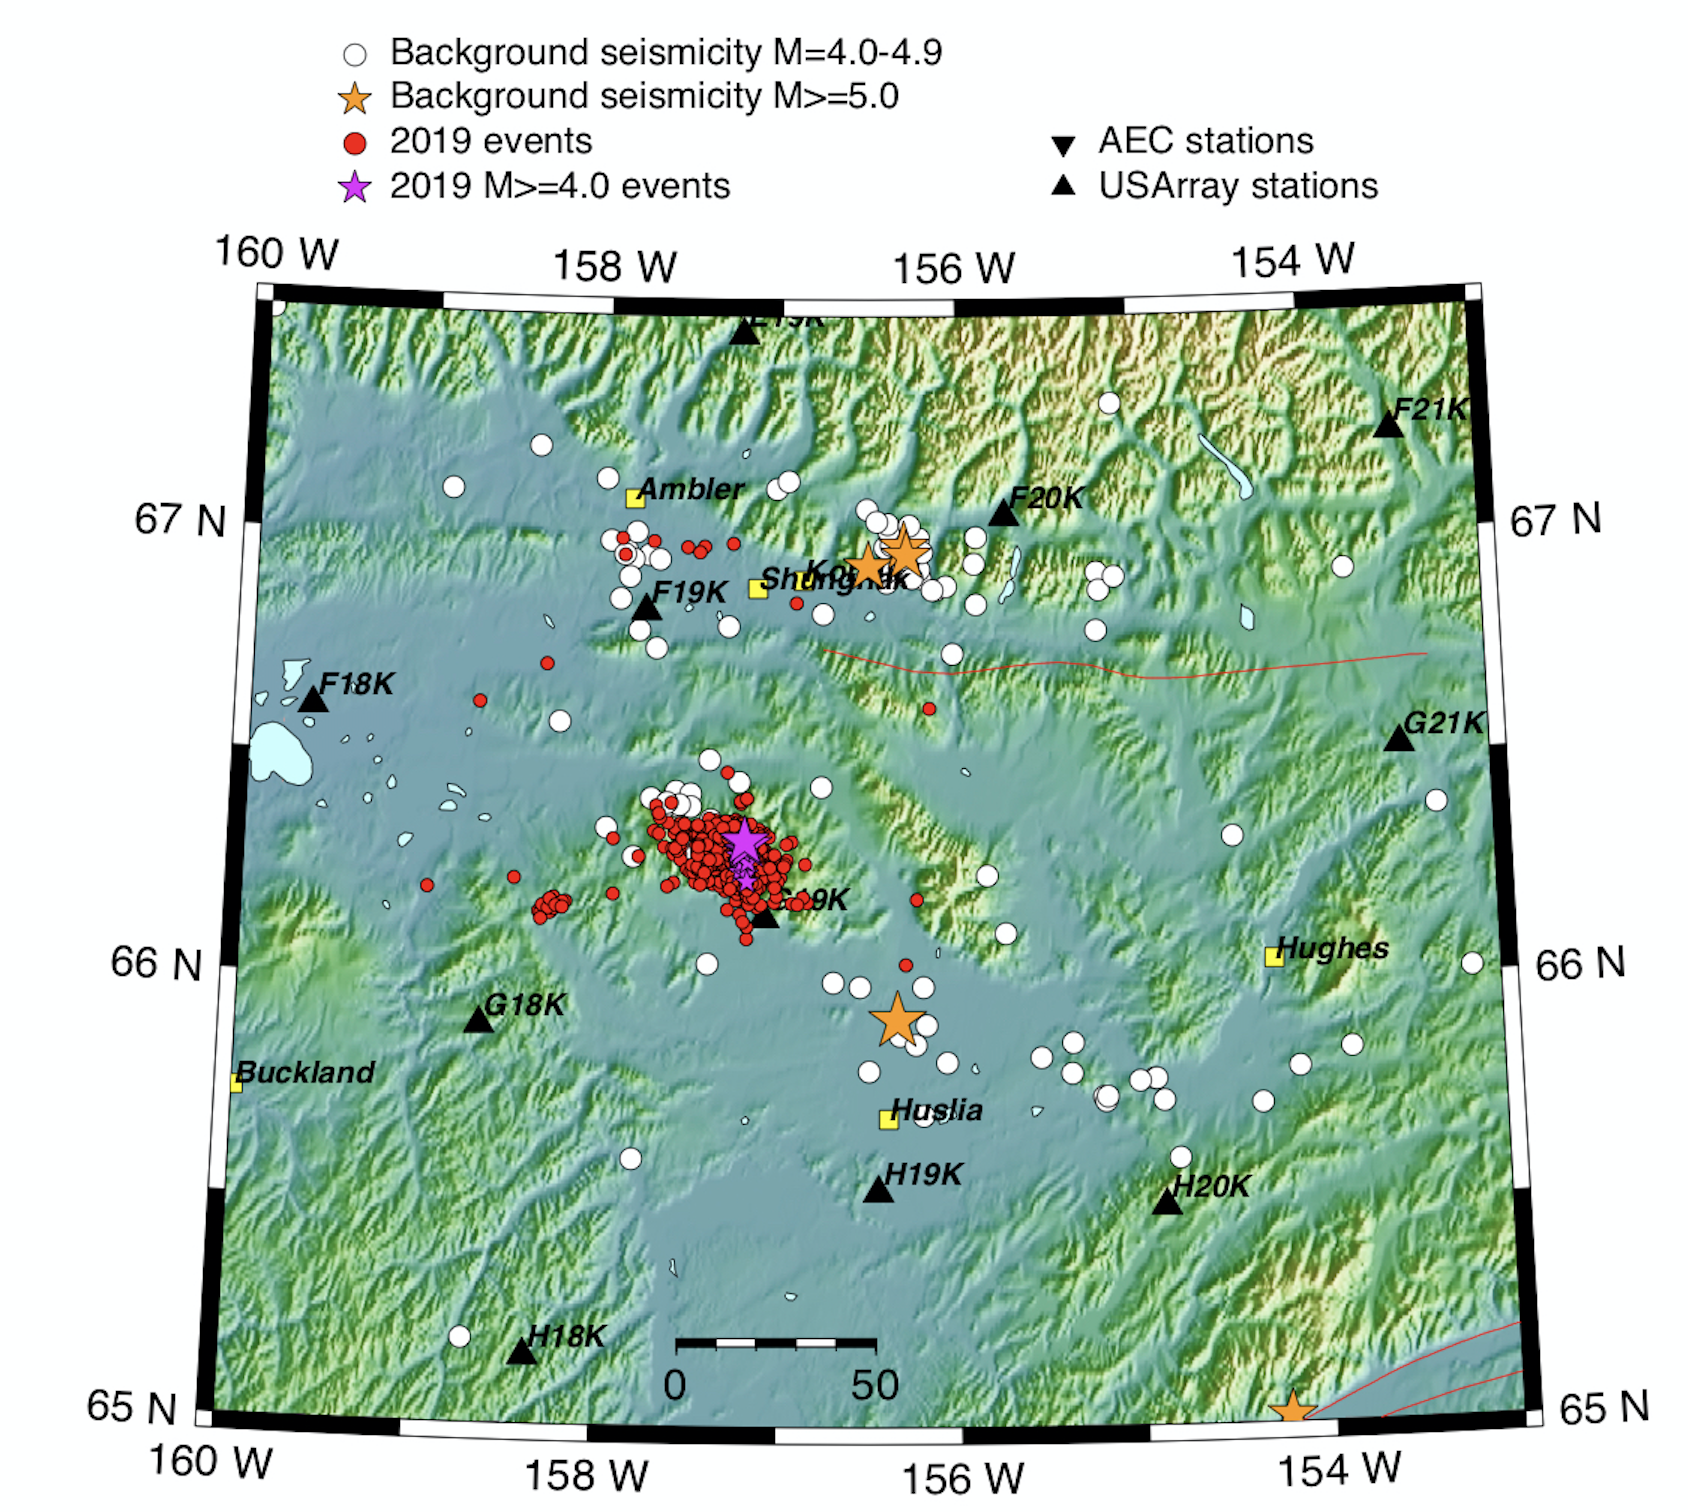
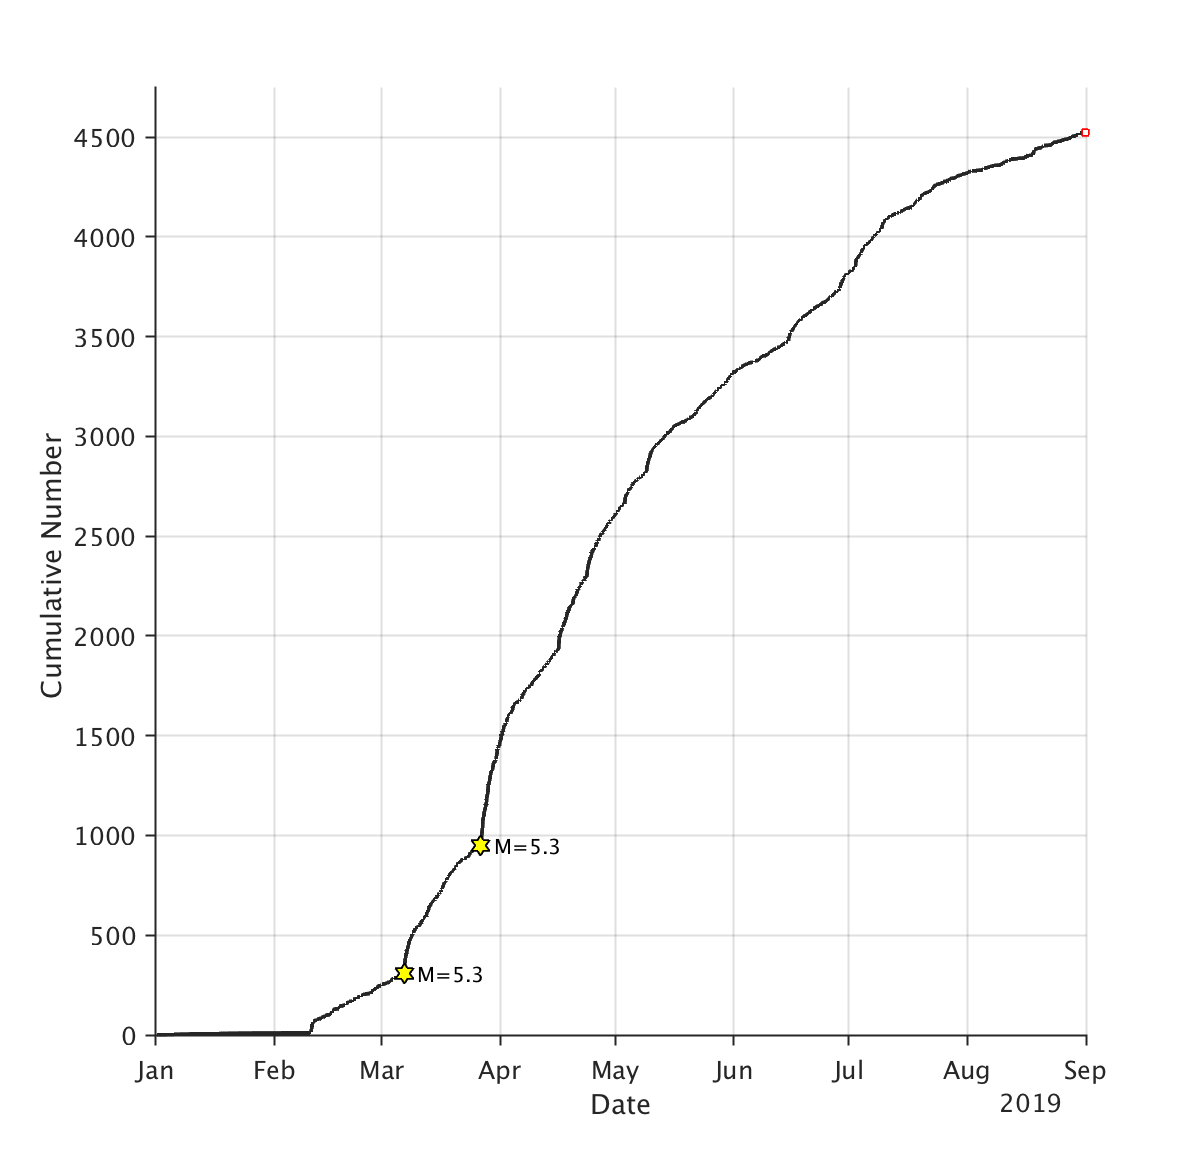
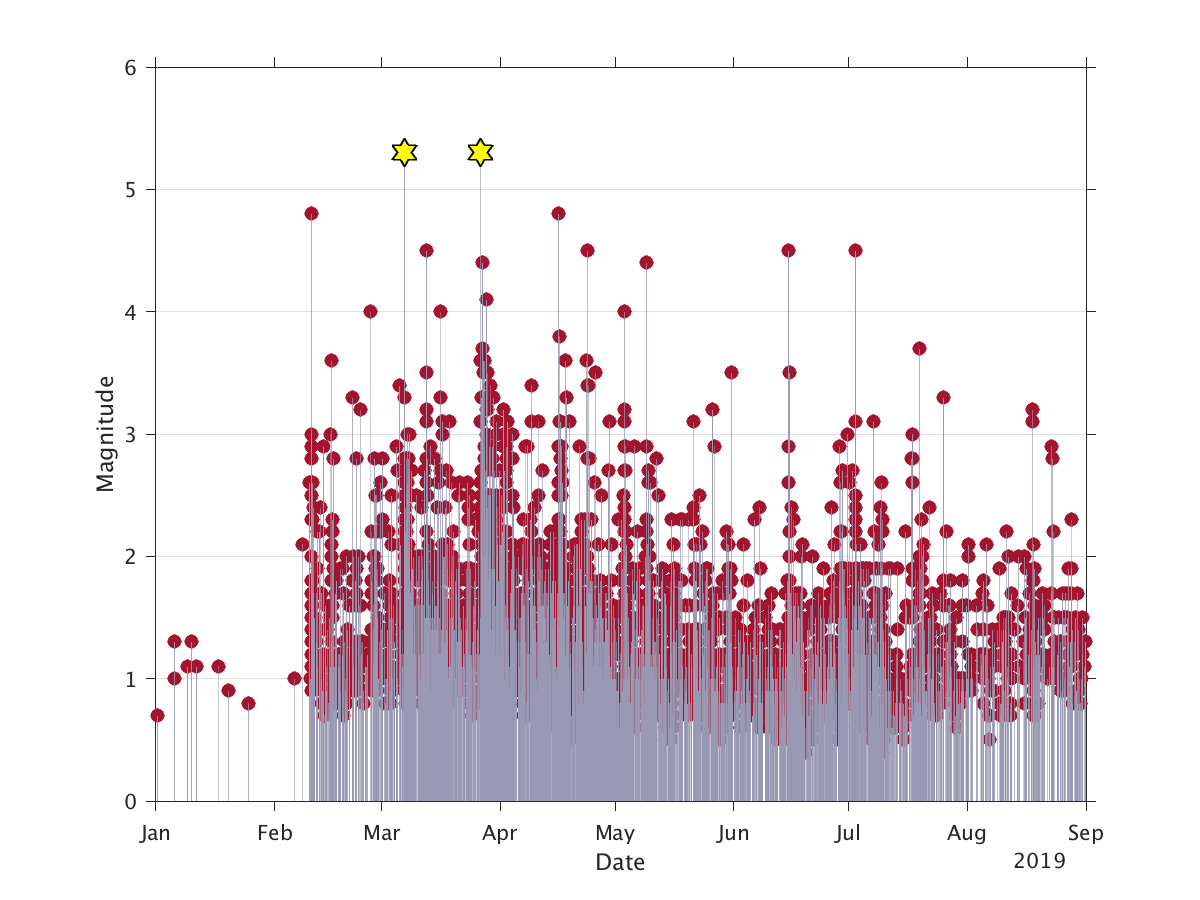
A vigorous earthquake swarm began in mid-February 2019 in the Purcell Mountains, roughly between Shungnak and Huslia in Western Alaska. This swarm was at its most active in March and April, when we recorded about 40 earthquakes per day. The largest was a pair of M5.3 earthquakes on March 6 and March 26. There were 11 quakes with magnitudes from 4.0-4.8, with the most recent magnitude 4 event occurring on July 2.
Altogether we've recorded about 4,500 earthquakes in this swarm. The strongest were felt throughout the region, with reports from as far away as Fairbanks and Nulato. The swarm has slowed considerably, and we're now recording only around a dozen earthquakes in the Purcell Mountains each day.
Earthquakes in the swarm have exhibited either normal or strike-slip faulting, but we have not yet studied this sequence closely. Preexisting knowledge of the area is limited. Before the installation of the Transportable Array stations, we could only reliably detect earthquakes in this area down to around magnitude 2.5, and no active faults have been mapped in the area.
The most intersting sequence could be the one that has garnered the least attention. Anchorage, Kodiak, and Kaktovik are all textbook mainshock-aftershock sequences. The Purcell Mountains swarm resembles the 2014 Noatak swarm but has been less intense. The eastern Brooks Range swarm, on the other hand, is not quite like anything we've seen before.
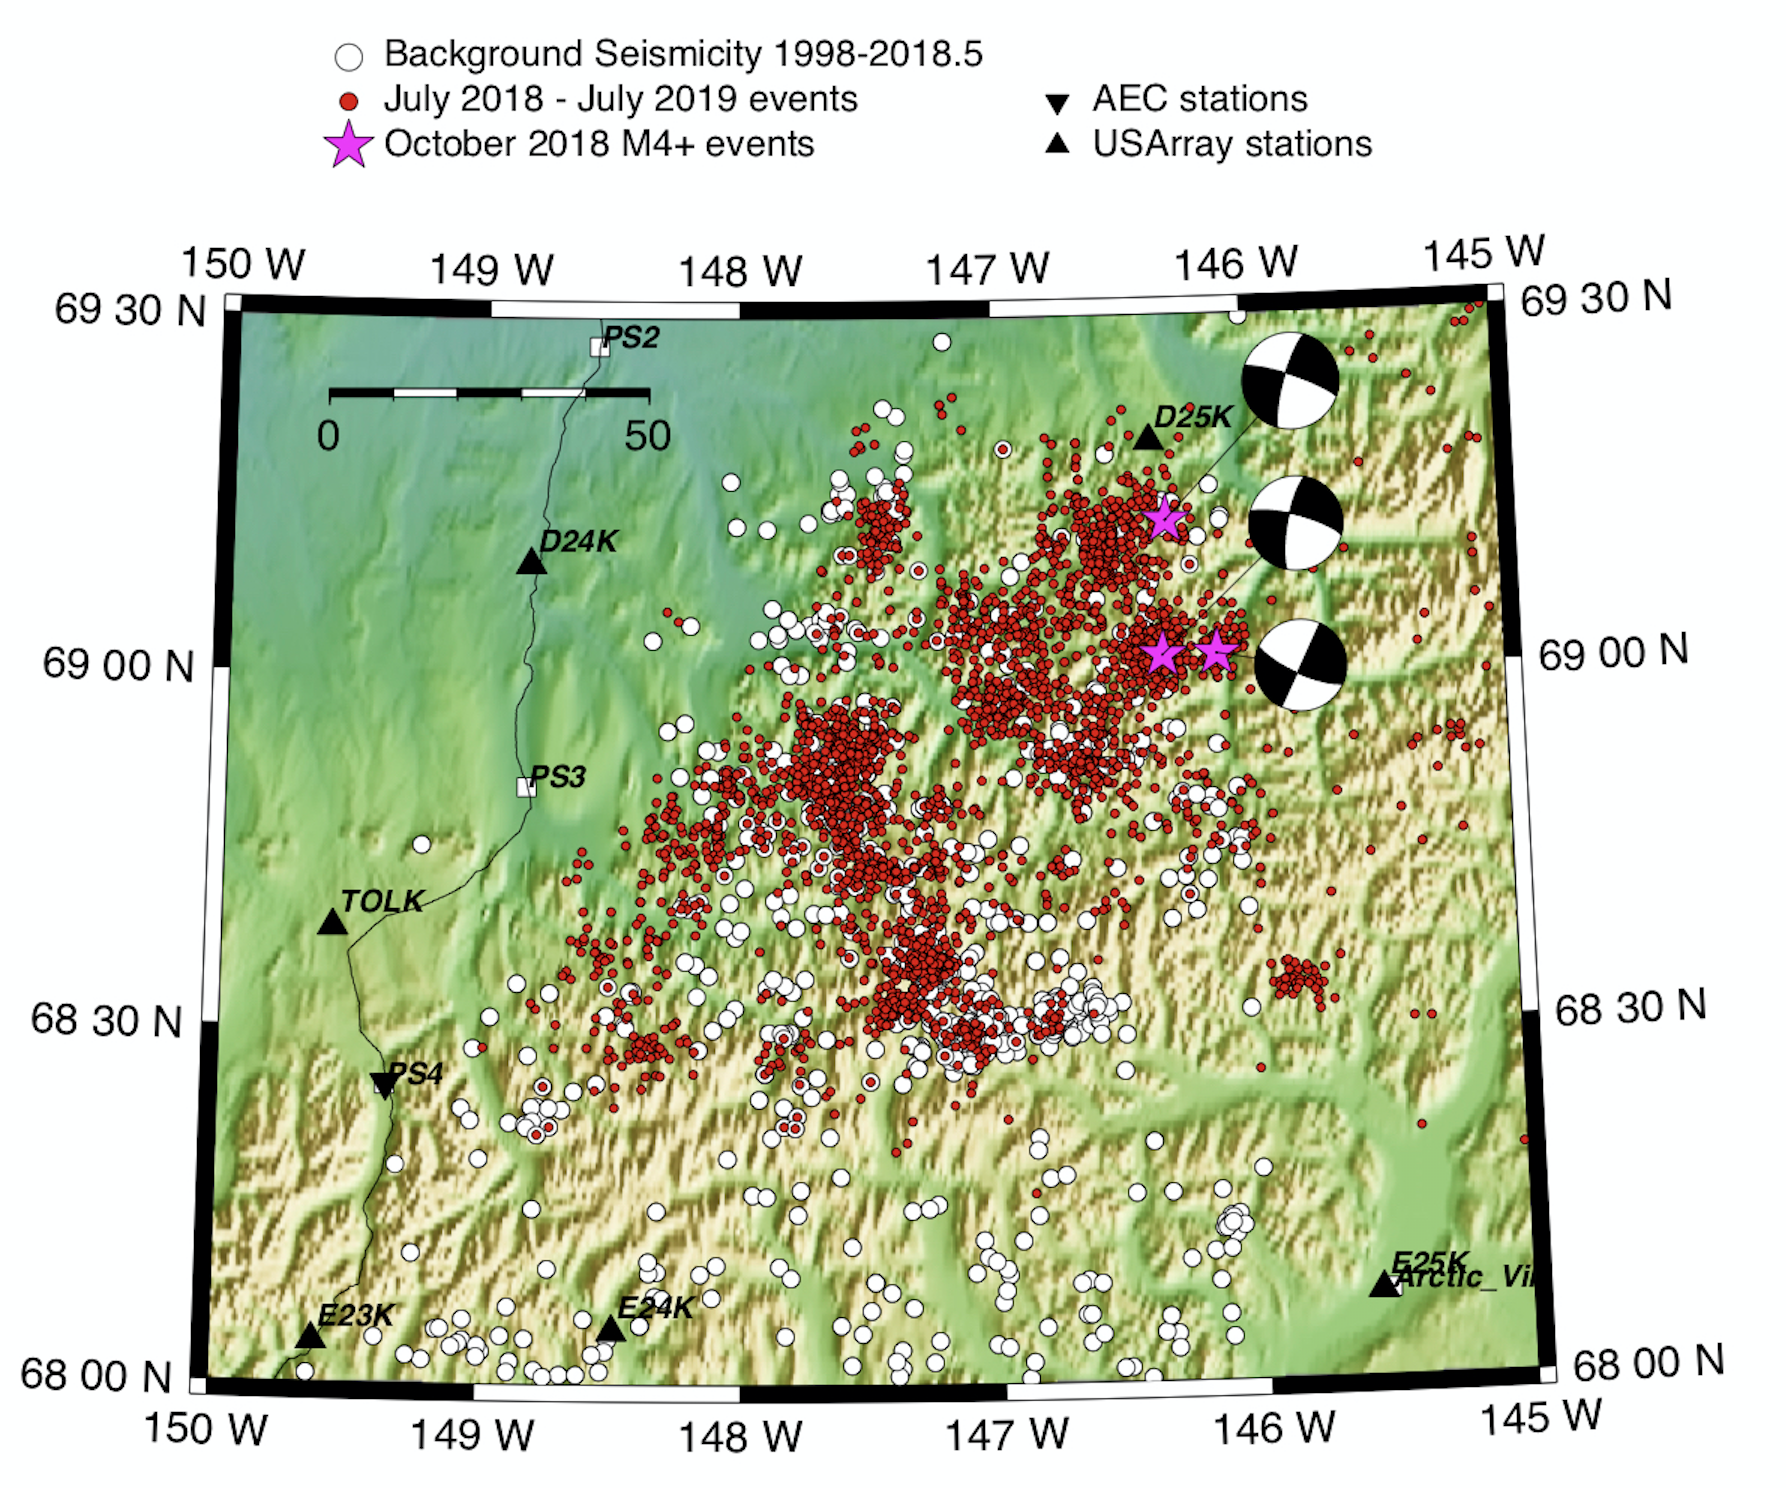
The sequence began in July 2018, when the rate of earthquakes in the eastern Brooks Range increased from 1-2 events per week to around 30 per day. Most were very small—once again, the Transportable Array stations allow us to record earthquakes here down to around magnitude 1—and only a few were as large as magnitude 4. The swarm remained very active from July 2018 until October but then eased off, with only a few earthquakes per day for the next eight months.
Here's where it gets interesting. In late July of 2019, the swarm picked up again suddenly. Right now, it's about as active as it was in August of 2018. All of this has been happening over an unusually large area. Most swarms are not larger than 20 or so kilometers across. The eastern Brooks Range swarm covers an area about 70km by 100km.
We've recorded more than 3,100 earthquakes in this swarm, but the cause remains unclear. There are no active mapped faults in the area (see DGGS fault map) and there is no extensive glaciation. Because there were so few seismic stations in the Brooks Range before 2016, it is hard to say if this swarm is the first of its kind in the region. We did record some swarm-like activity in 2016 and 2017, but nothing comparable to this one.
The earthquakes exhibit strike-slip faulting, either right-lateral on east-west trending faults (similar to the The Tintina and Denali faults and the Kaktovik sequence), or left-lateral on north-south trending faults (consistent with other Interior Alaska seismic zones). Due to the recent uptick in activity, we'll be keeping a close eye on the sequence. The USArray stations are invaluable for this, as we now have a seismic record with unprecedented resolution and completeness for the Brooks Range.