The history of earthquake-like signals created by the crashing of glacial ice into the ocean can reveal how a glacier has changed over time, according to research by a University of Alaska Fairbanks team.
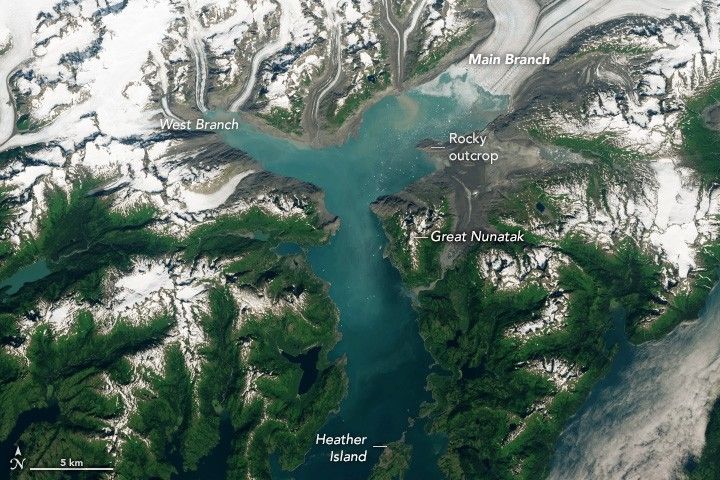
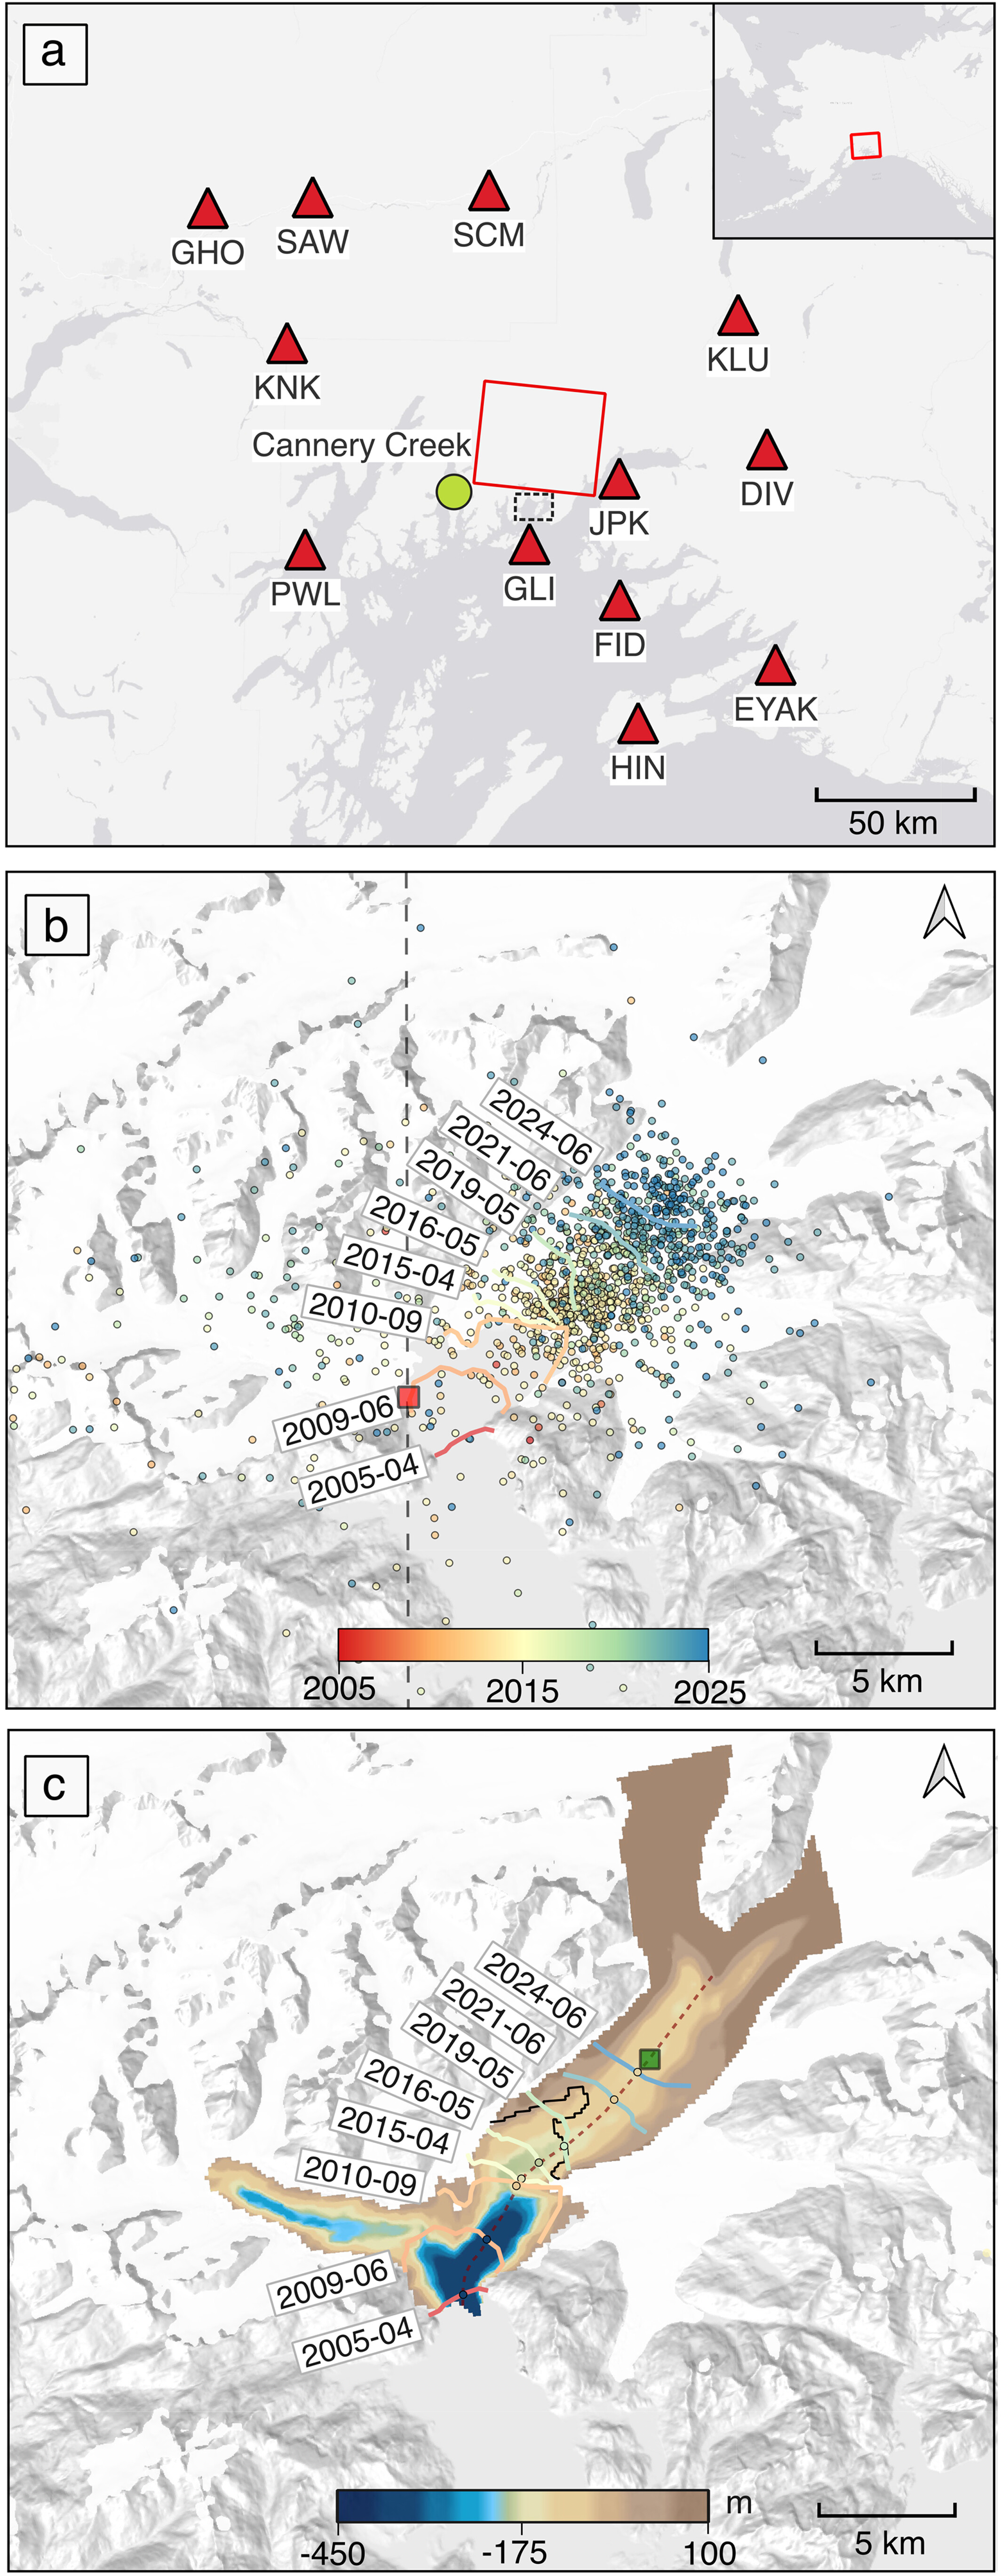
Their study focused on Alaska’s Columbia Glacier, which flows into Prince William Sound and is one of the state’s fastest-retreating glaciers (Figures 1 and 2). The researchers reviewed a catalog of about 16,000 seismic events from two dozen Alaska glaciers, including Columbia.
The Alaska Earthquake Center has recorded these glacier-related seismic events for decades as part of its routine earthquake monitoring.
The team analyzed 20 years of Columbia Glacier’s seismic activity to learn what these signals can reveal about changes in the glacier and the conditions that drive them. The glacier has been retreating since the early 1980s after approximately 200 years of stability.
The findings were published March 22 in Geophysical Research Letters.
Doctoral student Sebin John of the UAF Geophysical Institute is the lead author. Co-authors include Alaska Earthquake Center Director Michael West and physics professor Martin Truffer of the Geophysical Institute and UAF College of Natural Science and Mathematics.
“We can look at long-term trends across many glaciers and gain valuable insights into climate change and its effects in Alaska,” John said.
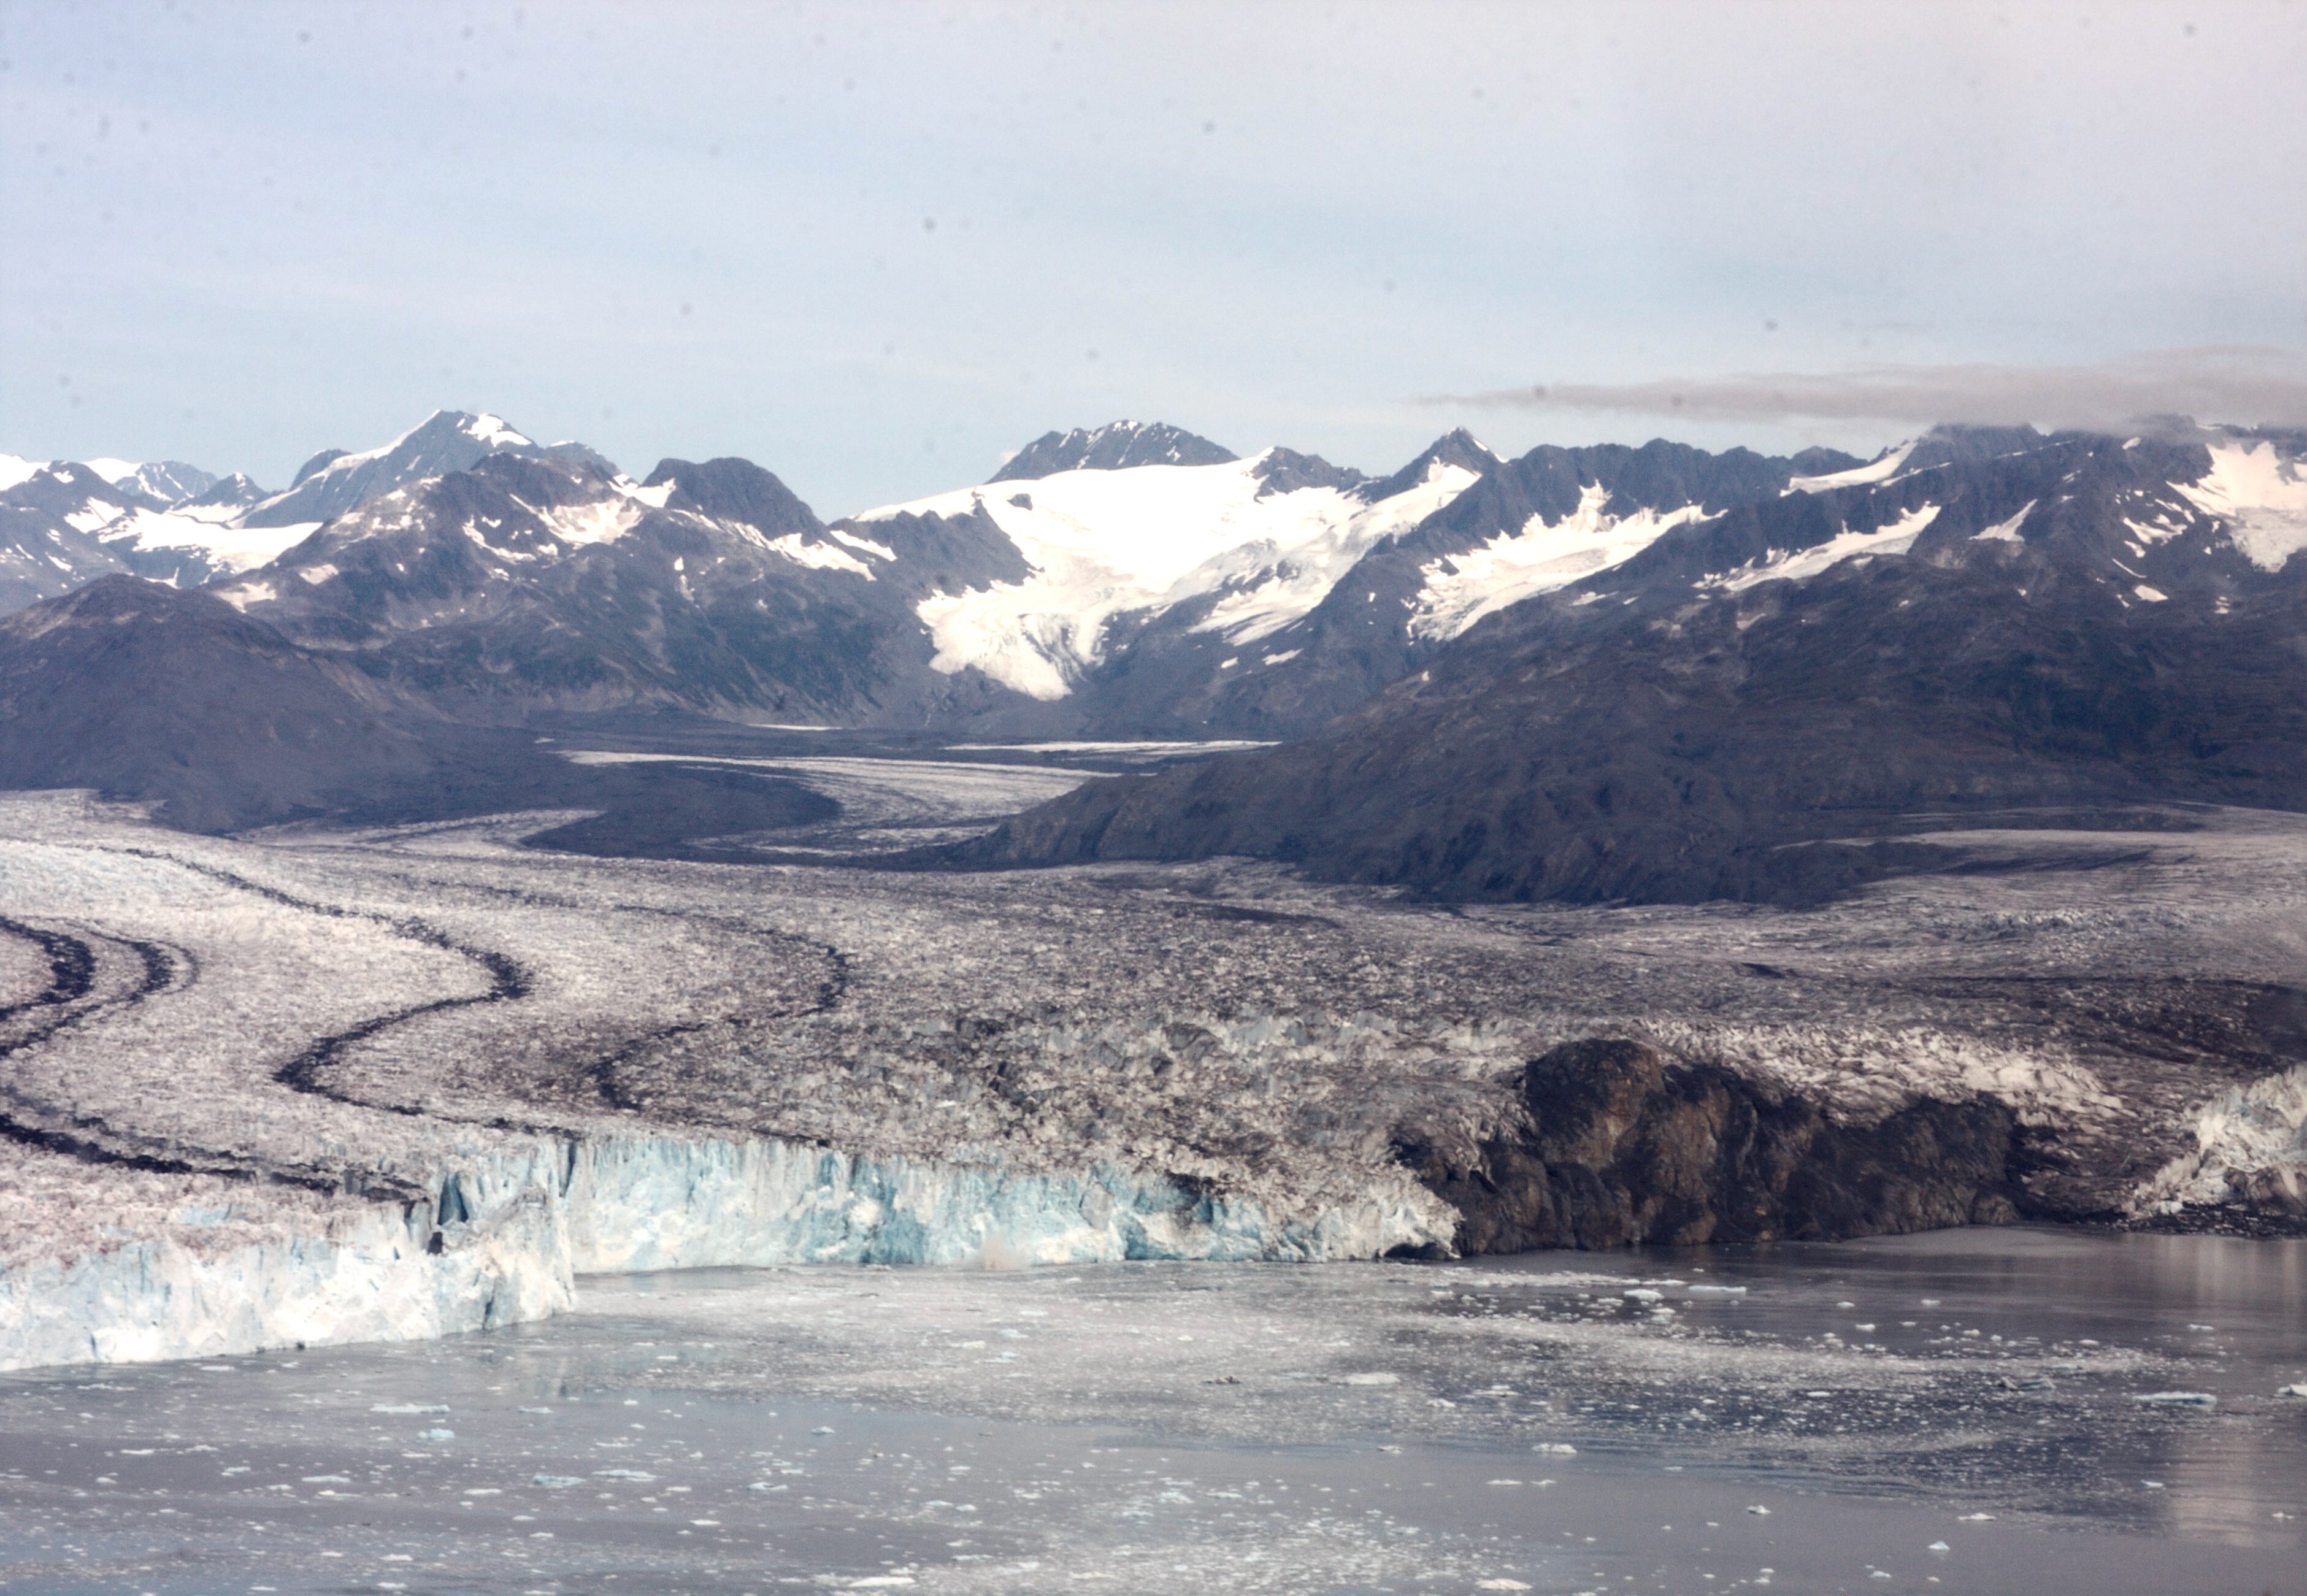
Glacier calving, when chunks of ice break off and fall into the water, causes most glacier quakes. The largest events can be detected hundreds of kilometers away.
The researchers found several links between seismic activity and glacier conditions.
One factor is glacier thickness. Columbia Glacier was about 100-115 feet (30 to 35 meters) thicker in the 2010s than in the 2020s. When the glacier was thicker, pieces of ice that broke off had farther to fall, producing stronger seismic signals.
They also found that rising sea surface temperature and increased precipitation correspond with more glacier quakes.
“If the ocean is warmer and the glacier sits in the water, it can melt the glacier from below,” John said. “Heavy rainfall can also send water through the glacier and into the ocean, which helps undercut the ice.”
The frequency of calving also tracked changes in how fast the glacier moved. After 2018, Columbia Glacier sped up.
“That matches the steady rise in seismic activity,” John said. “More ice was moving through the front of the glacier.”
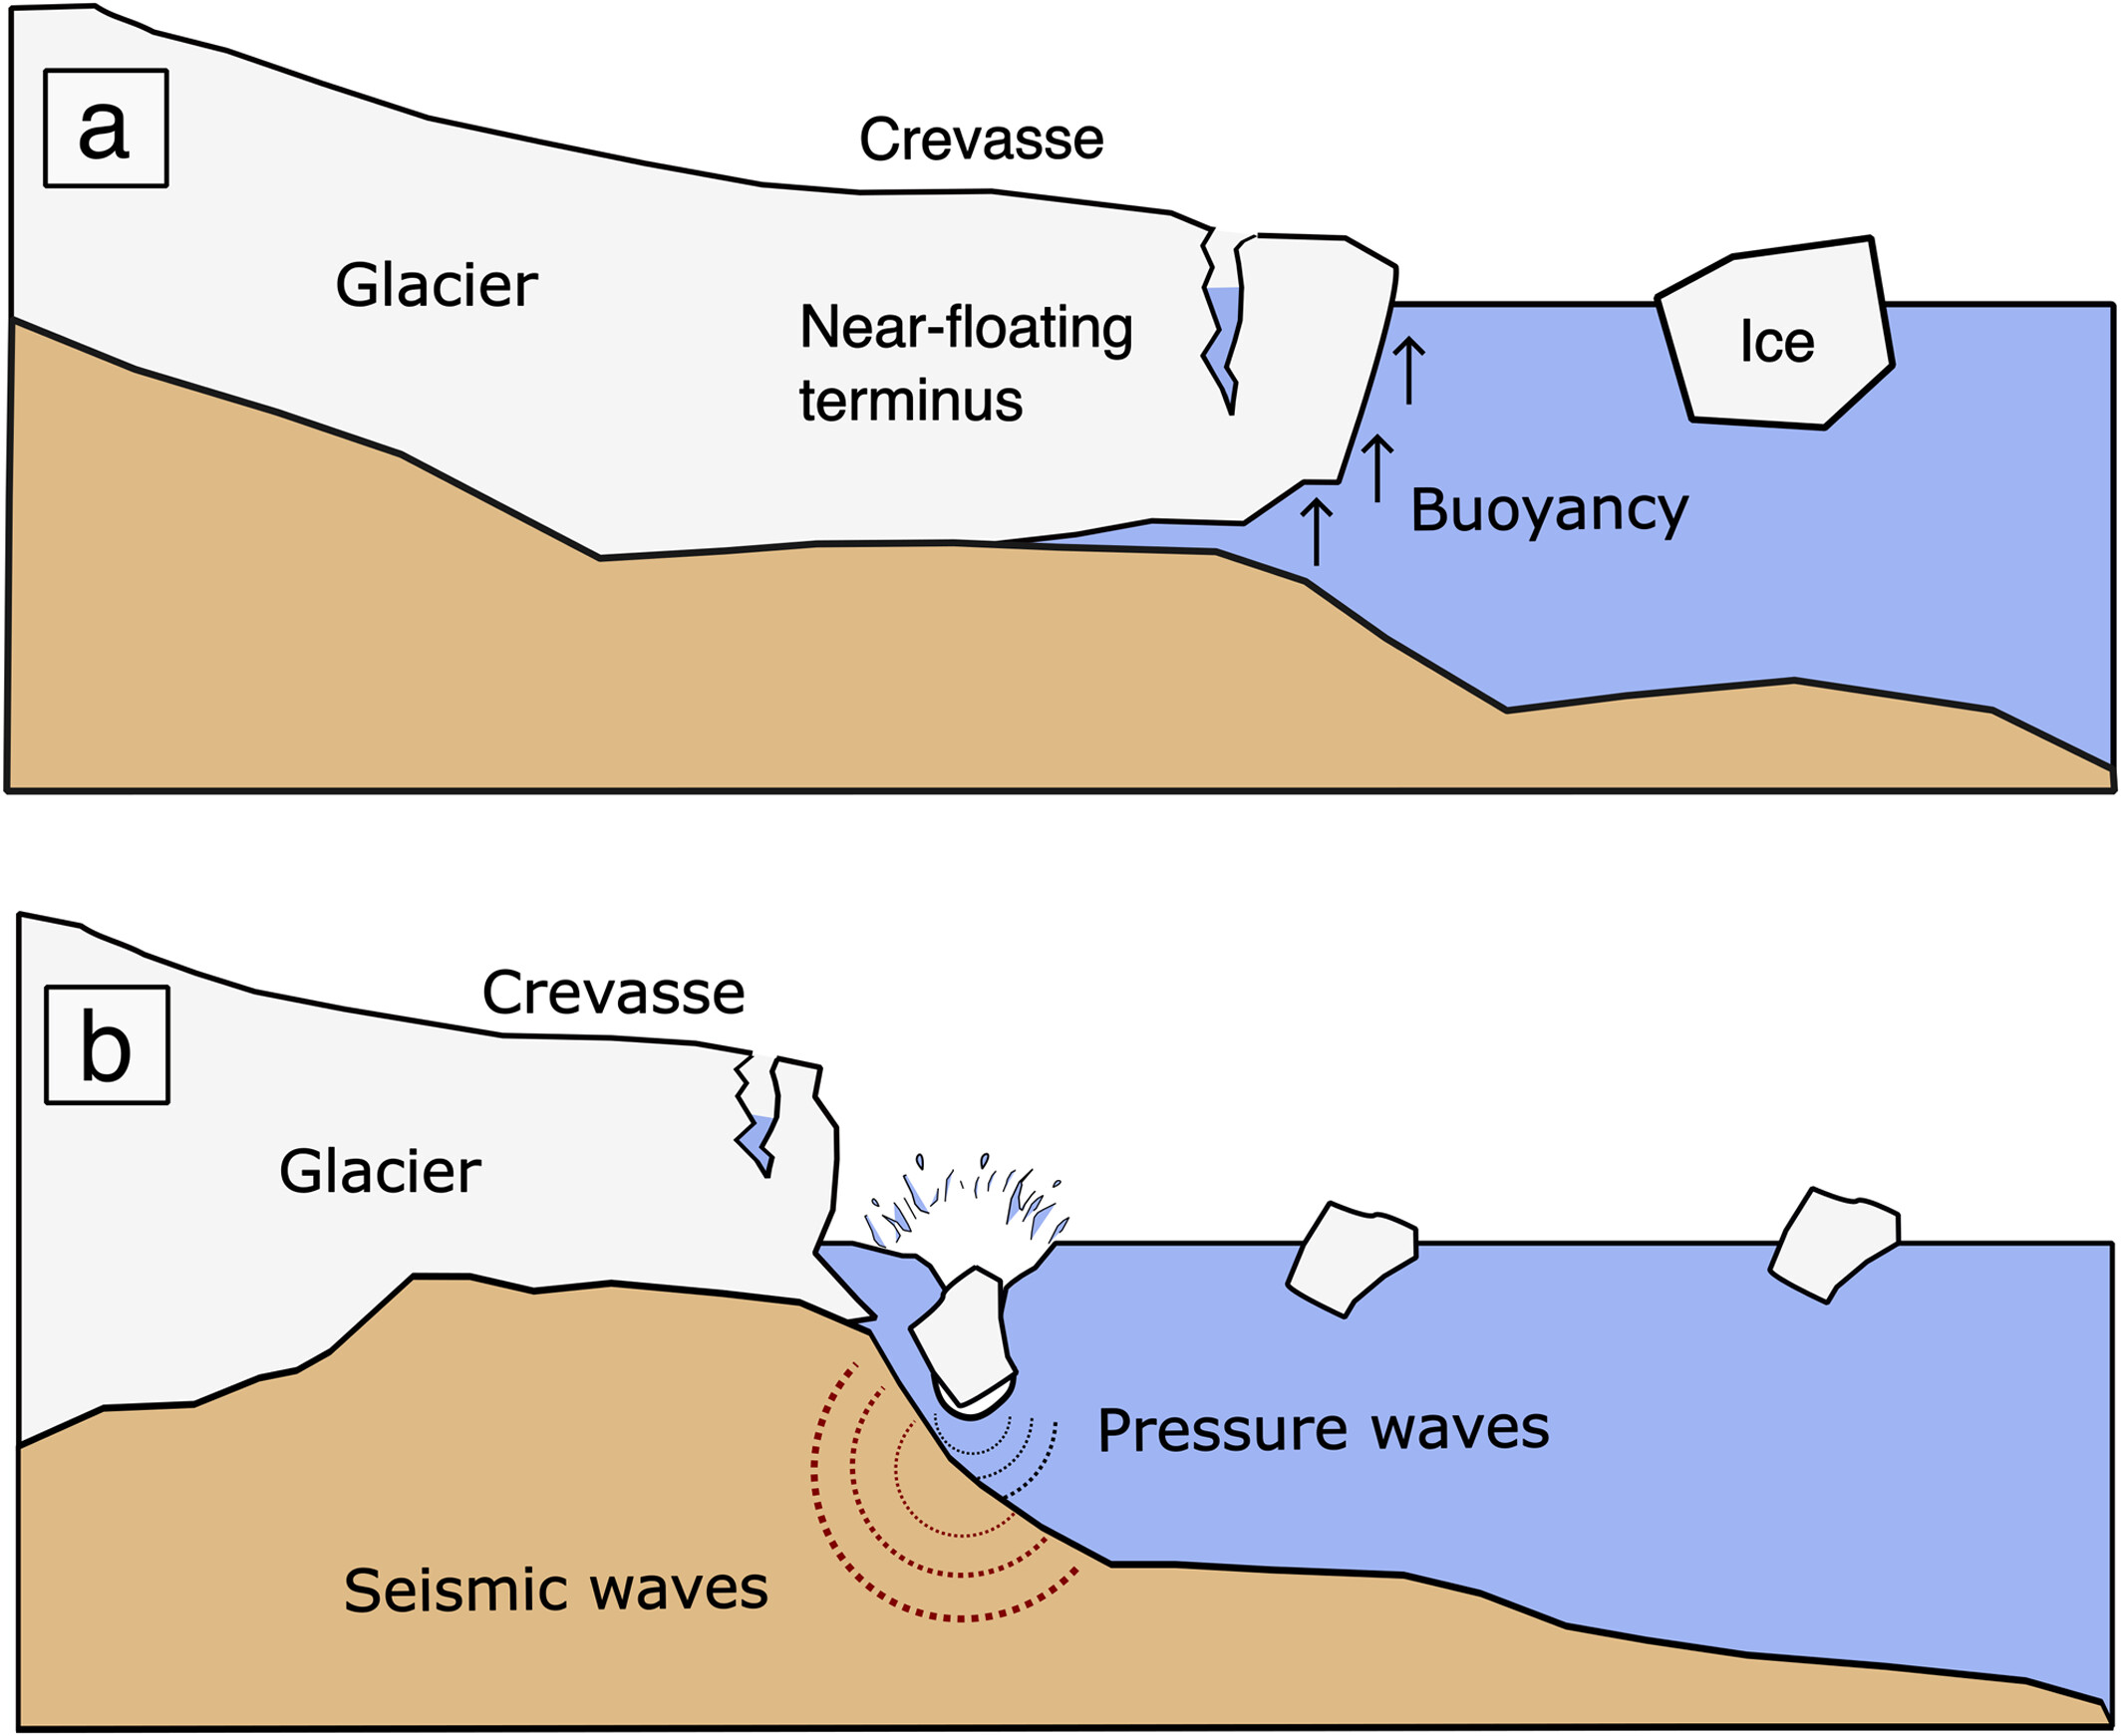
Another key factor is the water depth at the front of the glacier.
In shallow fjords, calving usually happens when blocks of ice break off the glacier’s face. Because much of the ice sits above the water, these blocks can fall from high up and hit the water with force, creating strong seismic signals (Figure 3).
In deep fjords, the glacier’s front often floats or nearly floats. Calving happens less often but produces larger icebergs. Because the ice is already supported by water, these events are quieter and create weaker seismic signals.
“When we started this research, we didn’t expect the depth of the water to play such a big role,” John said. “It was surprising at first, but it makes sense.”
The team’s method can also help scientists understand the history of other glaciers.
“This research is trying to answer the question of, ‘What can we learn about the dynamics of the glacier from this long-term data, which rarely exists?’” John said. (Figure 4) “Columbia Glacier shows that the Alaska record of glacier quakes holds valuable information.”
Learn more
What is causing seismicity near Mt. Ogden in Southeast Alaska?
Muldrow Glacier
2024 Seismicity Year in Review