2018 M7.9 Offshore Kodiak Earthquake
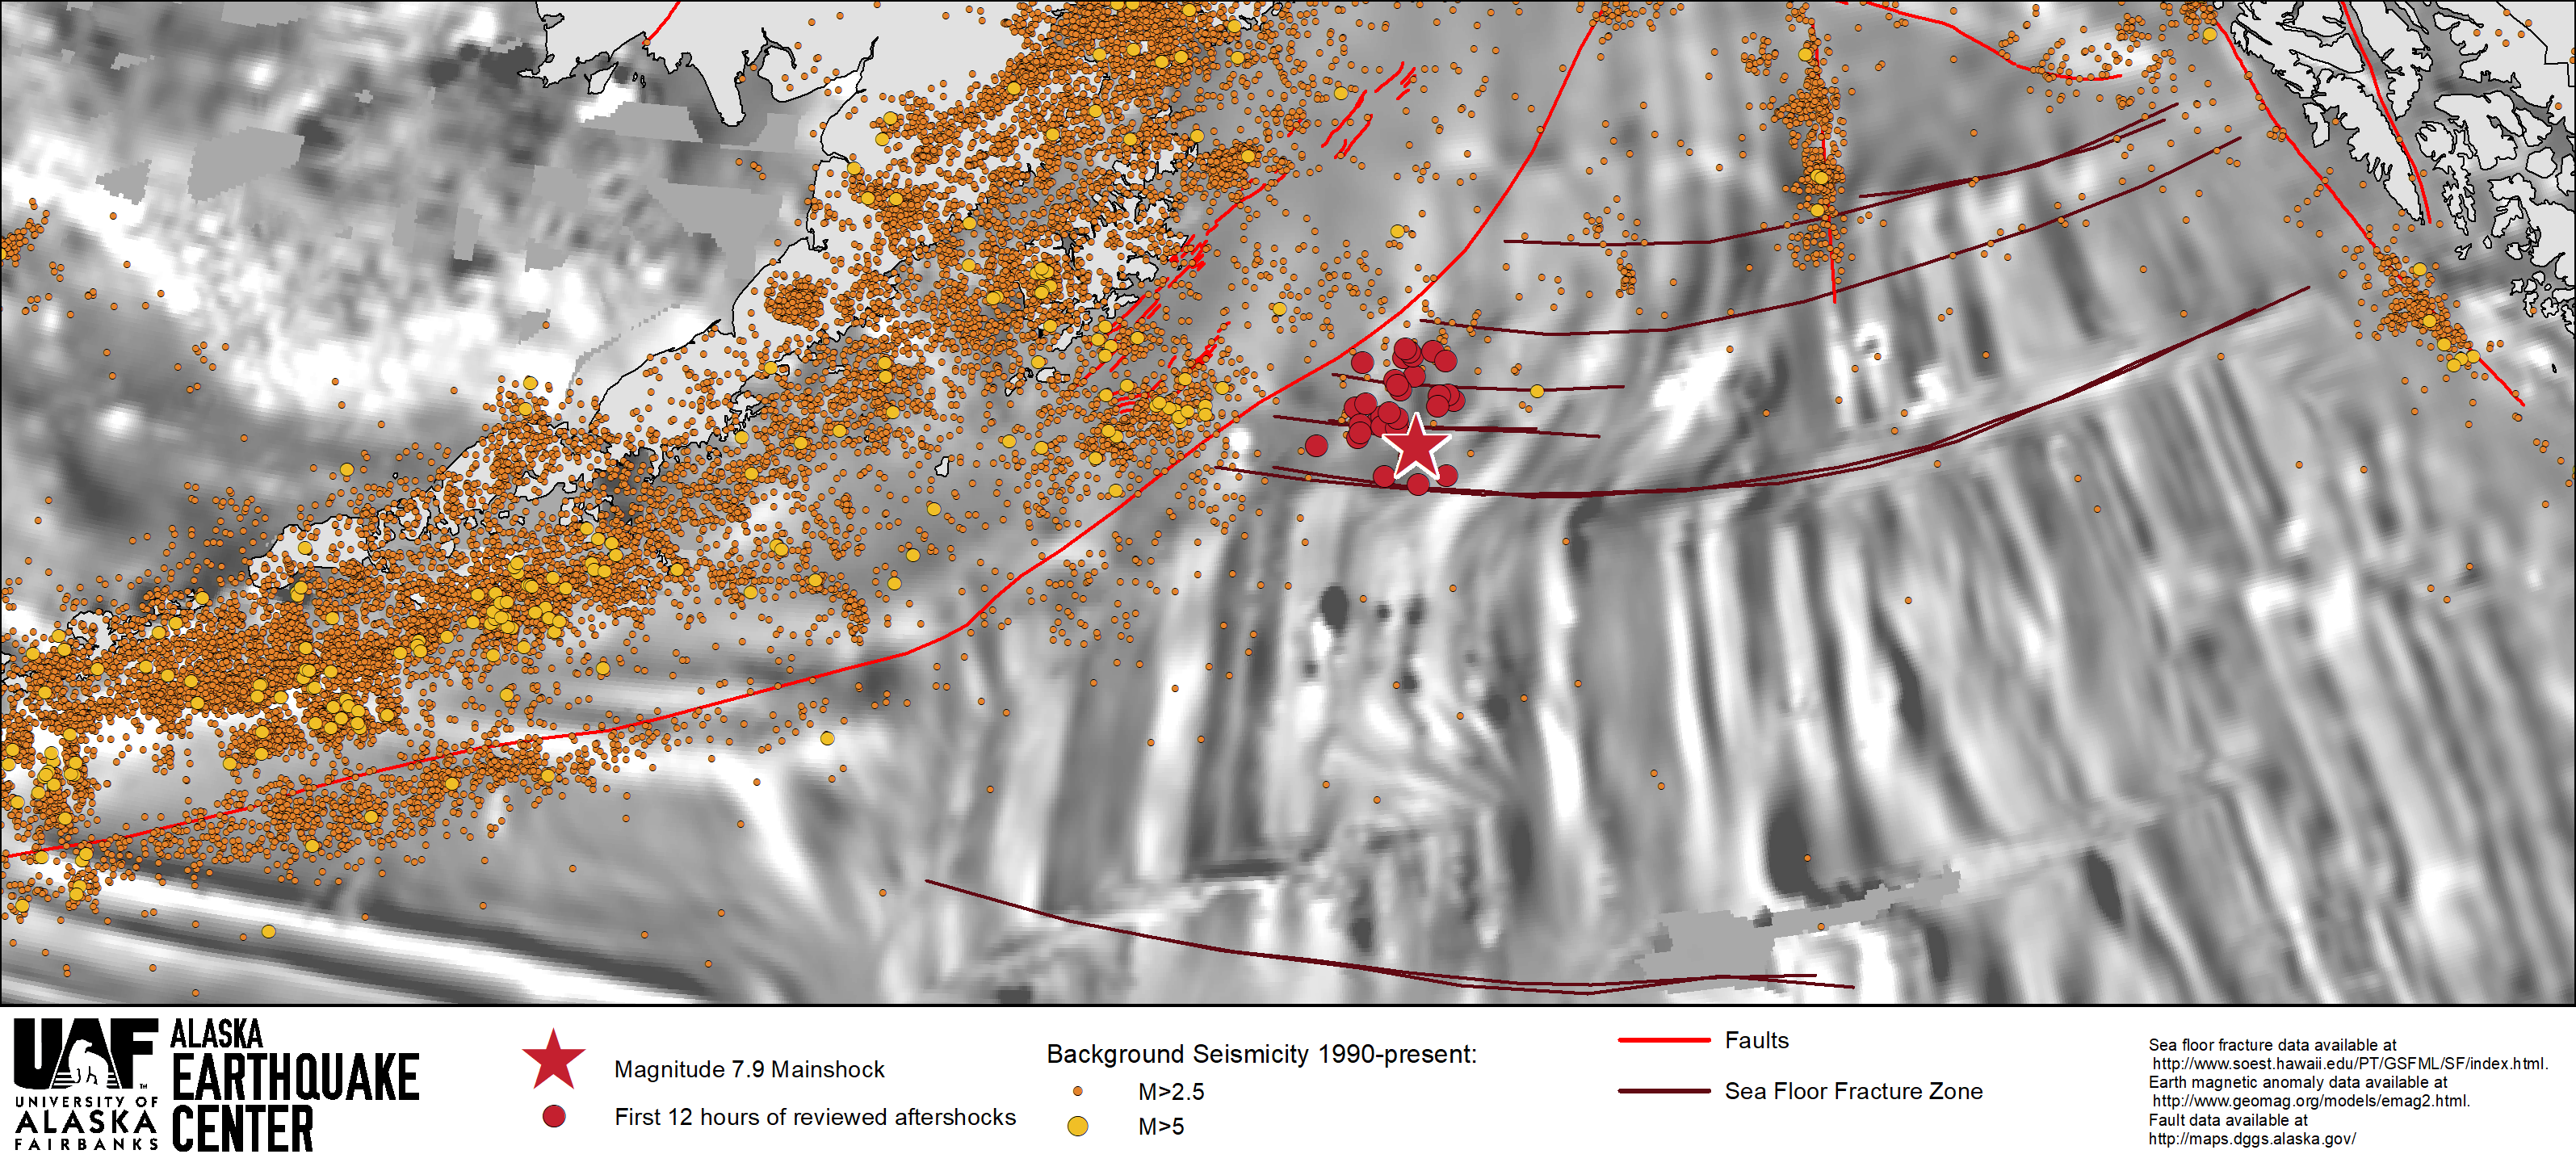
The 2018 Mw 7.9 Offshore Kodiak Earthquake is an example of a complex rupture of the oceanic lithosphere. The NE-SW faulting trends do not coincide with locations of oceanic plate fractures but correlate with orientations of fault planes of previously recorded earthquakes in the area. The 52 seconds of rupture propagation during the earthquake did not follow a continuous path and was partially driven by dynamic and static stress triggering. Below is a map showing the magnitude 7.9 location and early aftershocks with seafloor magnetic anomalies and background seismicity (orange dots). The magnetic anomalies (the black and white repeating pattern on the seafloor) form when new oceanic crust cools. Over time fractures form on the sea floor, represented by the dark red lines.
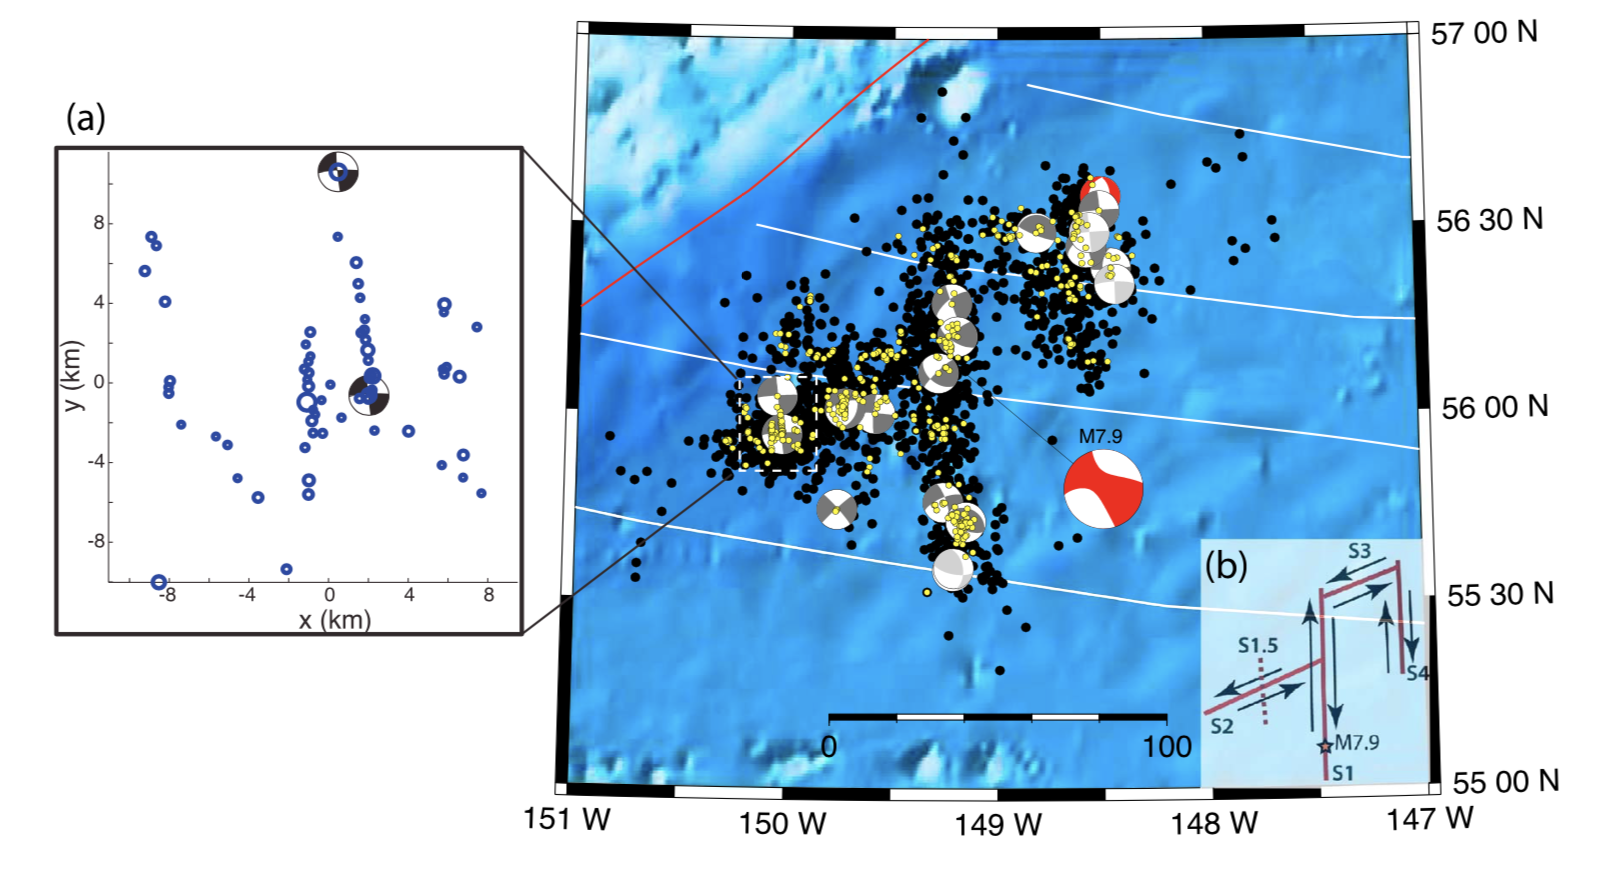
The moment tensor (USGS, Global CMT) for the earthquake suggests predominantly strike-slip faulting. The aftershock distribution shows several well-defined north-south trends but no clear east-west trends, however, GPS modeling of crustal deformation and finite source modeling with teleseismic recordings favor left-lateral faulting on faults striking south of west. Backprojection results presented in Ruppert et. al, 2018 support a complex rupture model featuring rupture in both north-south and east-west directions.
This figure from Ruppert et. al, 2018 shows aftershocks and moment tensors of the largest aftershocks. Black dots are M>3 aftershocks from the Alaska Earthquake Center catalog and yellow dots are relocated aftershocks. Moment tensors from the National Earthquake Information Center ComCat catalog (Mw 4.1-5.1) are shown as gray beach balls, and red beach balls are the centroid moment tensors from global CMT catalog for the mainshock and the largest aftershock (Mw 5.5, 24 January 00:04 UTC). The inset map (a) shows a subset of relocated aftershocks that demonstrate right-lateral faulting along north-south trending faults. Inset (b) shows a proposed fault segment model.