Magnitude 6 Susitna Earthquake Shakes Up Thanksgiving
Austin Holland
Elisabeth Nadin
Beth Grassi

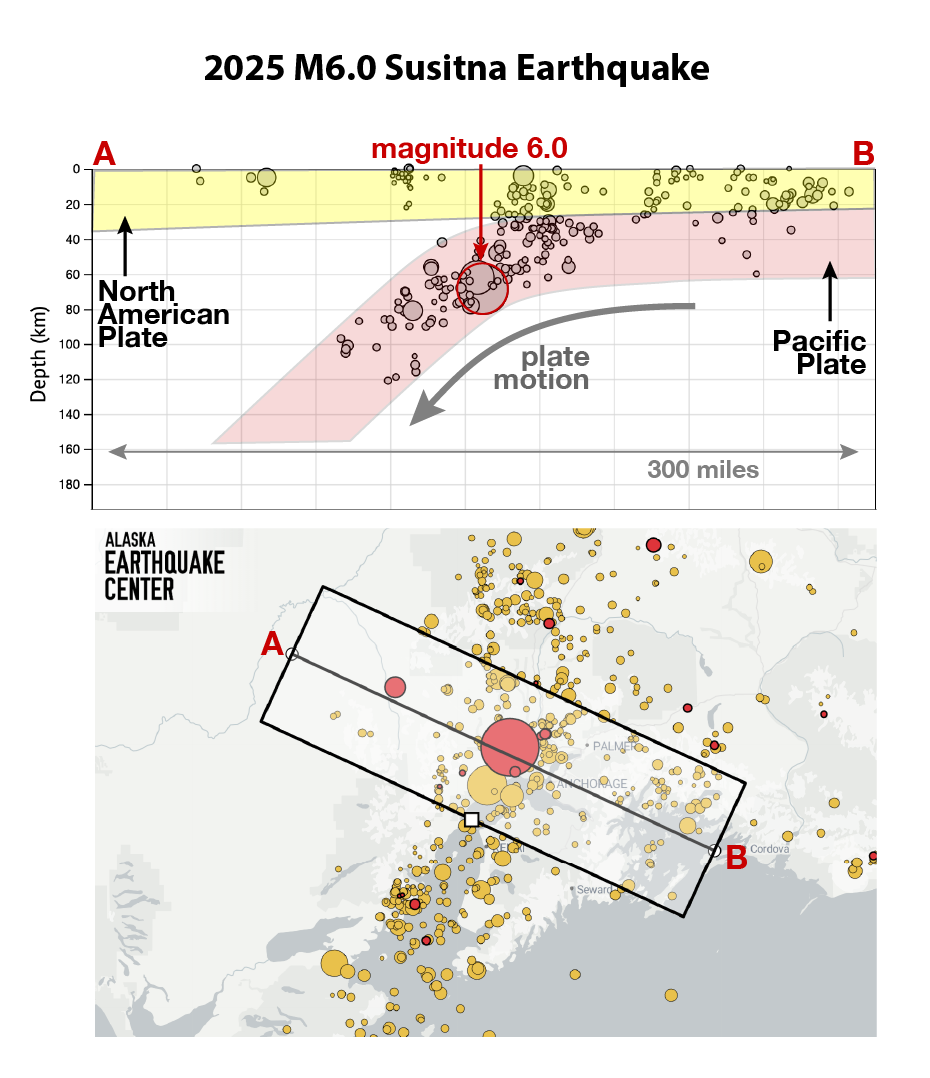
A magnitude 6.0 earthquake beneath Susitna, Alaska, was felt by thousands of Alaskans at about 8:12 am on Thanksgiving morning. Reports from Homer to Valdez and north to Fairbanks came from residents who were shaken awake. Our new Gen3 detection system quickly calculated the size and location (reviewed by our duty seismologist!) and produced more detailed information, such as the focal mechanism, within minutes (Figure 1). Because of the earthquake’s depth (about 40 mi, or 70 km—Figure 2), even those closest to the epicenter reported minimal damage like small cracks in drywall and photos jiggled off-kilter.

Many have asked if this was an aftershock of the November 30, 2018 M7.1 Anchorage Earthquake. This morning’s event fell outside the aftershock region of that earthquake (Figures 3 & 4). The Susitna quake likely occurred within the subducting Pacific Plate as it moves beneath the North American Plate (Figure 2). This type of earthquake is relatively common within southern Alaska (check out our recent radio segment about it.)

There have been aftershocks (the largest a magnitude 3.2 as of this writing), and we expect aftershocks in the area to be most common within the next few weeks. The U.S. Geological Survey aftershock forecast for the region suggests about a 25% chance of a magnitude 5 earthquake in the coming week.

How strongly was shaking felt? This is reported with the intensity scale, and the Sustina event was at a shaking intensity of V, according to USGS “Did you feel it?” responses. Consistent with reports, damage for this level of shaking is generally light to very light. Locations farther from the epicenter, like Nikiski (station CAPN) and Anchorage (station K22) felt the earthquake for longer and stronger (Figure 5). This is because they are in Cook Inlet Basin, and sedimentary basins trap seismic waves and enhance shaking.

While the proximity to the anniversary of the 2018 Anchorage Earthquake seems notable, there is no time of year when deep earthquakes are more likely to occur, and the late November timing of this earthquake is merely an interesting coincidence. Additionally, the type of earthquake was quite different, with this morning’s event resulting from lateral slip within the subducting plate, while the 2018 Anchorage event resulting from the typical thrusting motion of the Pacific Plate (Figure 3).

Map of Alaska showing location of the magnitude 6.0 earthquake, the stations that detected it as triangles shaded in red and blue, and to the right several seismograms from those stations.
Figure 1. Rapid analysis of the M6 Susitna earthquake using our new Gen3 system. The focal mechanism was available less than five minutes after detection, illustrating the system’s advanced real-time capabilities. (Credit: Derreck Gossett)


Top shows cross section of North American Plate and the location of the magnitude 6.0 earthquake in the downgoing Pacific Plate.
Figure 2. Annotated cross section of the 2025 M6.0 Susitna Earthquake from the Earthquake Center’s interactive recent earthquakes map. 
Top: The Pacific Plate (pink) underthrusts the North American Plate (yellow). This earthquake occurred inside the down-going Pacific Plate. This plate is subjected to considerable stresses as it is pulled deep into the earth and as it bends to accommodate this motion. This type of “intraslab earthquake” is a common source of seismic activity felt in Southcentral Alaska. 
Bottom: The last two weeks of earthquakes in Alaska marked in yellow, earthquakes from the past 24 hours in red. Circles are scaled by magnitude. The large red circle makes the epicenter of the M6.0. ‘A’ and ‘B’ mark the edges of the cross section shown in the top panel. (Credit: Michael West)


Comparison map of focal mechanisms for 2025 magnitude 6.0 earthquake and 2018 magnitude 7.1 earthquake.
Figure 3. Comparison of the 2018 M7.1 mainshock aftershock sequence with today’s M6.0 Susitna sequence. The Susitna earthquake lies outside of the 2018 aftershock zone, and its focal mechanism indicates a different faulting style. (Credit: Sarah Noel)


Map on left shows shaking intensity of 2025 magnitude 6.0 in shades of green and blue, and on the right the stronger intensities of the magnitude 7.1 in yellows and oranges.
Figure 4. Side-by-side comparison of the Susitna 2025 and the Anchorage 2018 intensity maps. Intensities for this earthquake are  about 2–3 levels lower than the Anchorage earthquake. Despite having a lower magnitude and being almost twice as deep, the event was still widely felt throughout Interior and Southcentral Alaska. In fact, this event received almost three times as many felt reports (small colored dots on the map) about 6500 vs 2300! (Credit: Alex Fozkos)


Map of seismograms from various Cook Inlet region seismic stations, with the strongest shaking at southern stations.
Figure 5. Map of the region where earthquake shaking was felt, with seismograms from the closest Alaska Earthquake Center seismic stations. Stations CAPN and K220 show how a sediment filled basin can generate stronger and longer shaking. (Credit: Cade Quigley)