
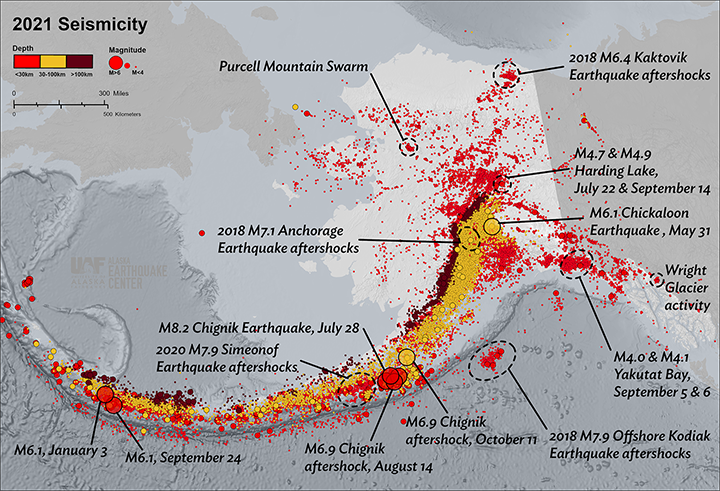
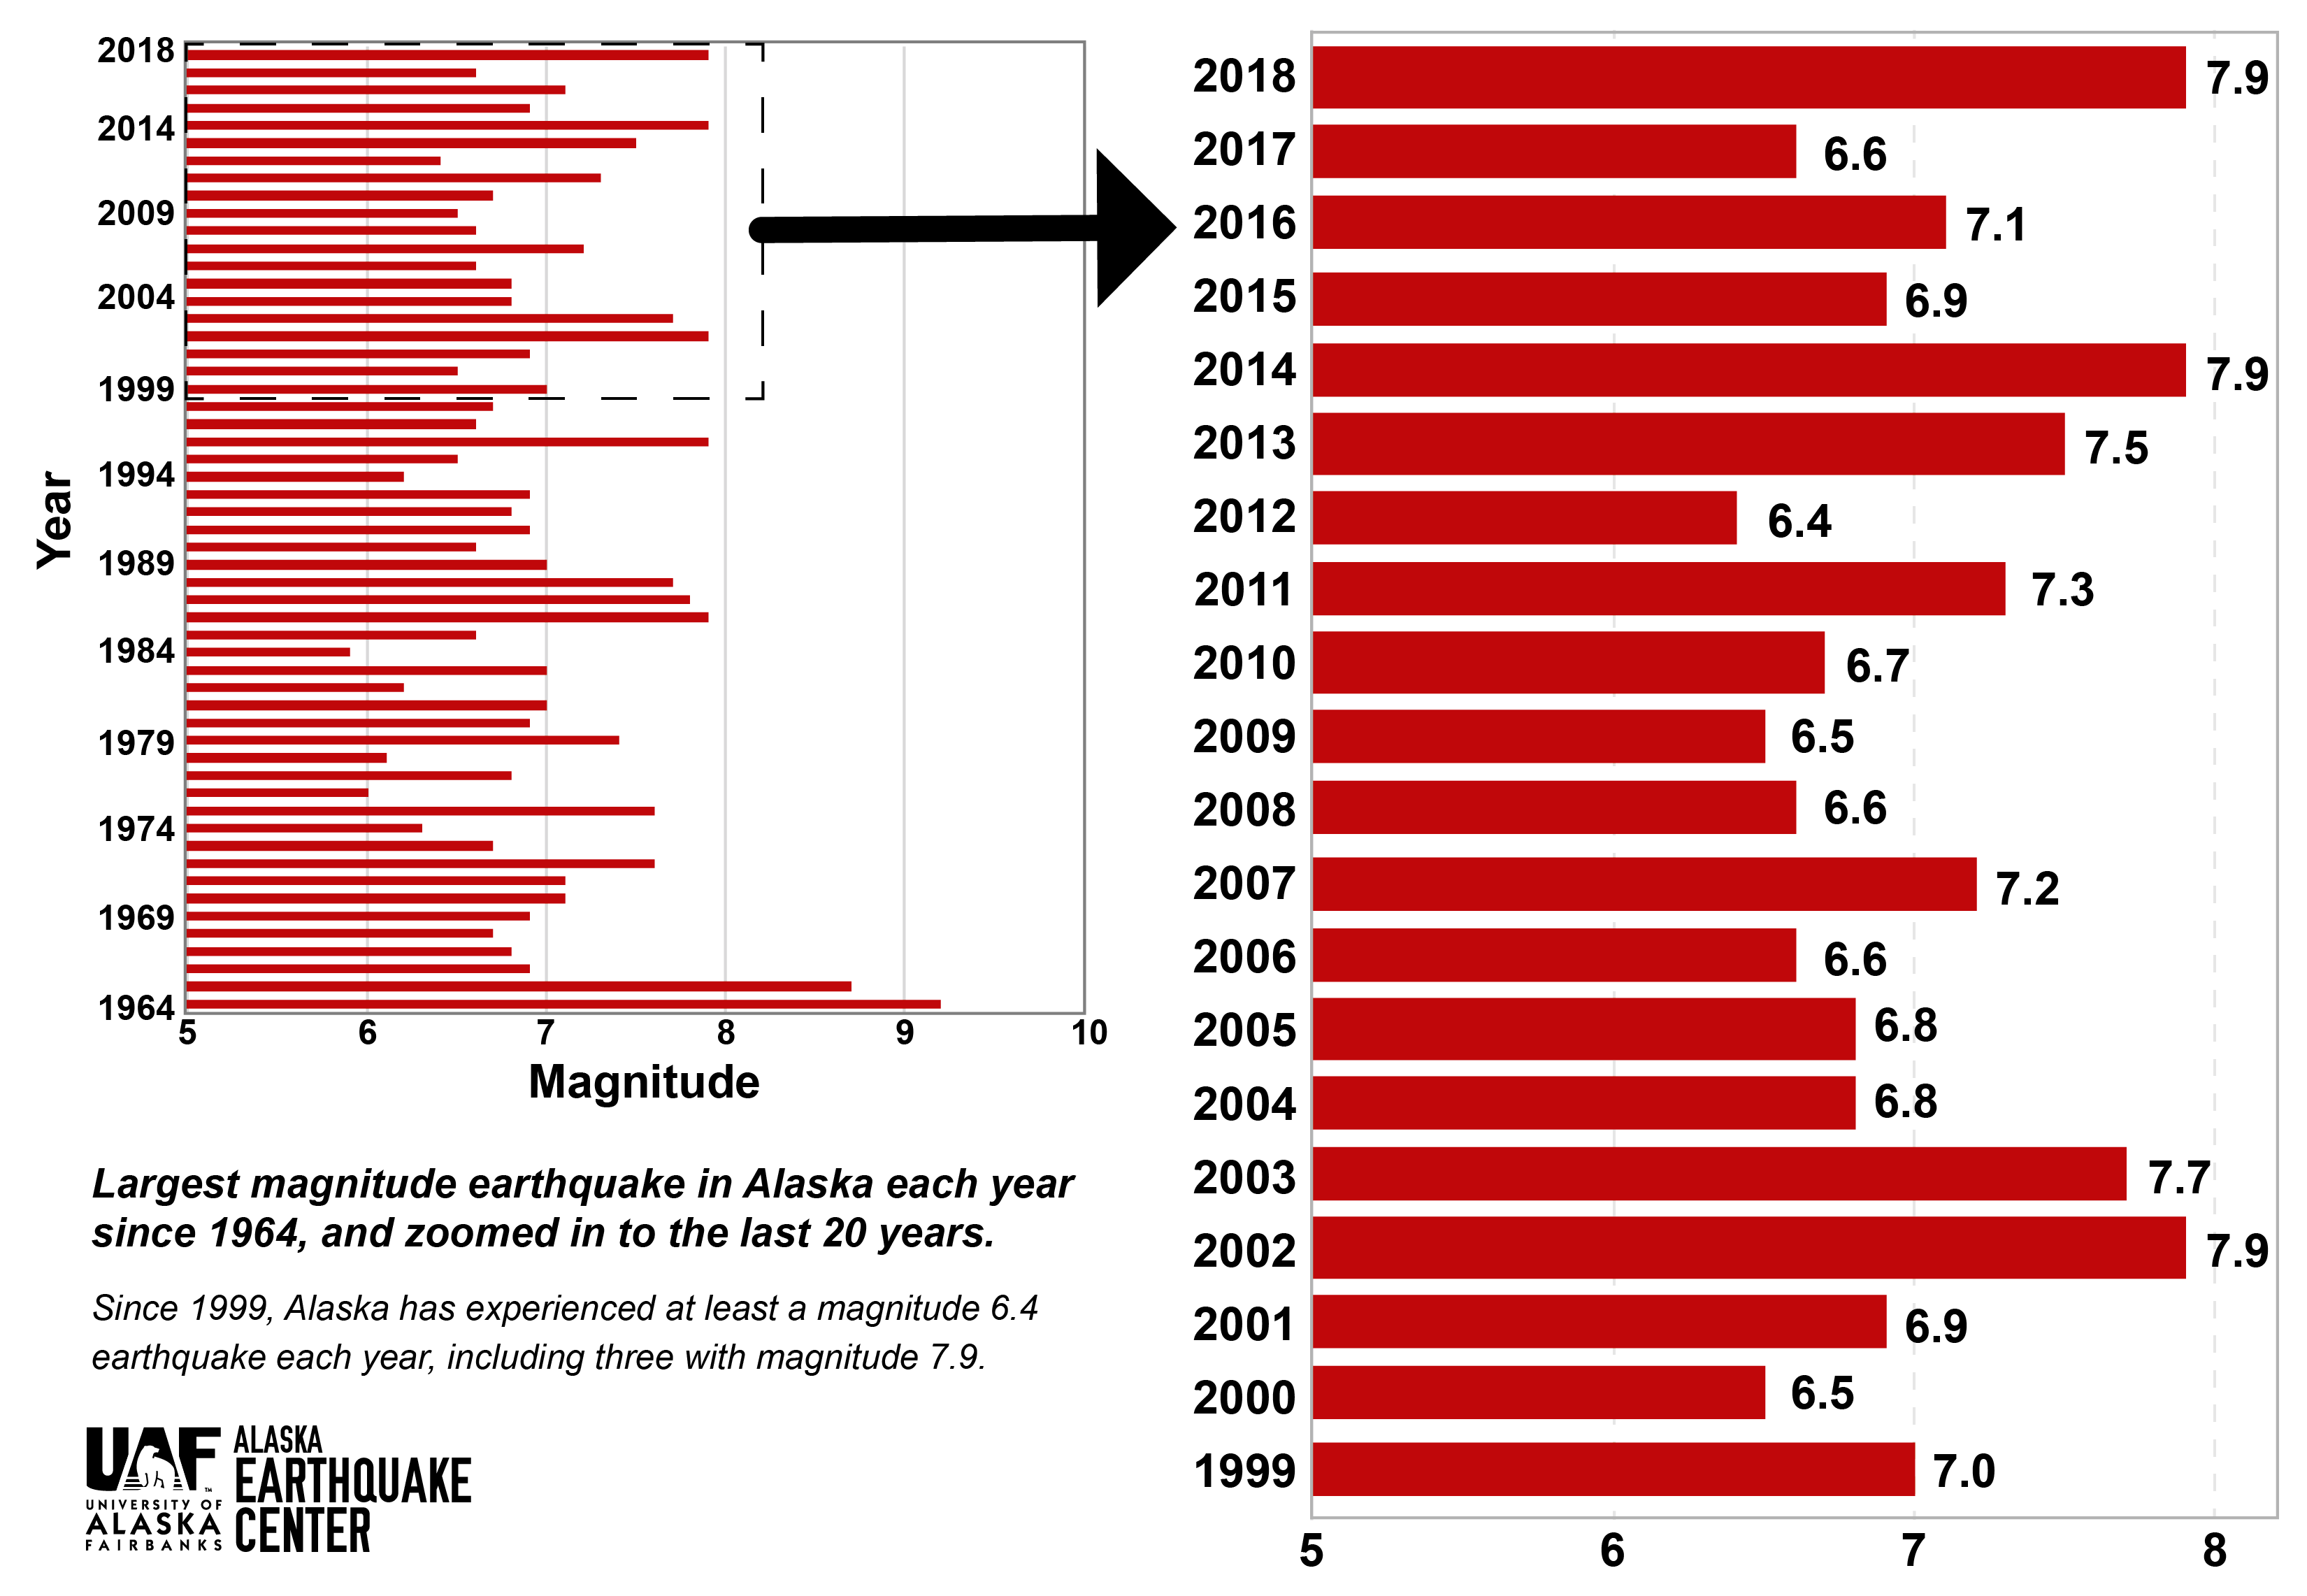
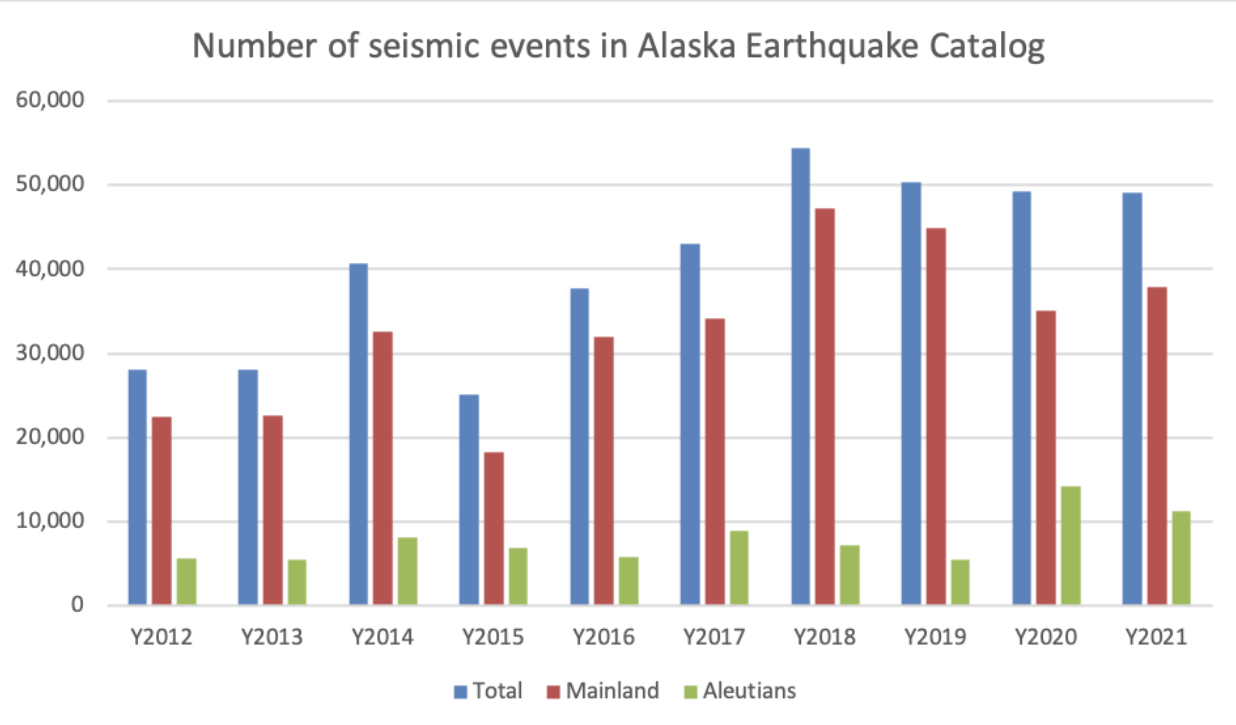


Seismicity for 2021 has been analyzed, quality controlled, and cataloged (figure 1). Despite the largest U.S. earthquake in more than 50 years, a magnitude 8.2 southwest of Kodiak Island, 2021 ranked fourth overall, with 49,120 events, after 2018 (about 55,000), 2019 (about 50,000), and 2020 (about 49,250) (figure 3). That’s not to say that our seismic data analysts weren’t busy.
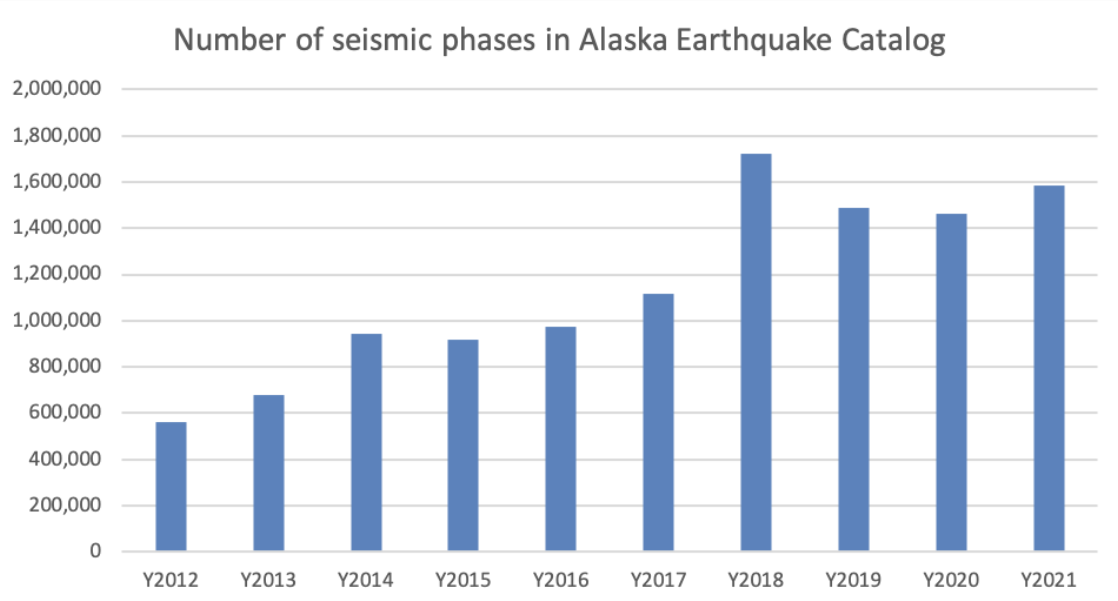
During 2021, the center’s seismic data analysts picked and cataloged nearly 1.6 million of the characteristic signals that indicate earthquake energy arriving at a seismic monitoring station. Some of these P- and S-wave arrivals are detected by an automatic system, others are manually added; either way, they must all be reviewed by a human analyst to ensure accuracy and consistency within our earthquake catalog. Those 1.6 million picks (or phases) ranked 2021 as the second highest year overall. That means our data analysts processed more information in fewer events than in any year outside of 2018 (figure 4).
July 28 M8.2 Chignik Earthquake
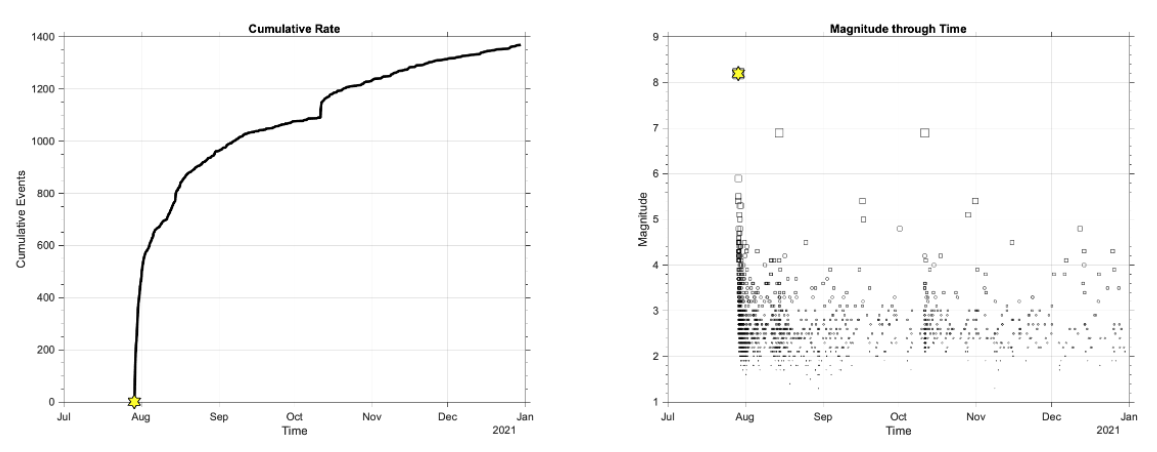
The largest Alaska and global earthquake during 2021 was the M8.2 Chignik Earthquake on July 28 at 10:15pm AKDT (July 29 at 06:15 UTC). The earthquake originated offshore of the Alaska Peninsula and ruptured 120 miles northeast toward Kodiak Island along a 60-mile-wide portion of the Aleutian Megathrust, the region where the Pacific plate is forced beneath Alaska. The size and location of the earthquake resulted in a tsunami warning from the National Tsunami Warning Center. Several coastal communities issued evacuations, but fortunately the earthquake rupture did not disturb the seafloor enough to result in an appreciable tsunami. The two largest aftershocks, both magnitude 6.9, occurred on August 14 and October 11 (figure 1). We recorded about 1,370 aftershocks with magnitudes ranging between 1.3 and 6.9 through the end of the year. Figure 5 shows the cumulative number of aftershocks with time (left) and magnitude with time (right).
May 30 M6.1 Chickaloon Earthquake
On May 30, 2021 (May 31 UTC), the M6.1 Chickaloon Earthquake rattled central Alaska and resulted in an active aftershock sequence (522 events) ranging from magnitude 0.6 to 4.6 in the first month. This earthquake was an intraslab event, meaning it occurred within the subducting plate, not along the boundary between two plates. This is normal for the region, but this event was the largest in this area in 50 years.
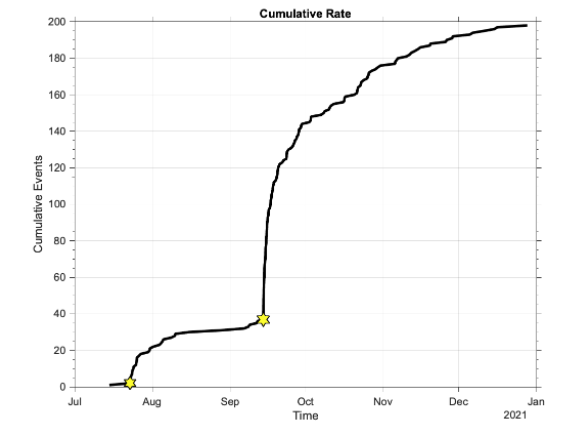
July 22 M4.7 and September 14 M4.9 Harding Lake earthquakes
An interesting sequence of events near Harding Lake in Interior Alaska began on July 22, 2021 (July 23 UTC), with a M4.7 earthquake that was followed almost two months later by a M4.9 on September 14, approximately 3 miles away. Each of these events was followed by aftershock sequences, but the M4.9 sequence was roughly four times as active (figure 6). Both events and several aftershocks were felt widely in the Interior. Both mainshocks appear to be strike-slip type earthquakes (occurring on a vertical fault) within the region referred to as the Salcha Seismic Zone. While the aftershock rate decreased with time, the activity level remained above background through the end of 2021. Since this earthquake occurred within a well-instrumented part of the regional network, aftershocks with magnitudes as small as 0.5 were reliably detected and located. This fault zone is no stranger to large magnitude earthquakes, having experienced a M7 on July 22, 1937, exactly 84 years prior.
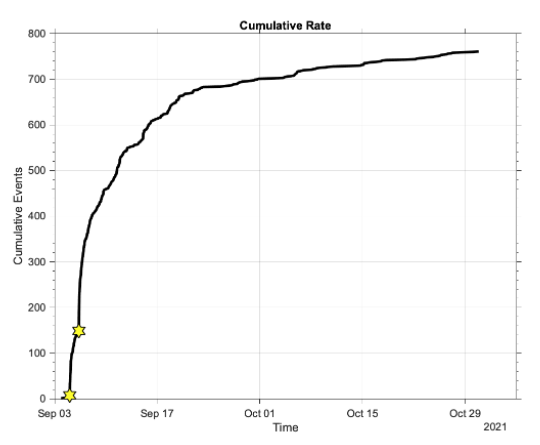
September 5-6 M4.0 and M4.1 Yakutat earthquakes
An earthquake sequence west of Yakutat Bay began on September 5 with a M4.0 earthquake followed by a M4.1 earthquake on September 6. This sequence produced the second highest number of aftershocks after the Chignik Earthquake aftershock sequence. We recorded more than 760 events in this sequence through the end of October (figure 7) with magnitudes ranging between 0.8 and 3.4. This area is dominated by complex faulting driven by strike-slip faulting of the Fairweather fault that runs along Southeast Alaska intersecting with the Chugach-St. Elias region. Both of these earthquakes exhibited reverse-type faulting, where one side of the fault is pushed up above the other side, which is common in compressional environments. The high rate of aftershock activity was, however, unexpected.
Ongoing aftershock sequences and swarms
In addition to the notable events above, 2021 seismicity included the continuation of several sequences and swarms from previous years. The 2020 M7.8 Simeonof aftershock sequence contributed more than 3,000 aftershocks ranging from M1 to M5.4 (figure 1). The cluster of aftershocks around the M7.6 aftershock continues to be the most active in the sequence. While the rate of the aftershocks continued to decline through 2021, we expect the Simeonof aftershock sequence to extend through 2022.
The 2018 M7.1 Anchorage, M7.8 Offshore Kodiak, and M6.4 Kaktovik aftershock sequences continue well into their third year (figure 1). Anchorage aftershocks have decreased roughly 30% in number, down to about 900, but 27 of those events were reported felt by southcentral residents.This brings the total sequence to more than 13,500 aftershocks. Offshore Kodiak aftershocks contributed an additional 254 earthquakes to 2021, bringing the sequence total to more than 5,450. However, due to their offshore location, only events larger than M2.5 are reliably located. Kaktovik aftershocks added 325 of the sequences’ 7,225 events in 2021. All three of these sequences are decreasing, but remain above background levels and are expected to continue in 2022.
The Purcell Mountains Swarm and Northeast Brooks Range sequence also continued in 2021. The Purcell Mountains Swarm, which began in March 2019, had about 709 new events, which is less than half of what was recorded in 2020. A new feature a short distance north of the main cluster became active between April 9-23, 2021. There was no history of activity in this area prior to this new activation. We continue to monitor seismicity in the northeastern Brooks Range region of Alaska. This region piqued our interest in 2018 and 2019 with energetic swarm-like activity in late summer–early fall months. We recorded about 200 earthquakes in this region in 2021, lower than in each of the previous three years.
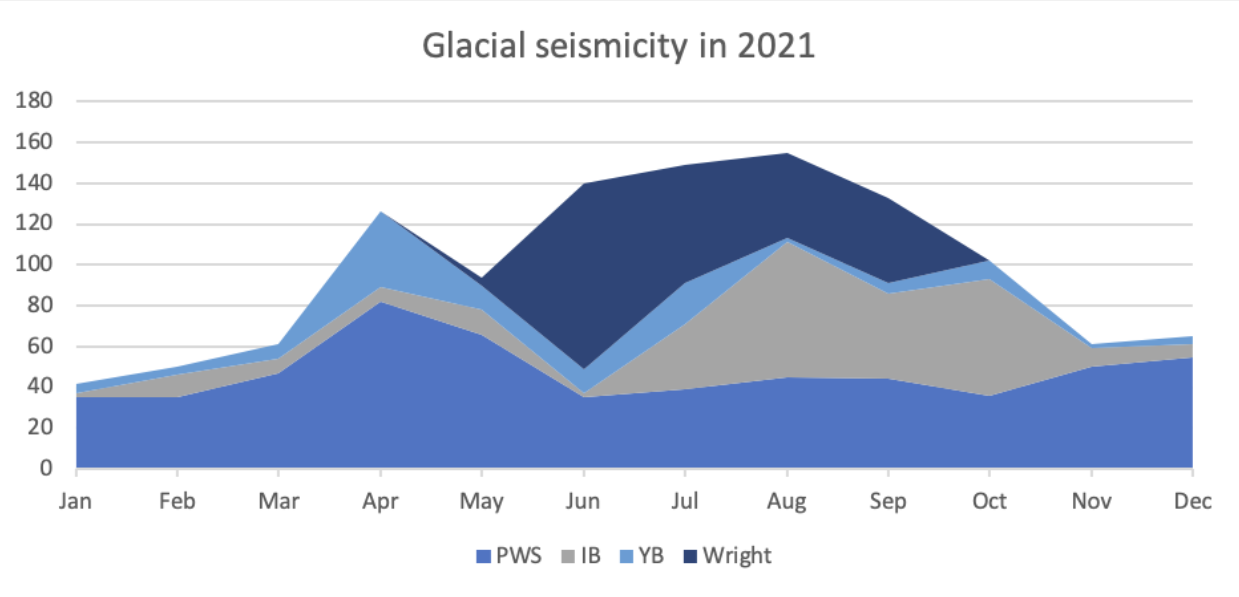
Glacial seismicity and Wright Glacier cluster
Alaska’s large expanse of glaciated areas with seismic instrumentation results in a wide range of glacially induced seismic activity. In 2021, we reported approximately 1,400 glacial events (figure 8). Typically, glacial activity is recorded near the termini of tidewater glaciers such as in the Prince William Sound region, Icy Bay, and Yakutat Bay. This activity follows seasonal changes and is most often observed between April and October each year.
This year we continued to record events in a tight cluster under Wright Glacier, which is about 40 miles northeast of Juneau (figure 1). A few of the events in this cluster reached M3, large enough to be felt in Juneau. The events ramped up in June, eventually ending in late September. Periodic seismicity in this region has been observed since the 1970s, with the amount of activity highly variable each year.
For more in-depth information on 2021 seismicity, view the 2021 Alaska Seismicity Summary Technical Report.