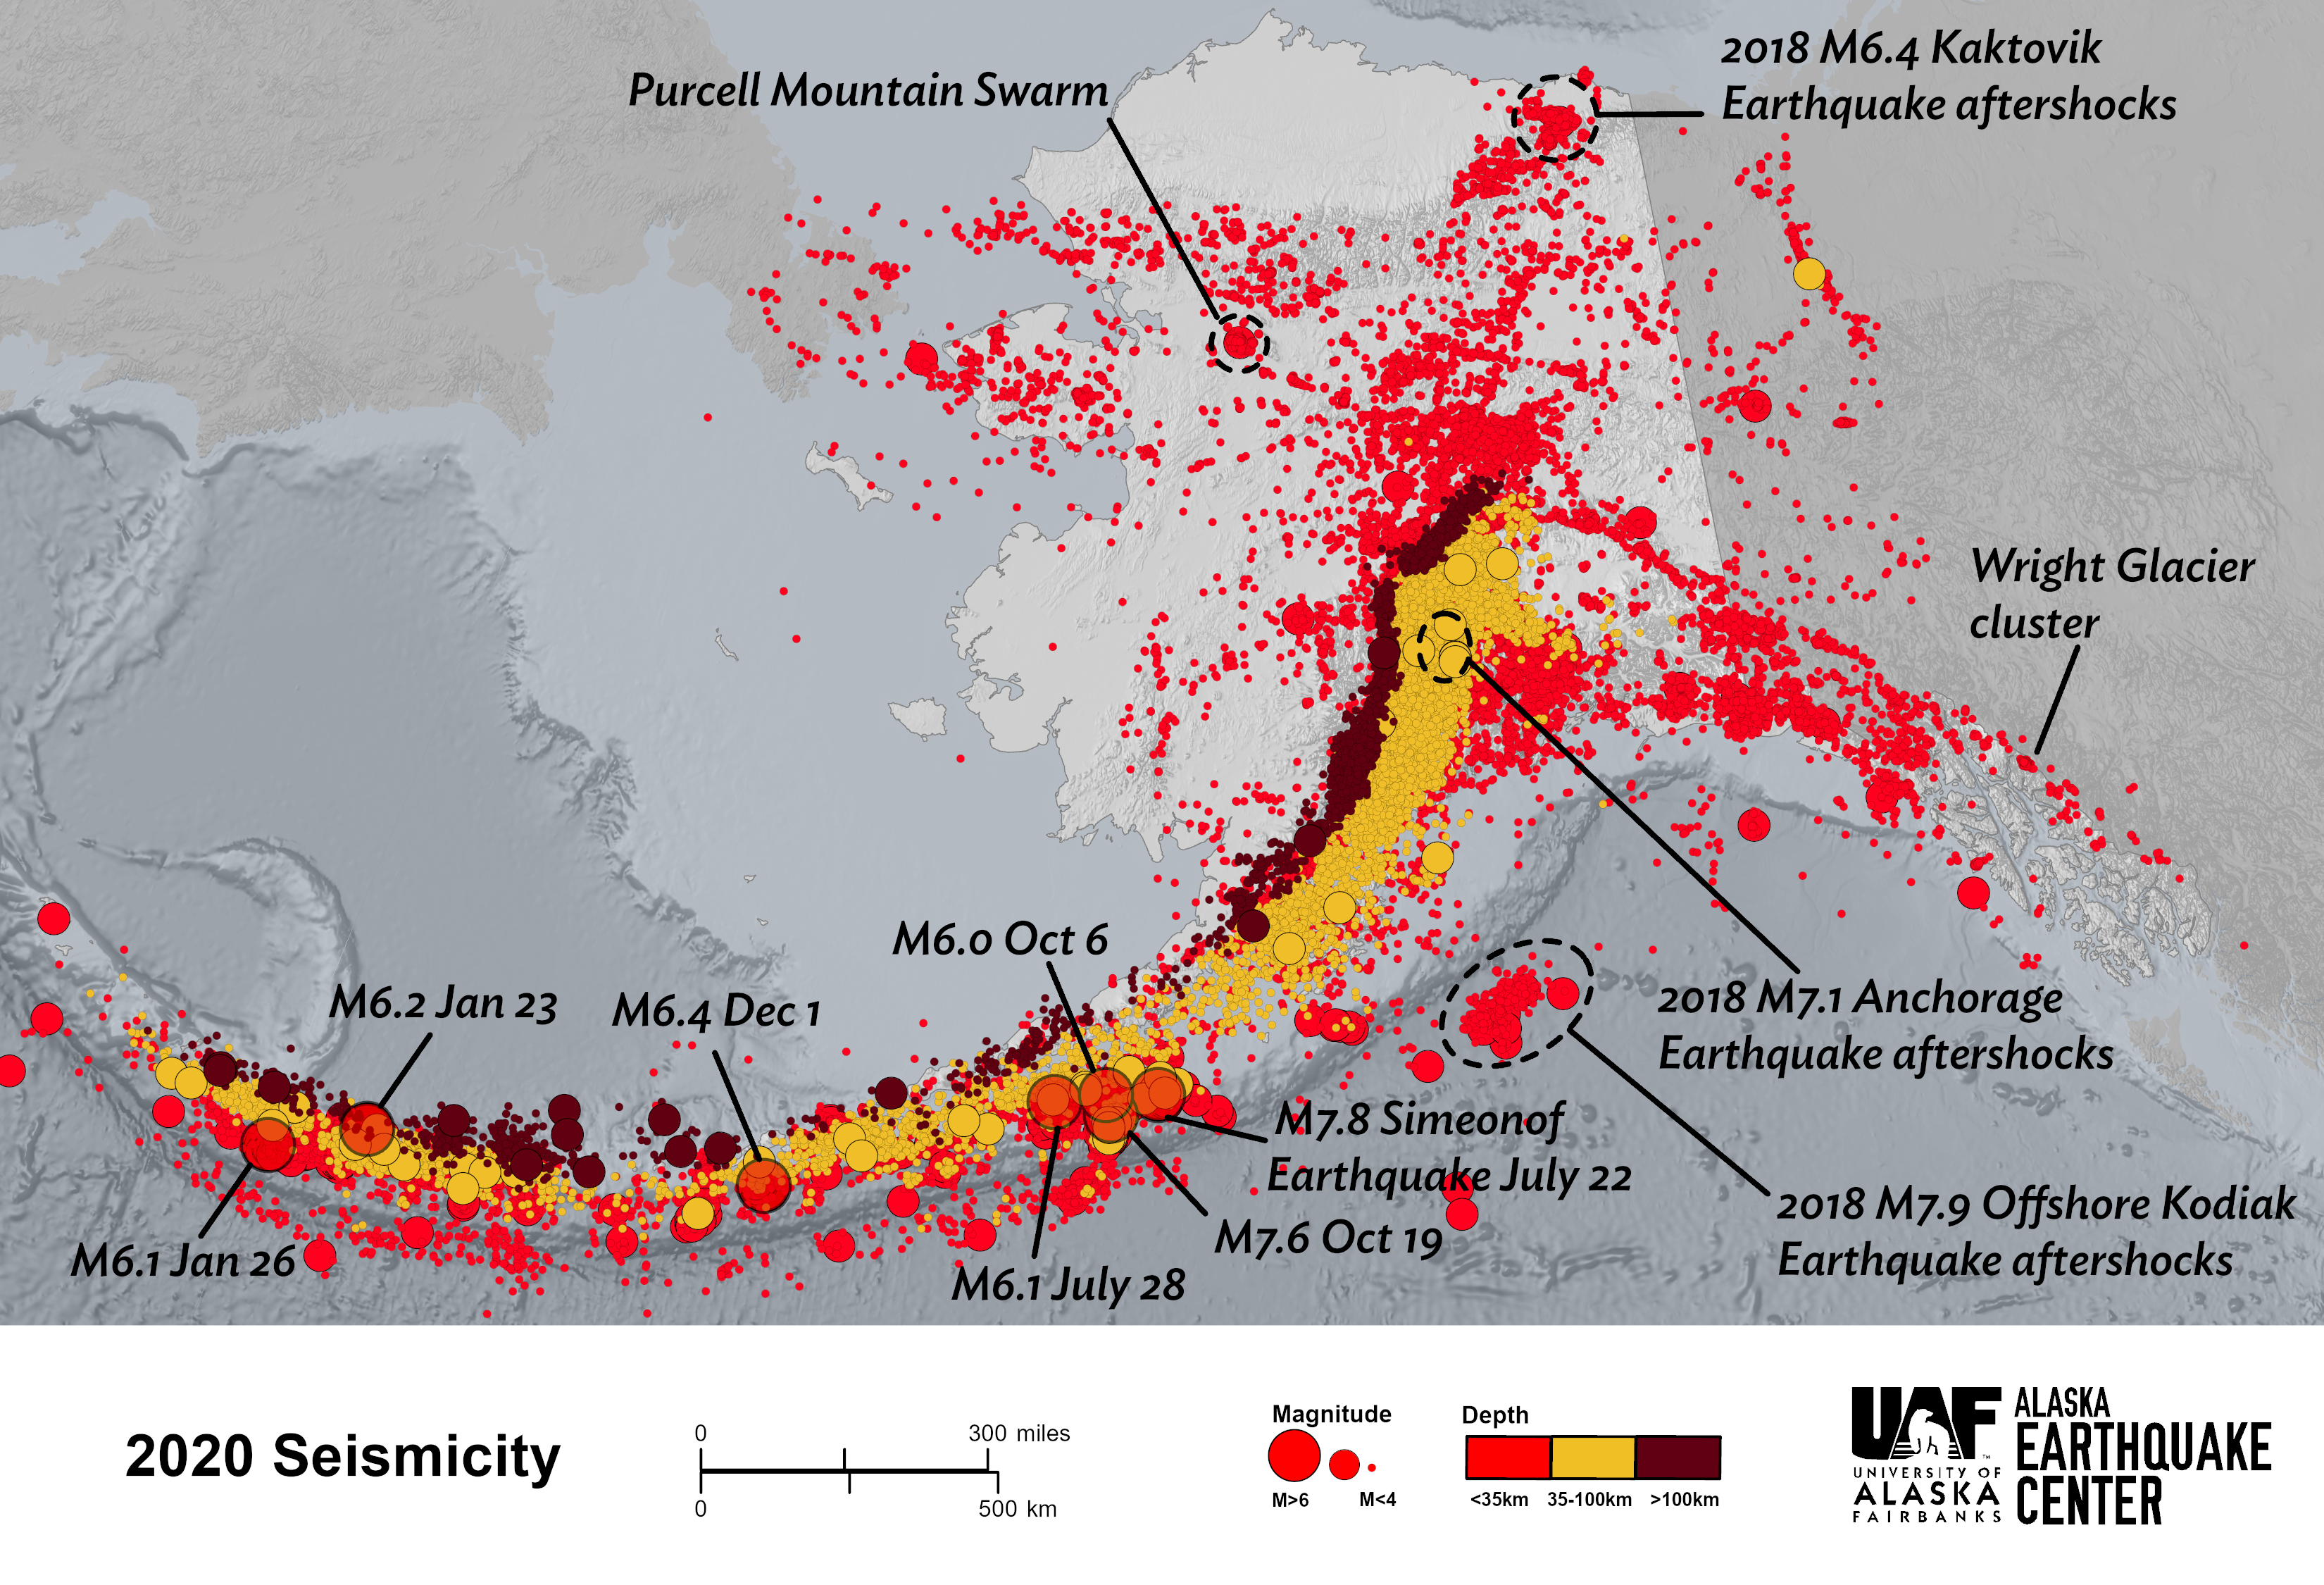
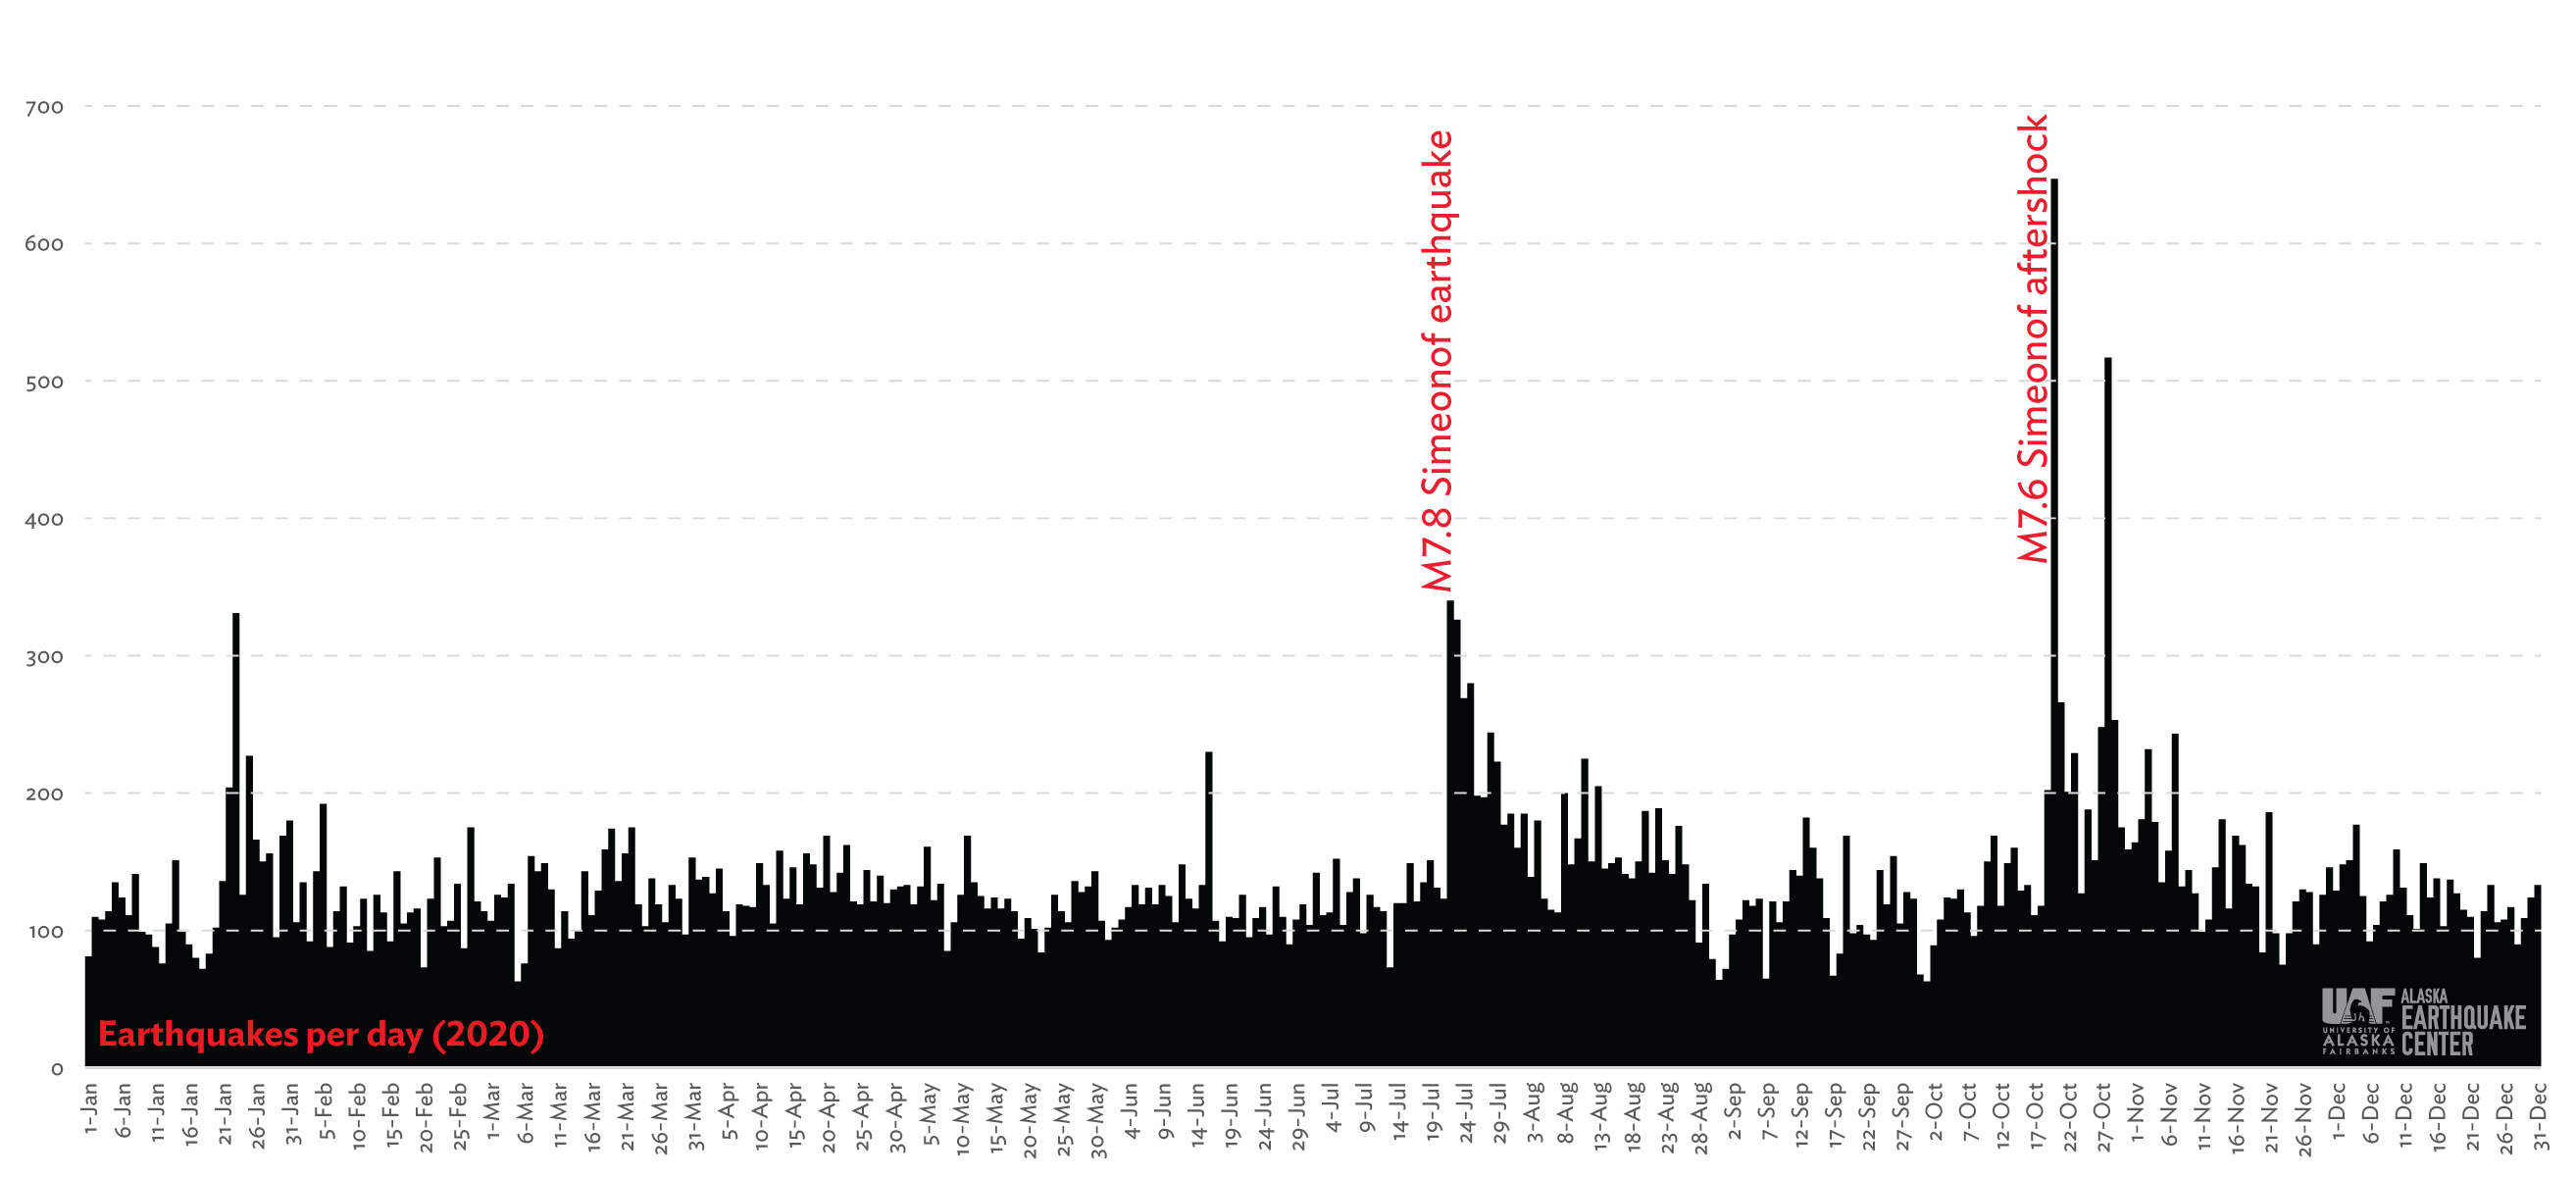
The largest and third largest earthquakes worldwide in 2020 were both in Alaska: the M7.8 Simeonof Earthquake and its M7.6 aftershock. In total, the Earthquake Center reported about 49,250 seismic events in Alaska and nearby regions in 2020 (figures 1 and 2), making it the state’s third largest year, after 2018 (about 55,000 seismic events) and 2019 (about 50,000 seismic events). The M7.8 Simeonof Earthquake was significant in many ways from producing a small tsunami and damage to coastal Alaska Peninsula communities to its potential impact on our understanding of the Aleutian Megathrust and subduction beneath Alaska. Let's explore this sequence and others we are watching and how they contribute the year in earthquakes.
Simeonof Earthquake
The M7.8 Simeonof Earthquake and M7.6 aftershock both caused damage in several Alaska Peninsula communities and prompted tsunami evacuations, although fortunately neither triggered significant tsunamis.
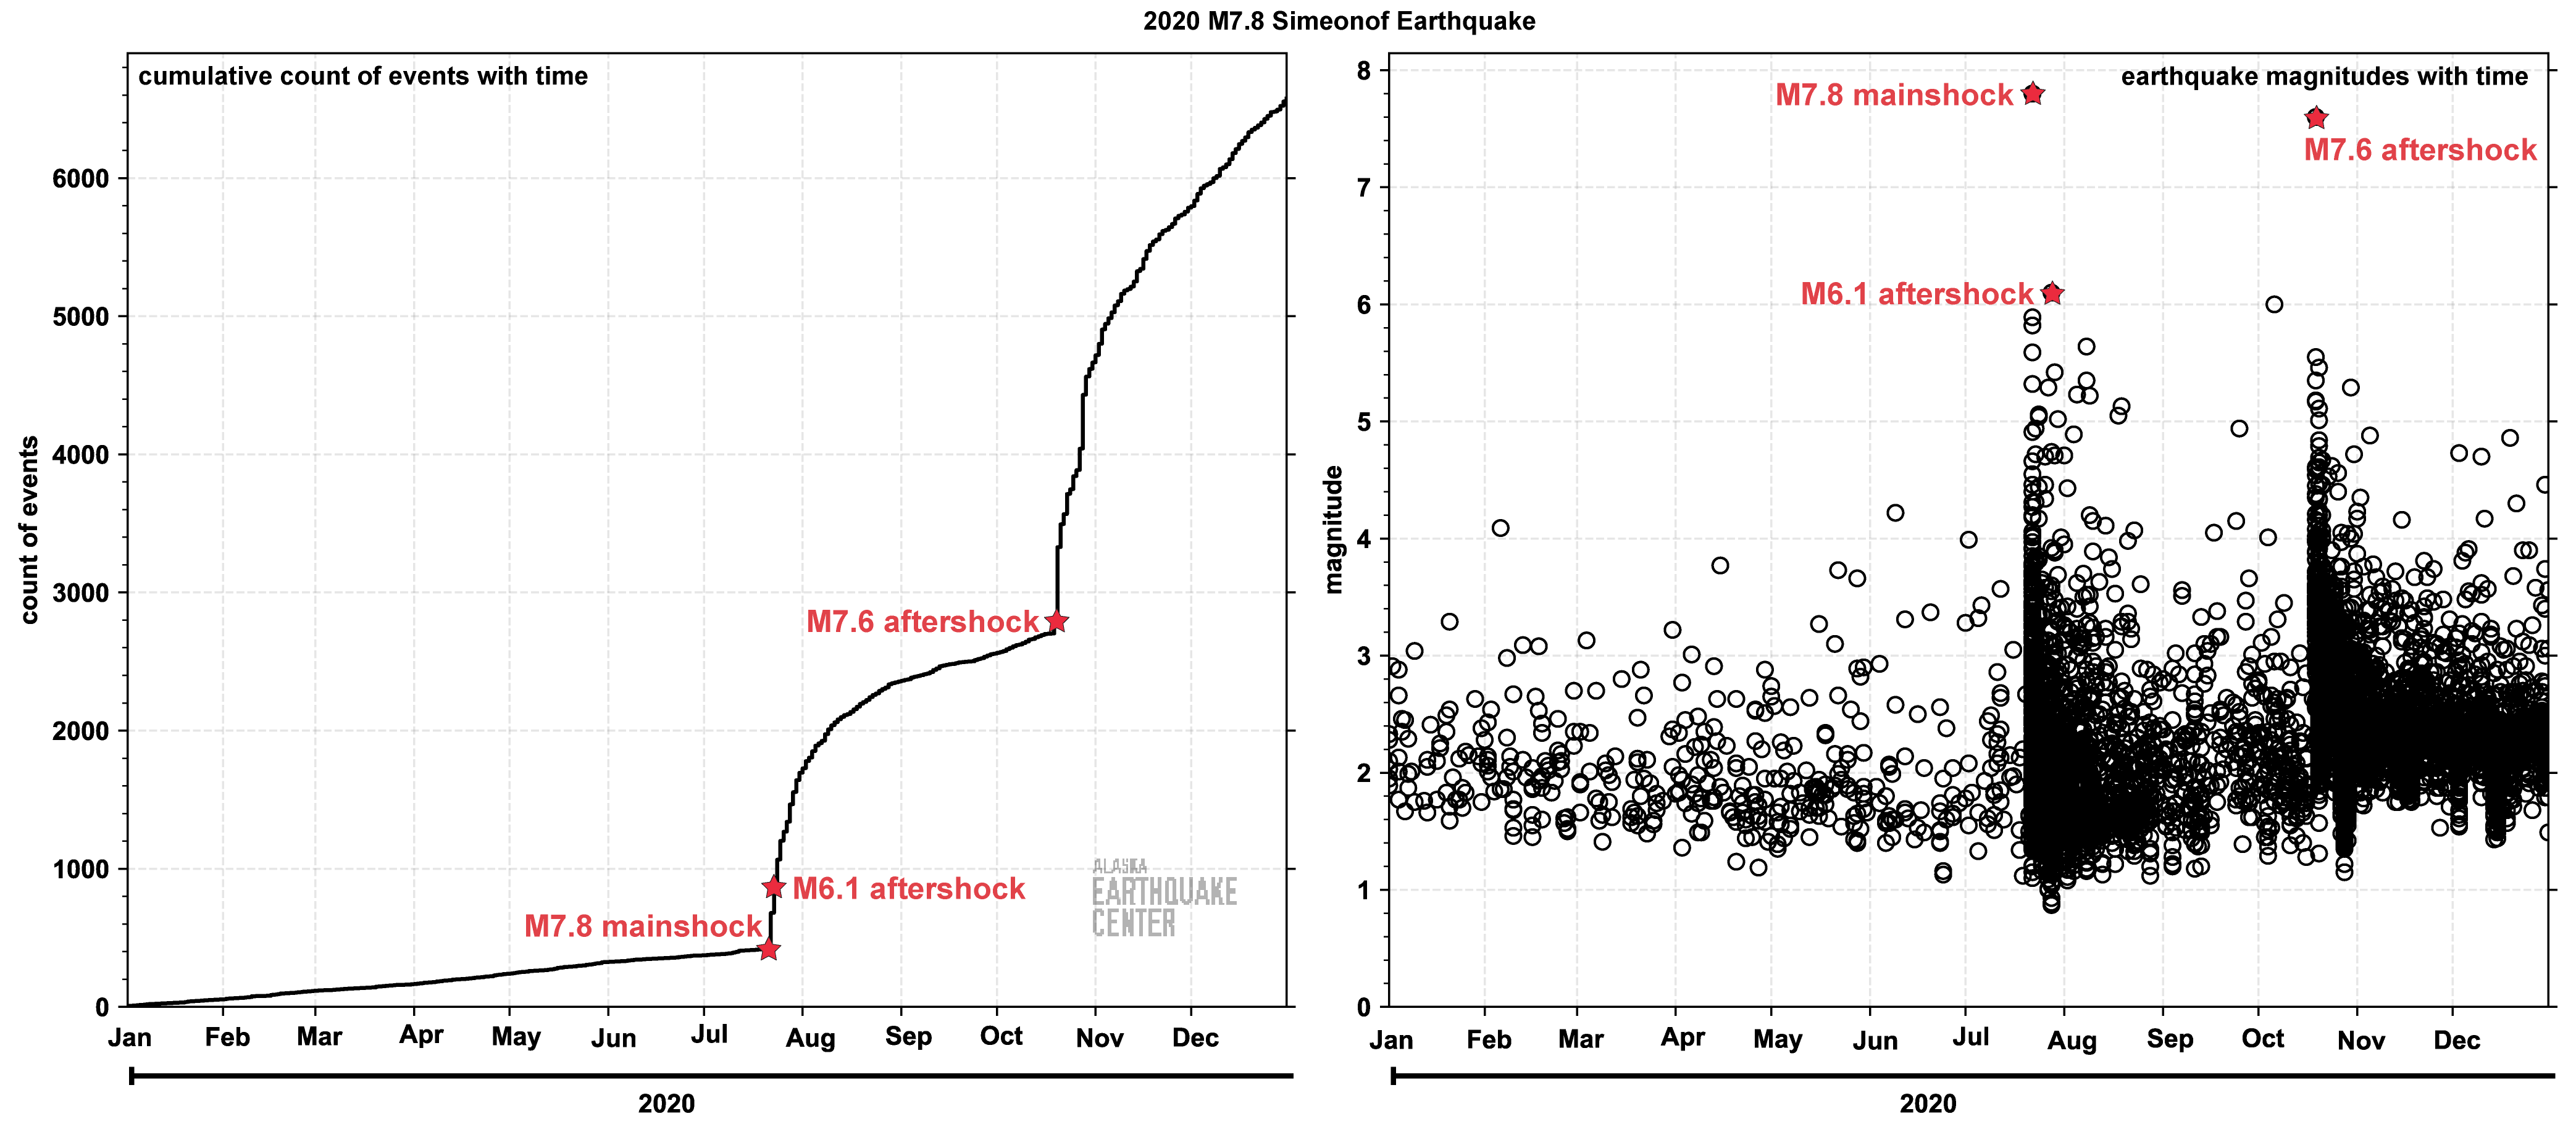
These two earthquakes were also some of the most scientifically interesting of 2020. Historically, large earthquakes have occurred along the Aleutian Islands chain, with the exception of the region near the Shumagin Islands. Seismologists have long suspected the “Shumagin Gap” would eventually experience a large earthquake. On July 22, a magnitude 7.8 earthquake struck the Shumagin Islands region, just south of Simeonof Island. On October 19, a magnitude 7.6 aftershock shook the region. The Simeonof earthquake series partially filled this long-recognized seismic gap.
There are more differences than similarities between the two earthquakes. The July M7.8 earthquake ruptured a section of the megathrust boundary between the subducting Pacific and overriding North American plates. The October rupture zone is much smaller than the M7.8 fault and located farther off-shore and closer to the ocean trench where the tectonic plates meet. The M7.6 earthquake had a different source mechanism (or faulting type) and was possibly associated with a fault inside the subducting Pacific plate rather than on the plate interface. Prior to the October 19 aftershock, we recorded over 2,200 aftershocks with the largest magnitude of 6.1. The M7.6 earthquake generated its own aftershock sequence, which has produced more aftershocks than the M7.8 sequence. Combined we have recorded more than 6,000 aftershocks (figure 3). We expect this Simeonof aftershock sequence to continue through most of 2021, at least.
To read more about this sequence visit the significant event page, M7.8 earthquake near Simeonof Island, M7.8 Simeonof Earthquake Recorded Globally and The unusual M7.6 aftershock of the M7.8 Simeonof earthquake.
2018 Anchorage Earthquake Aftershocks
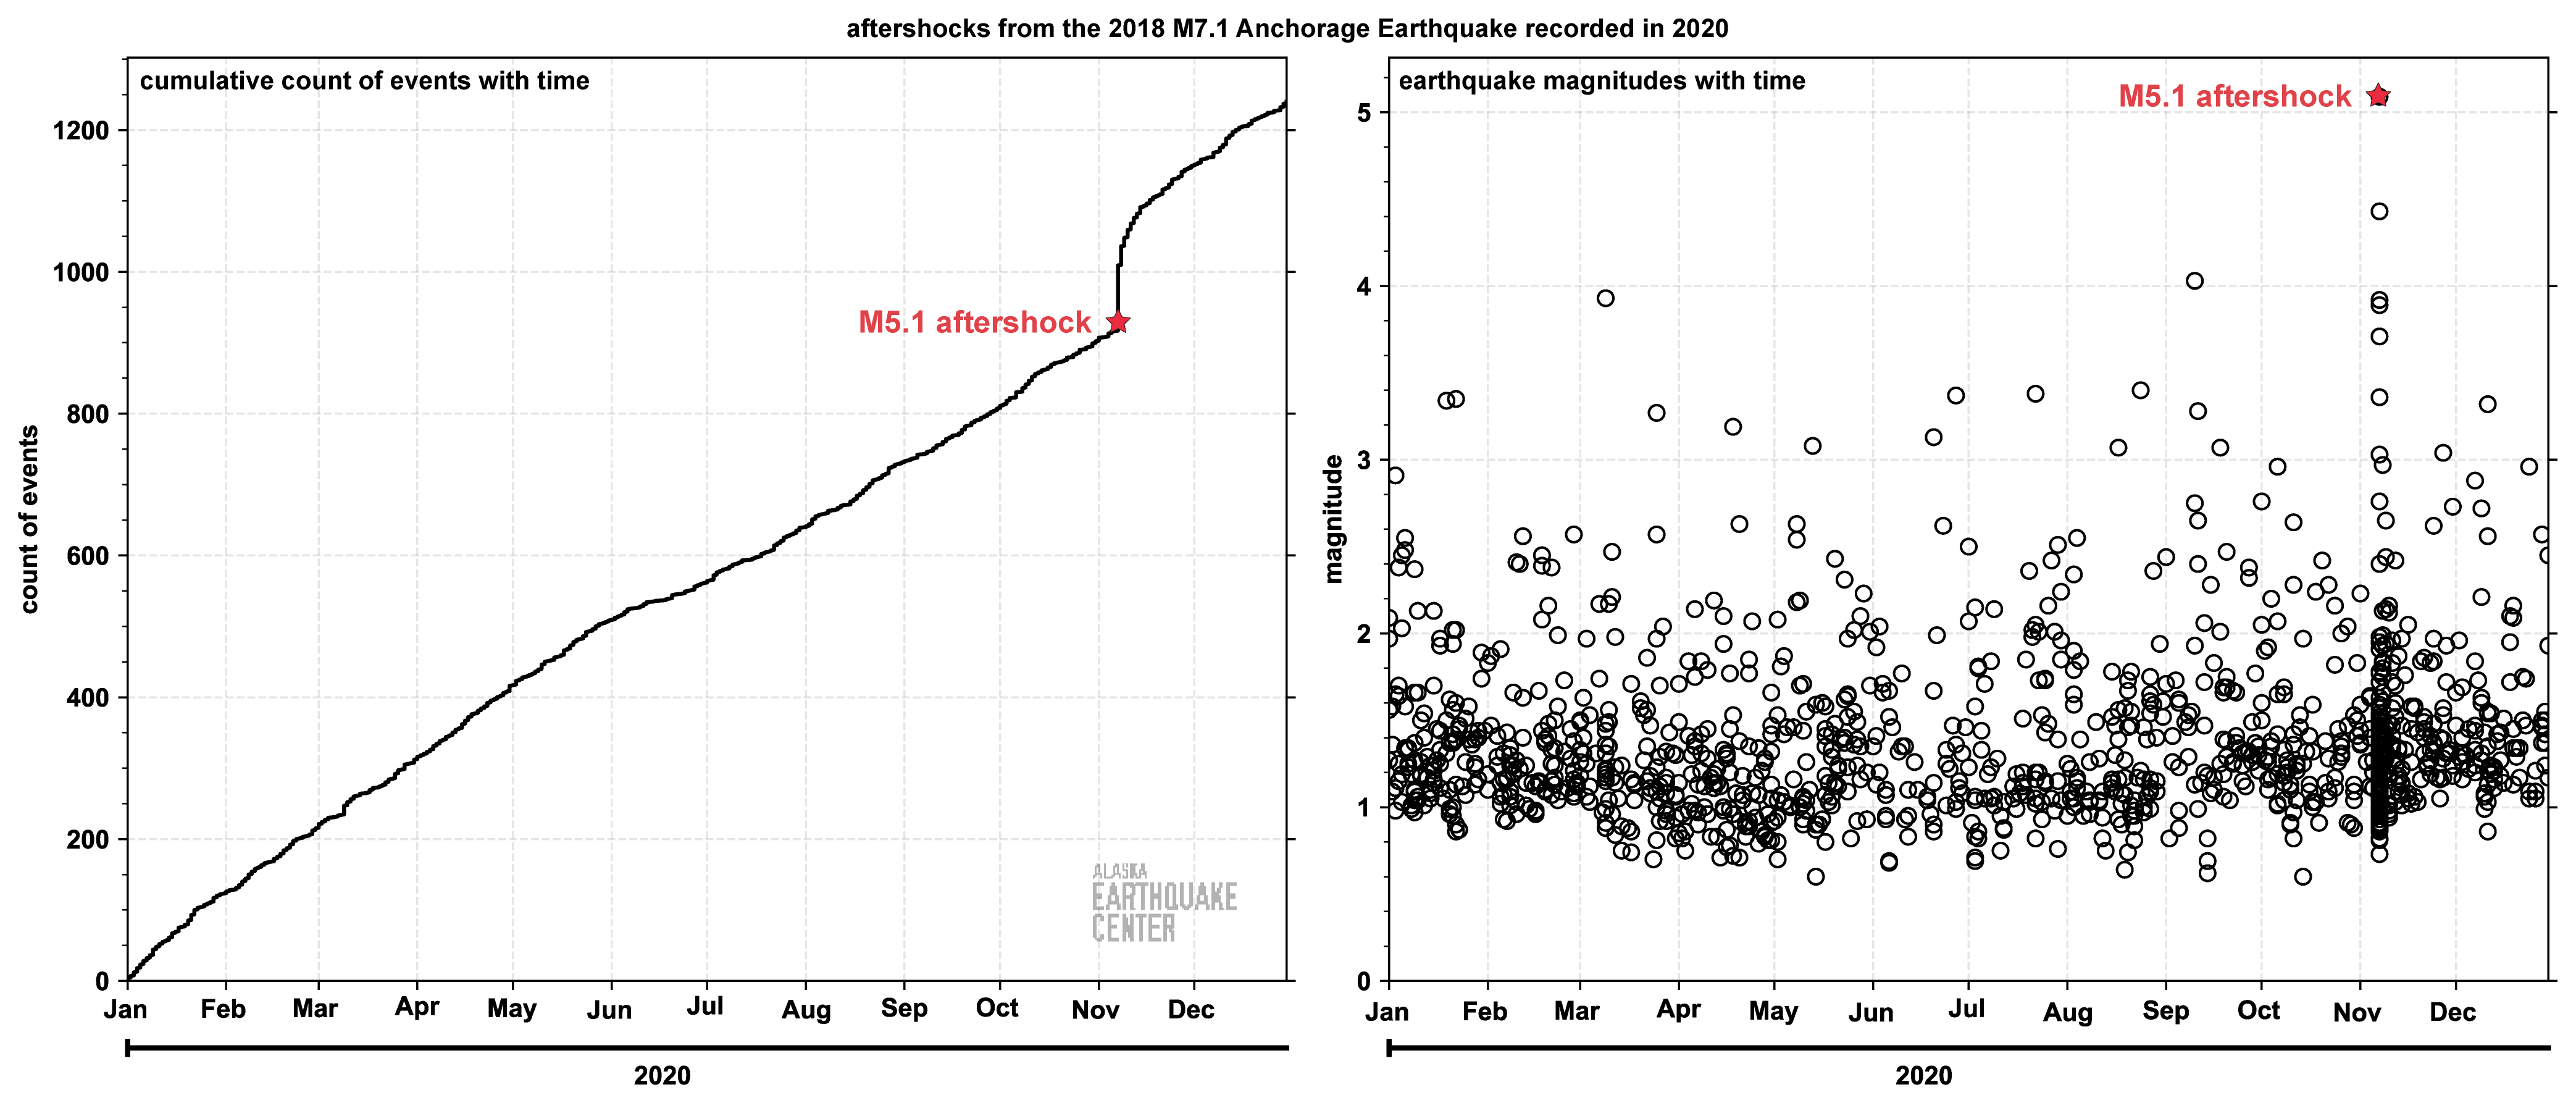
Aftershocks from the November 30, 2018 M7.1 Anchorage Earthquake continued into their second year at an average pace of about 26 earthquakes per week. Several days of renewed aftershock activity — spurred by a M5.1 aftershock on November 7 — were felt across Anchorage and the Mat-Su valley. Approximately 1,200 aftershocks were reported for 2020 (figure 4), bringing the total count to more than 12,000.
To read more about the M7.1 Anchorage Earthquake visit the significant event page or any of the web stories on our site including The Anchorage Earthquake: One Year Later.
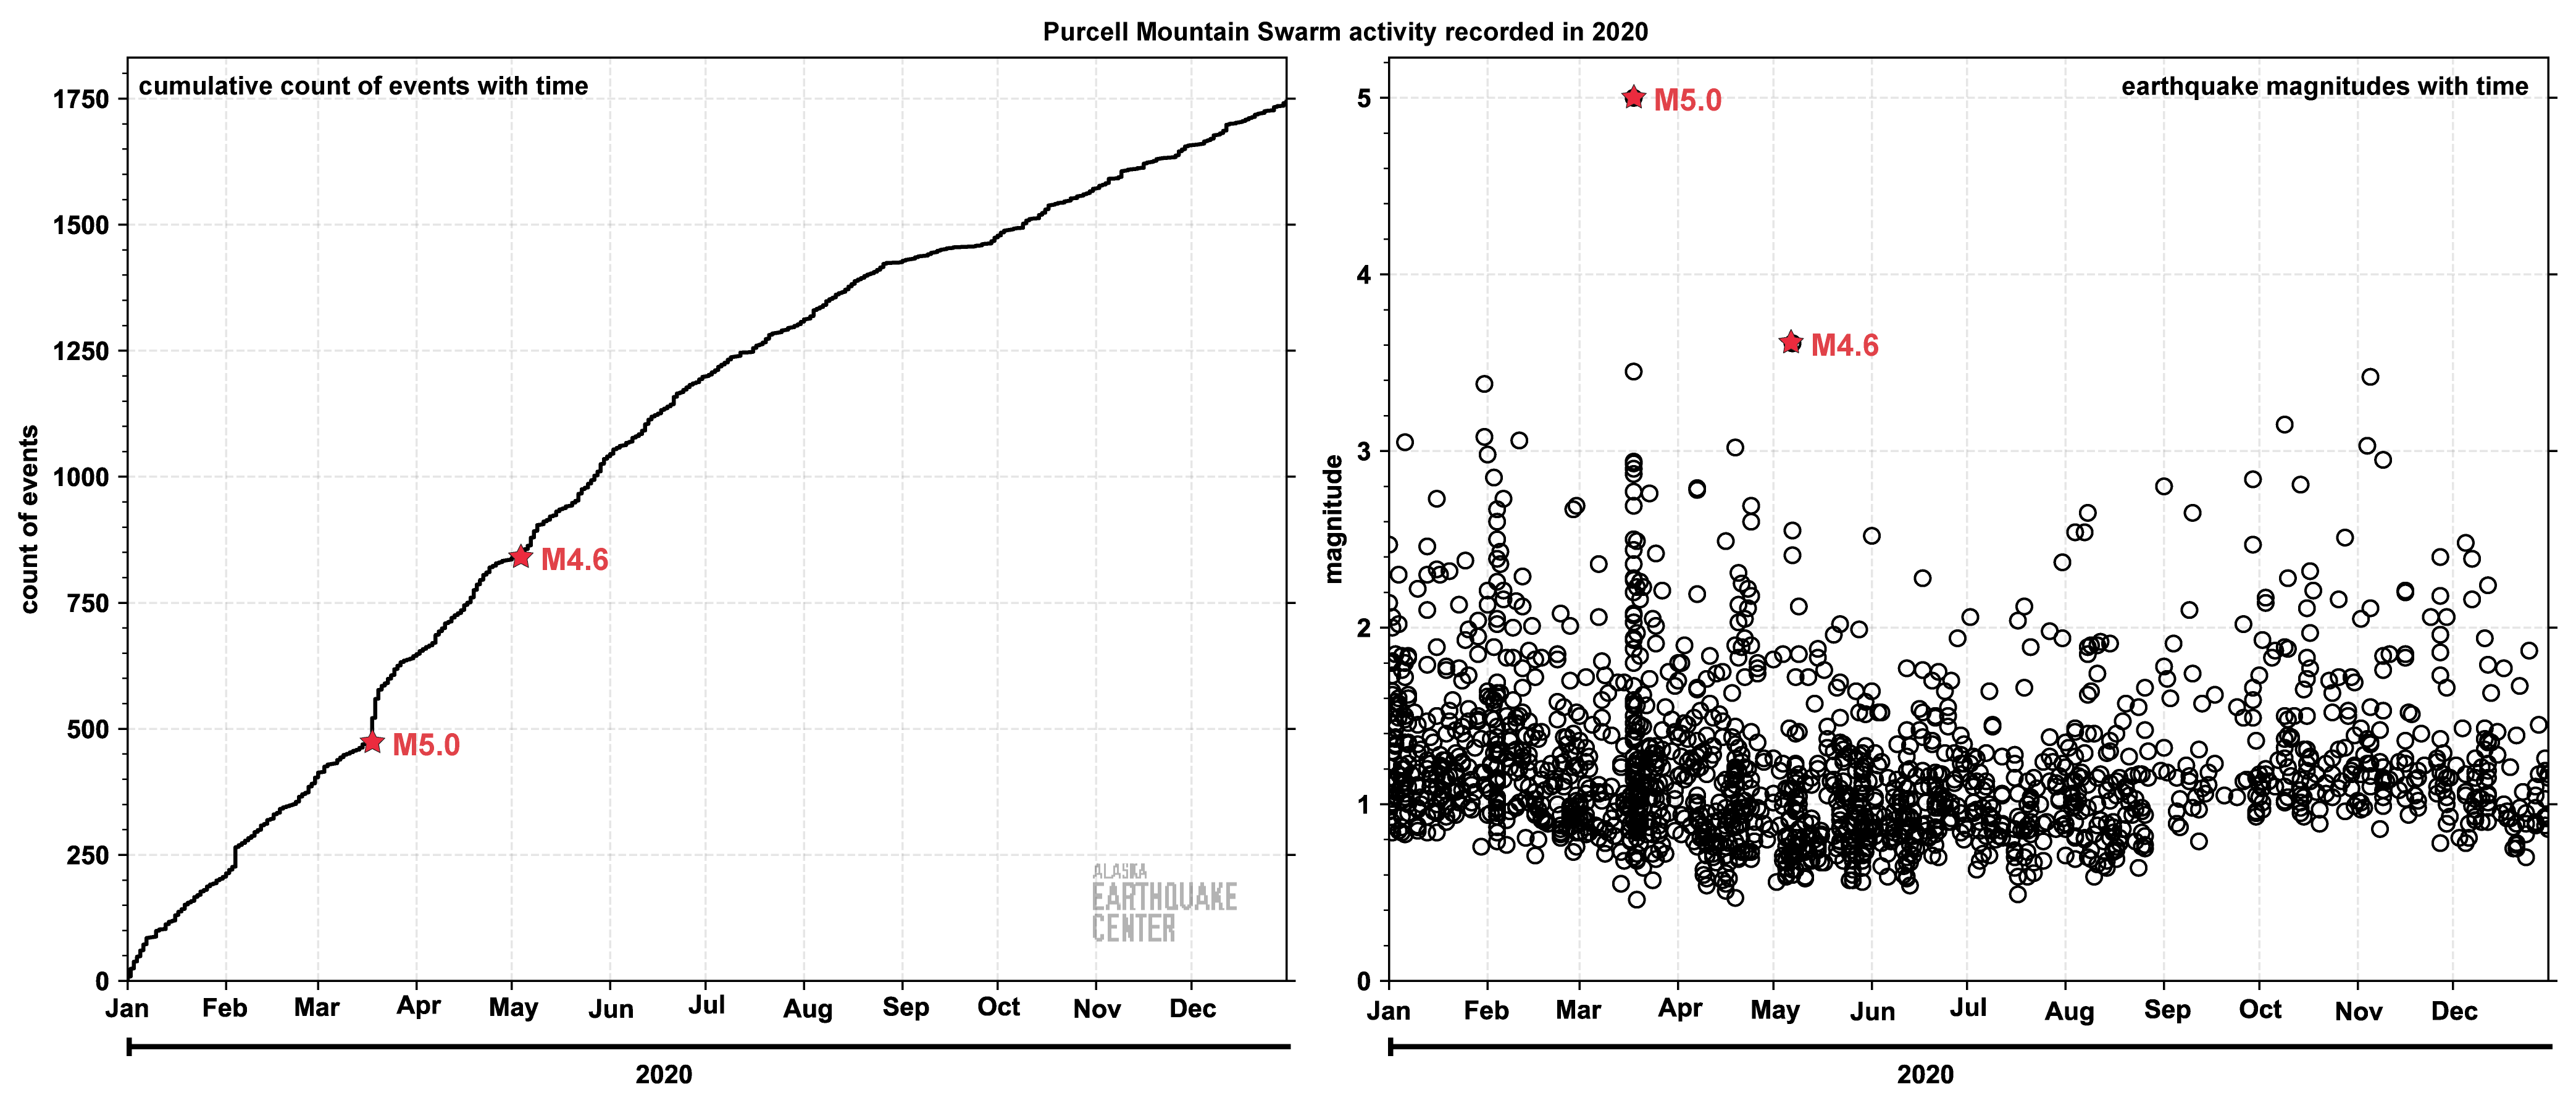
Purcell Mountain Swarm
The Purcell Mountains swarm, which began in March 2019, turned out to be the second largest contributor to the statewide earthquake total in 2020. Although less active than in 2019, in 2020 it continued at a steady pace of about 34 earthquakes per week (figure 5), bringing the sequence total to more than 8,000 events. The largest event in the swarm during 2020 was a M5 in March.
To read more about the swarm visit the significant event page, Checking in on Alaska's swarms and aftershocks or 2019 Is Runner Up for the Highest Number of Earthquakes: Alaska Seismicity Summary.
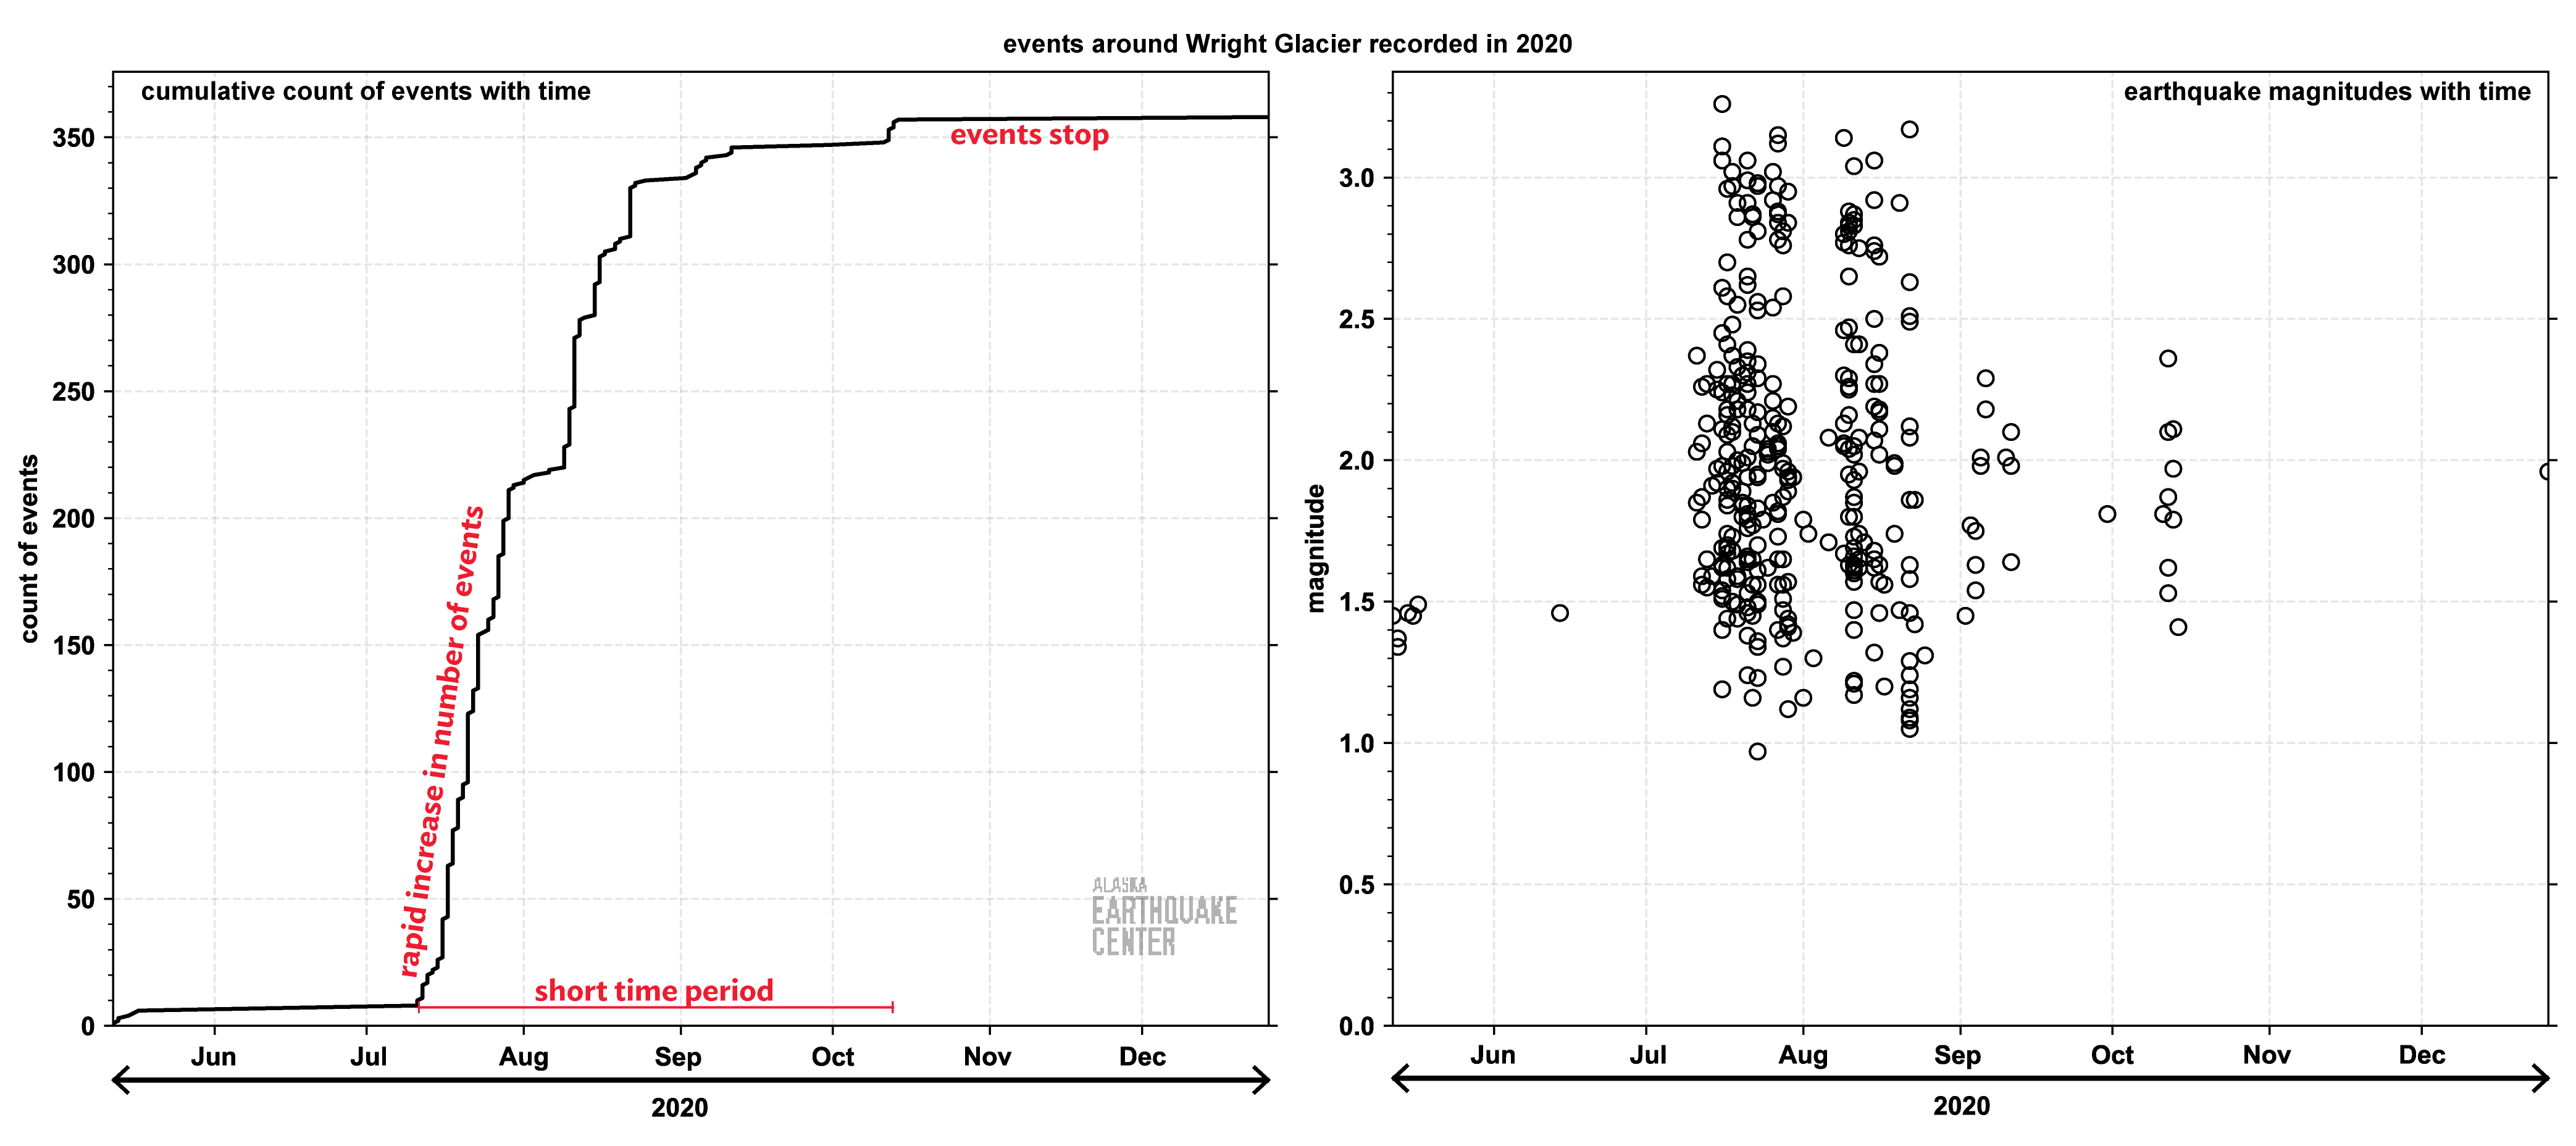
Wright Glacier Cluster
We normally record the majority of glacial activity in the state in the Prince William Sound region, Icy Bay, and Yakutat Bay. However, in 2020 an unusual cluster of approximately 350 glacial quakes occurred July-September under Wright Glacier about 40 miles northeast of Juneau (see figure 6). A few of these events reached magnitude between 3.0-3.4 and were felt in Juneau.
Read more about this cluster of events in What is causing seismicity near Mt. Ogden in Southeast Alaska?.
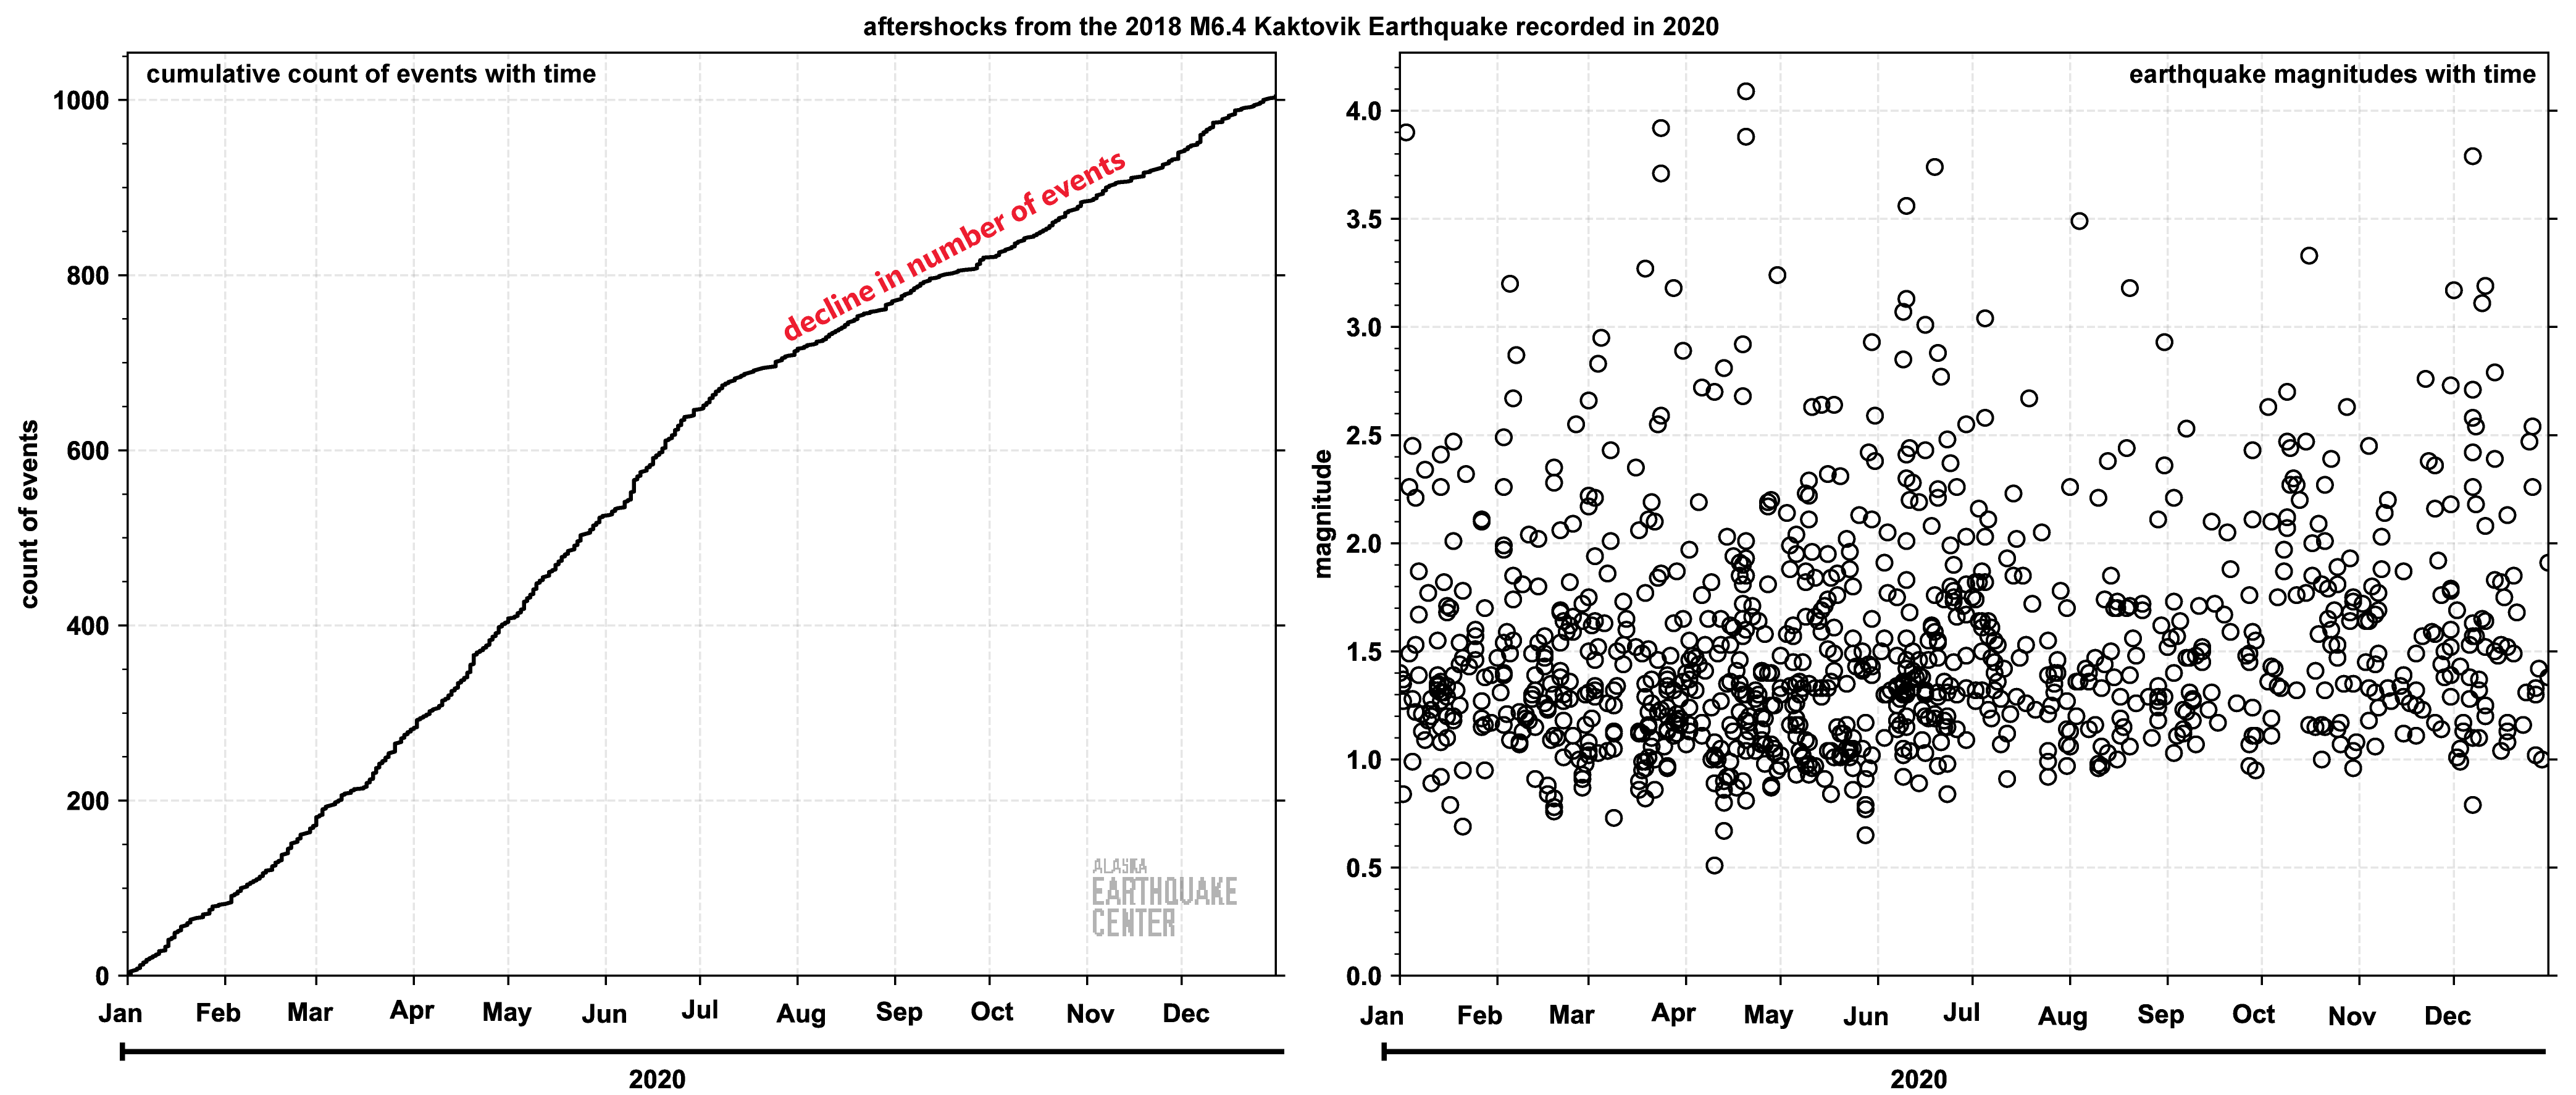
2018 Kaktovik Aftershocks
We continued to record aftershocks of the 2018 M6.4 Kaktovik Earthquake, the largest earthquake ever recorded on the North Slope. During 2020, we reported more than 260 earthquakes (figure 7), bringing the sequence up to approximately 8,700. We expect this to continue in 2021.
To read more about the 2018 Kaktovik Earthquake visit the significant event page and M6.4 Kaktovik earthquake: the largest ever on the North Slope.
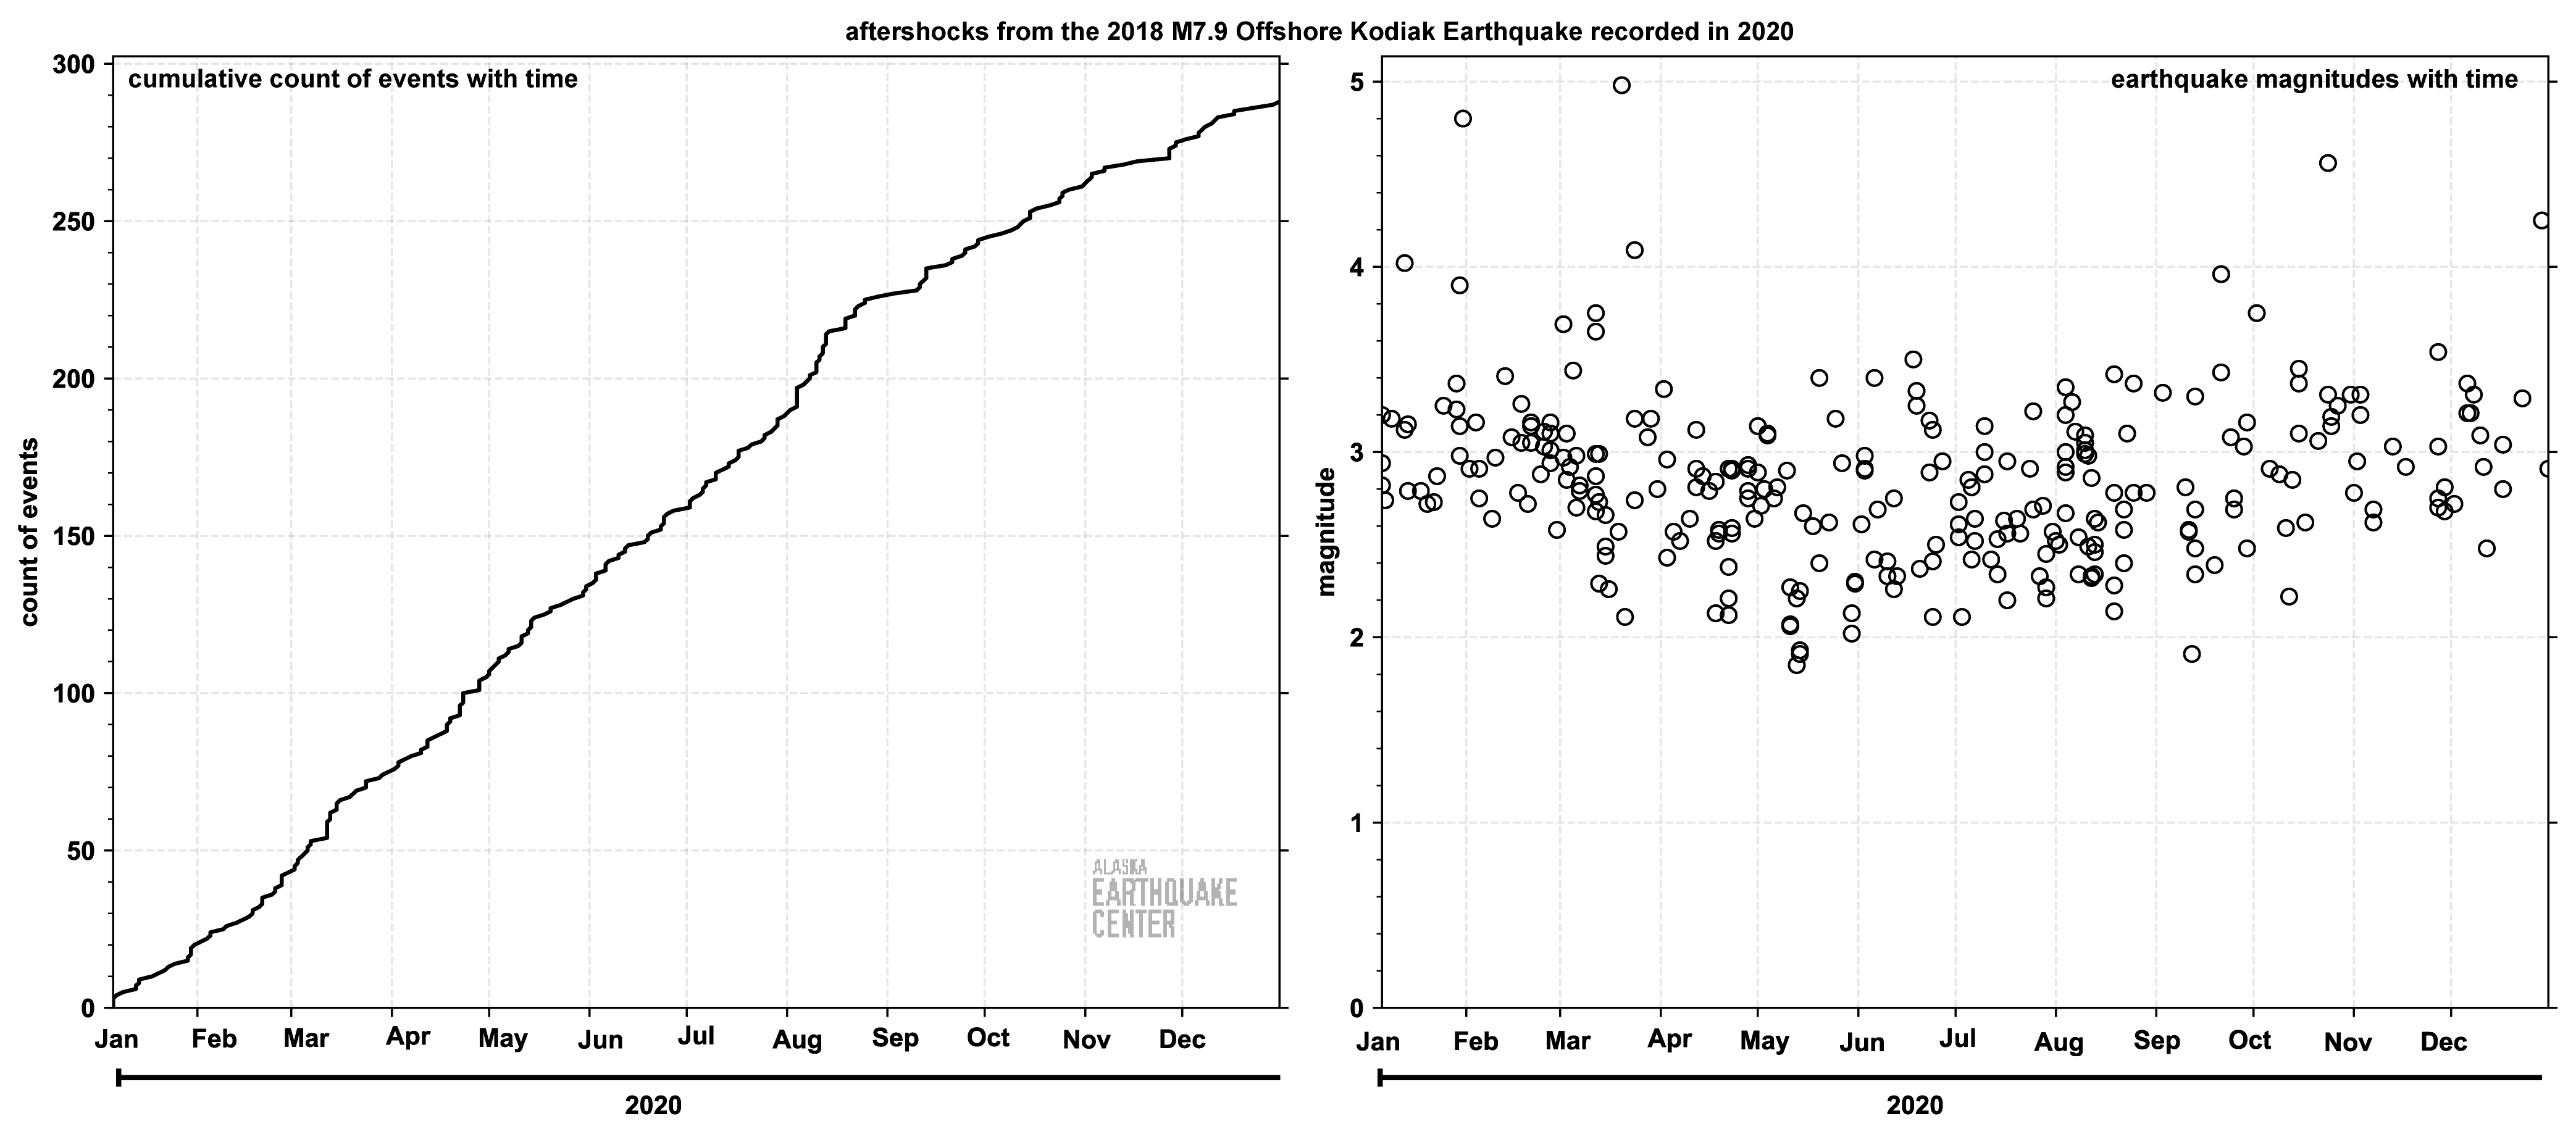
2018 Offshore Kodiak Aftershocks
We also continued to record aftershocks of the 2018 M7.9 Offshore Kodiak Earthquake sequence. In 2020 we added approximately 280 earthquakes (figure 8), bringing the total to more than 5,000 aftershocks. We expect this sequence to continue in 2021.
To read more about the Offshore Kodiak Earthquake sequence visit the significant event page, Overview of the Offshore Kodiak M7.9 earthquake, and Tsunami observations from the Offshore Kodiak earthquake.