As we slide into spring here in Alaska, memories of last year’s earthquakes and other remarkable seismic events are probably fading fast. It was a notable year for the Alaska Earthquake Center, mainly because we transitioned to a completely new system for receiving and analyzing earthquake information. That change (hard to encompass in one sentence) is described in this story on our new Gen 3 system. The changeover happened in November 2025, and in the leadup our analyst and systems teams worked hard to achieve a seamless rollover.
In the past few years, we’ve called out the total number of seismic events that Earthquake Center analysts process annually. The number is impressive—generally 35,000 to 55,000—but it also challenges us to consider what it means. Our ability to analyze a single seismic event below magnitude 1, for example, may not mean much to most Alaskans. In 2016, when the number of seismic stations in Alaska grew significantly, our data quality and coverage increased notably. But this turning point didn’t increase the number of annual events, it just meant that we could catch more and smaller events in our tighter net. Also impacting our totals each year is the occurrence of a large earthquake, after which the number of aftershocks can contribute tens of thousands of events to our catalog. 2018 stood out as a record-breaking seismic year because of the magnitude 7.9 Kodiak AND the magnitude 7.1 Anchorage earthquakes.
2025 was a slightly higher than average year
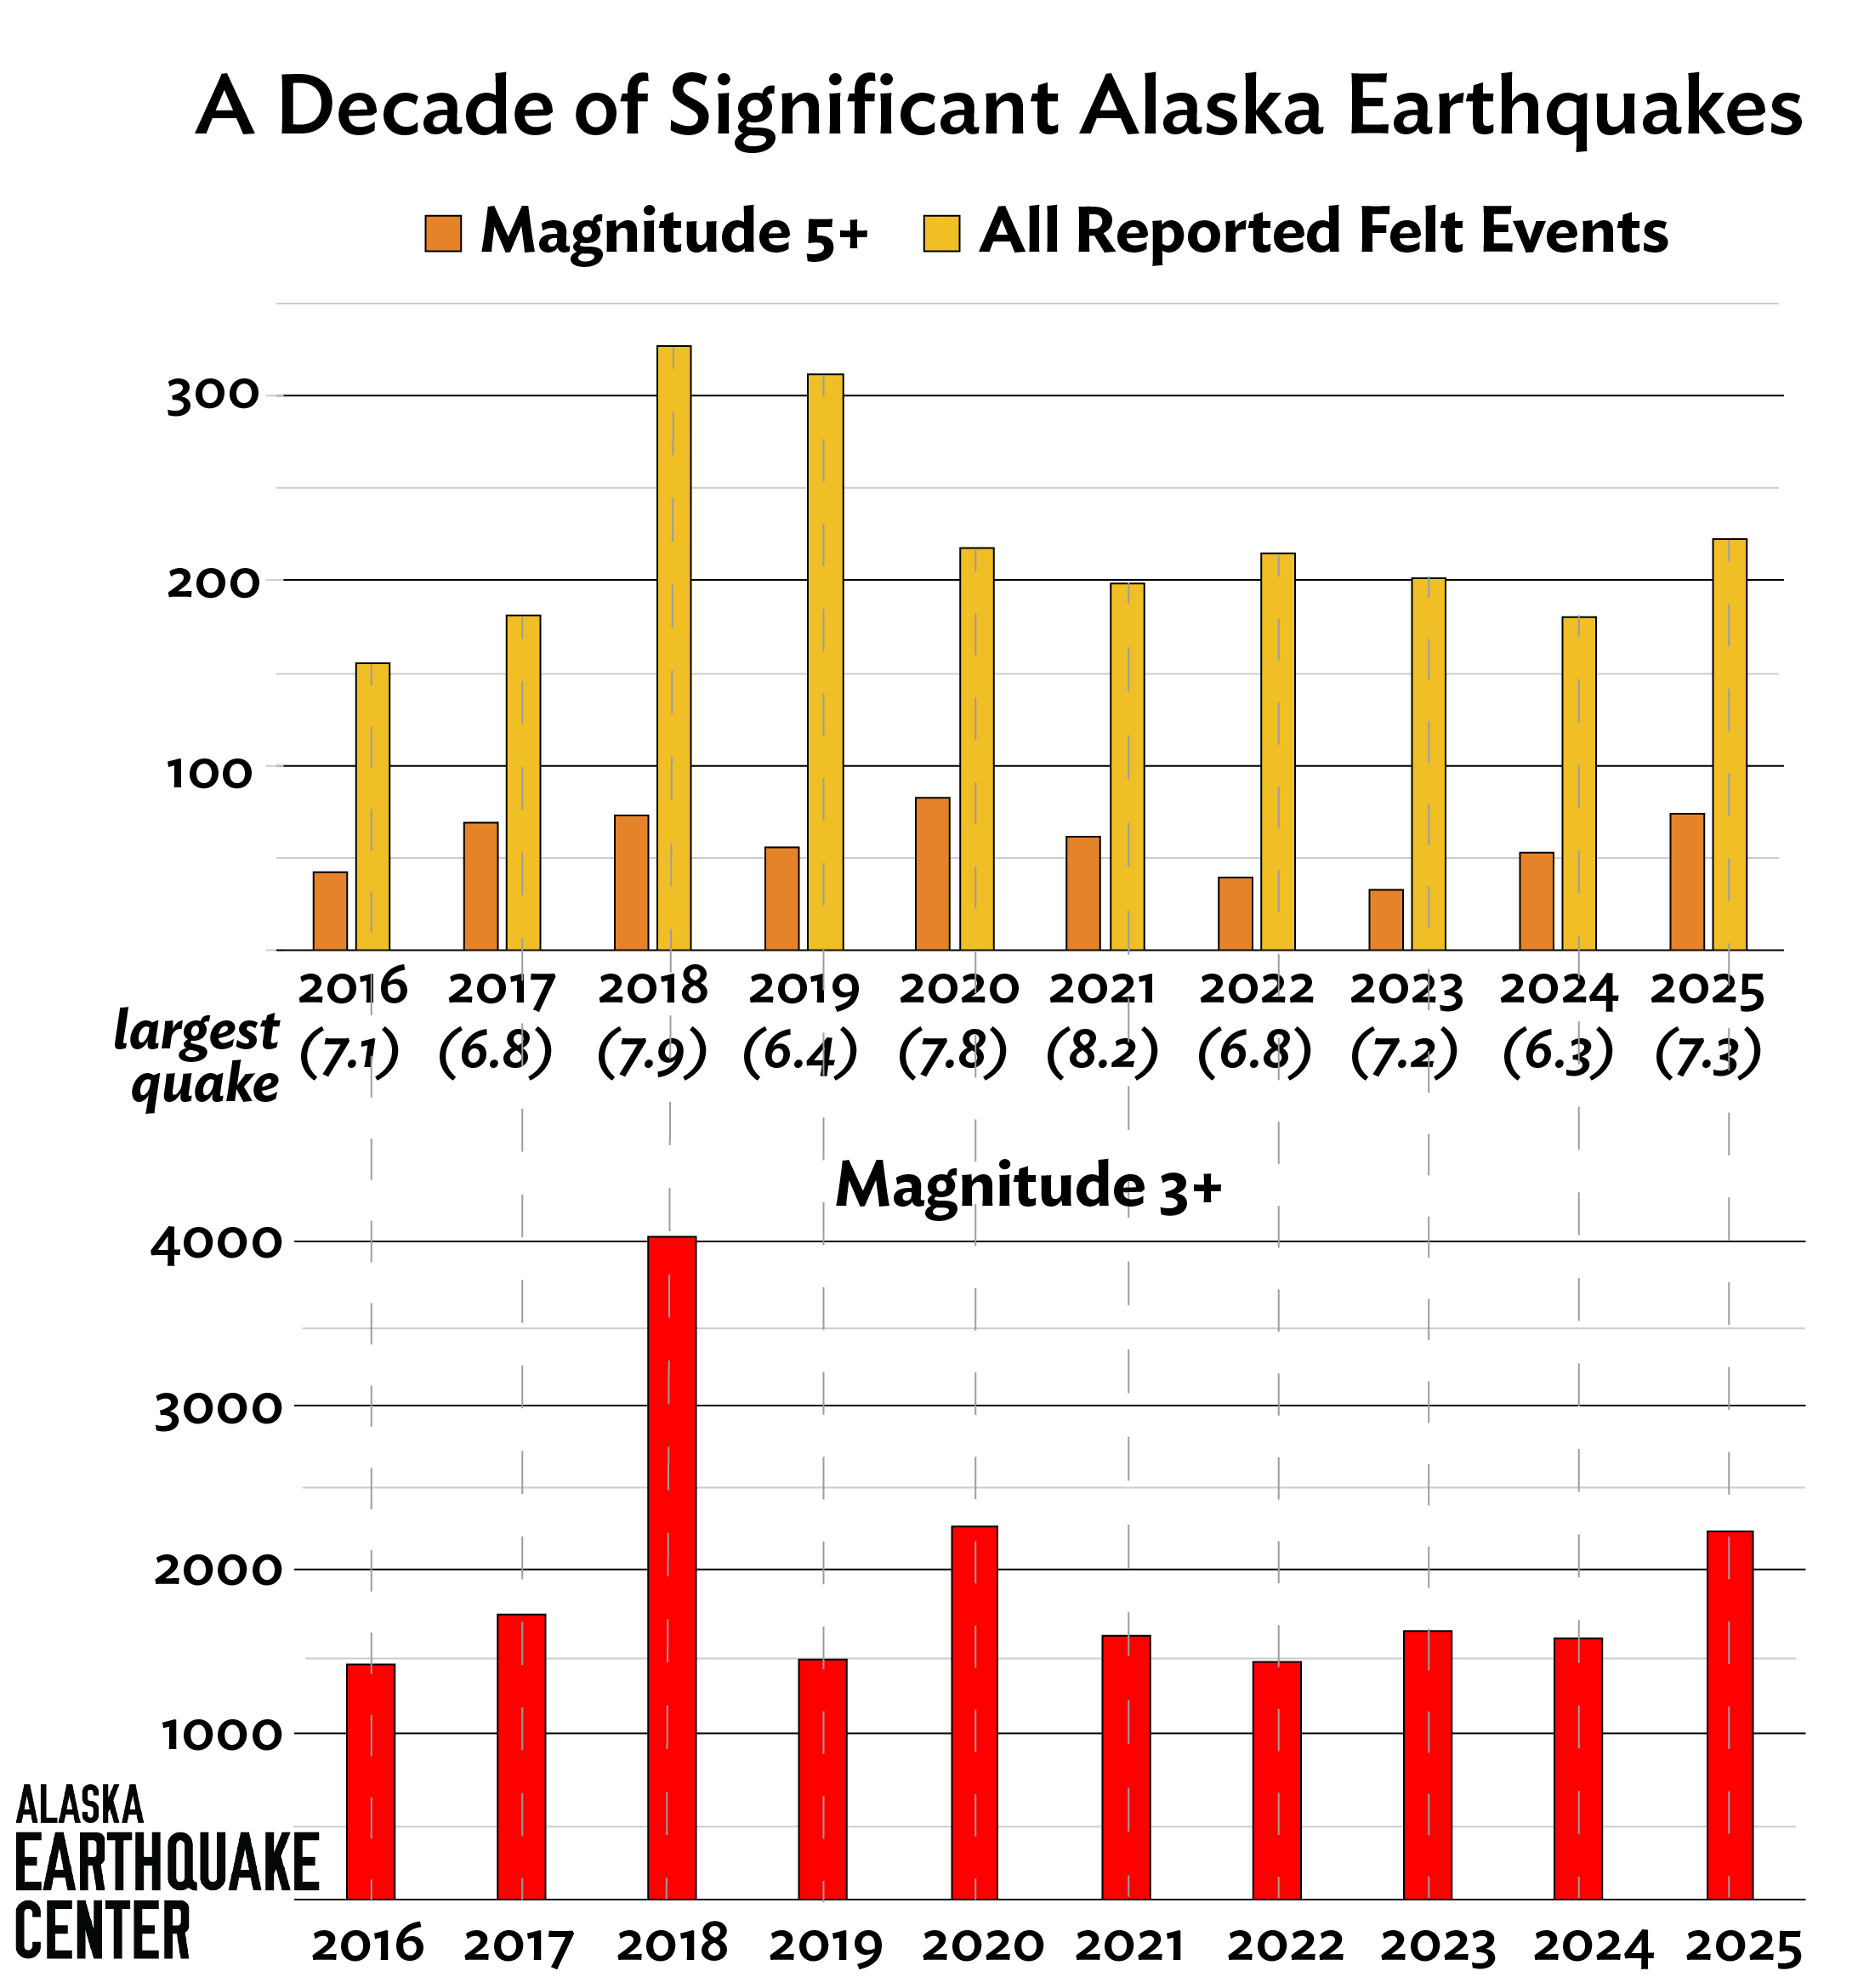
This year, we’re trying something a little different, showing you some trends in seismic activity (Figure 1) that rise above Alaska’s constant seismic pops.
A magnitude 3 earthquake, if it’s shallow, can generate enough shaking to make objects sway. The bottom part of Figure 2 shows the annual count of seismic events above magnitude 3 in Alaska—of any source detected by our seismic network—since 2016. Our average is close to 2,000 per year. 2018 really stands out, the result of two earthquakes above magnitude 7 generating plentiful aftershocks. 2025 was a bit above average, as was 2020.
The top part of Figure 2 shows a decade of events that at least two people reported they felt. Since 2016, about 200 events each year are reported felt somewhere in the state. Notice that in 2018 and 2019, this number rose significantly, as aftershocks from the Anchorage earthquake continuously rattled our most populous region. The number of felt reports in 2025 was just above our decadal average.
The top part of Figure 2 also shows the 10-year trends in earthquakes above magnitude 5, which are significant enough to cause major damage in other parts of the world. Alaska continues to average 50–75 of these per year, with 2025 at the higher end of the average.
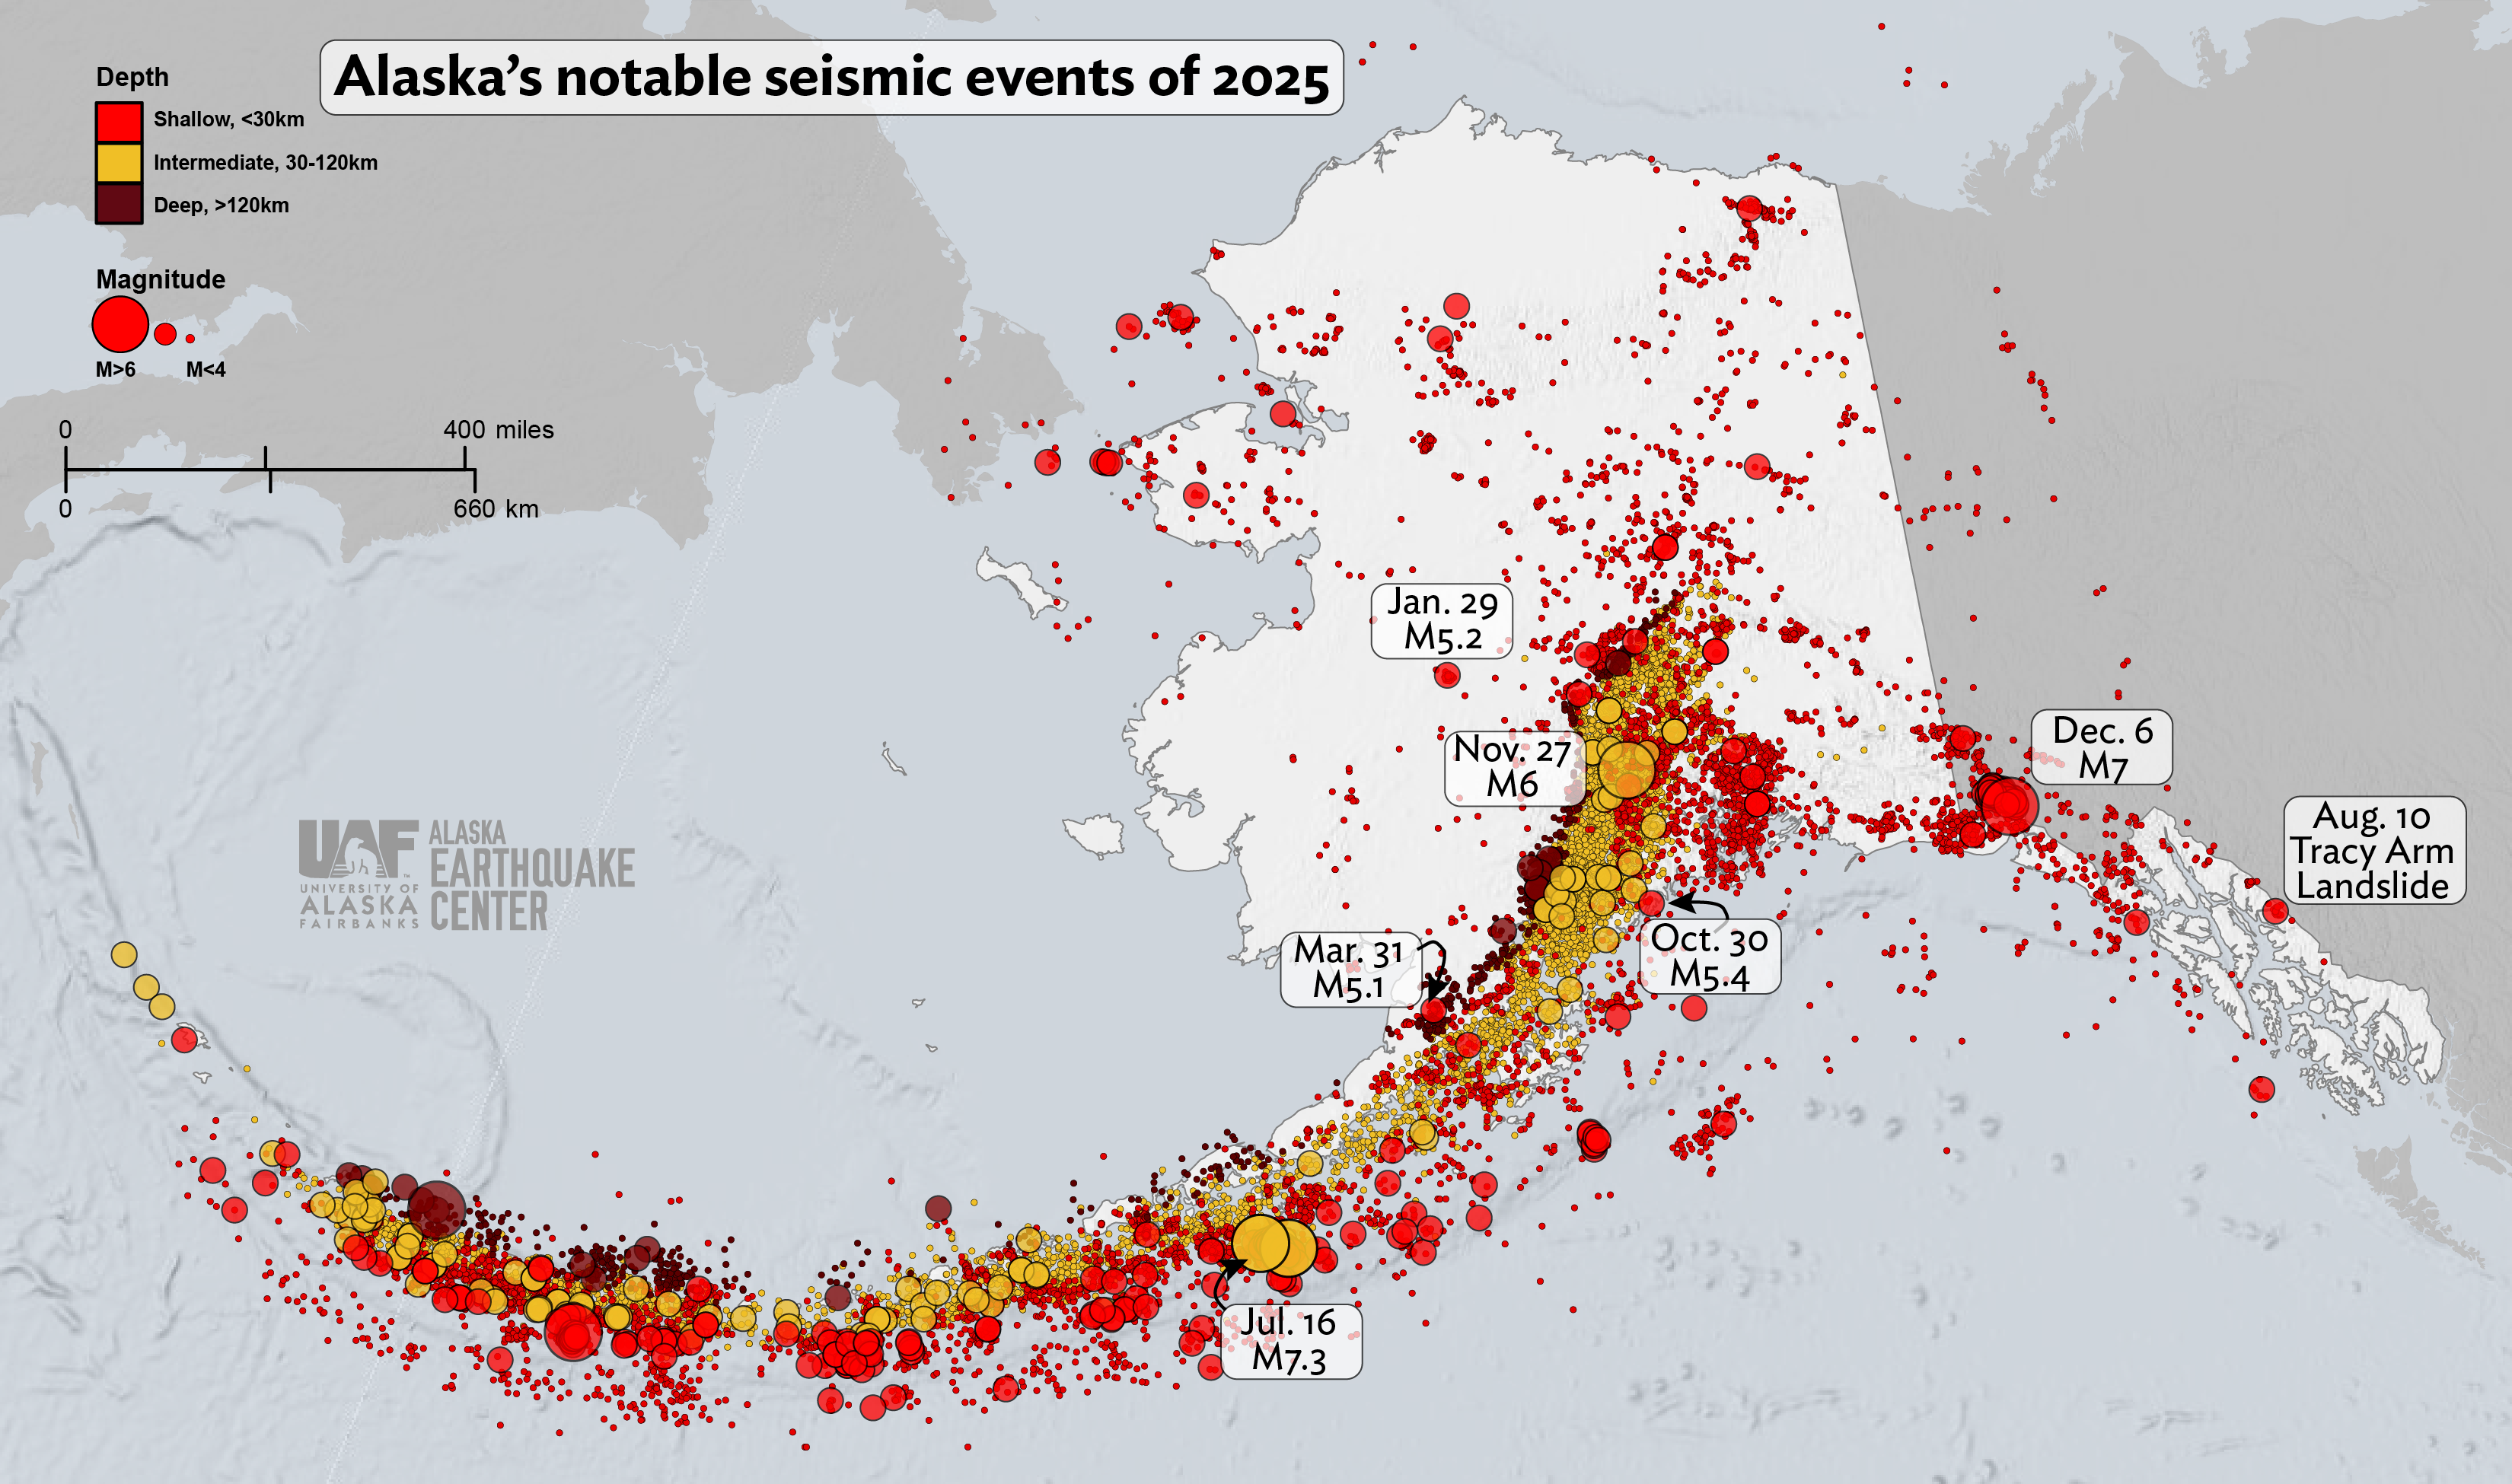
2025 kicked off with one of these, a magnitude 5.2 on January 29 on a fault in Southcentral Alaska near McGrath that has been quiet since 1935. In April, detailed characterization of a magnitude 5.1 earthquake—enabled by our station coverage in the area—helped validate the active status of a fault in the Alaska Peninsula. And, in October, a magnitude 5.4 shaker near Seward reminded us why we are working to bring earthquake early warning to Alaska.
Notable seismic events of 2025
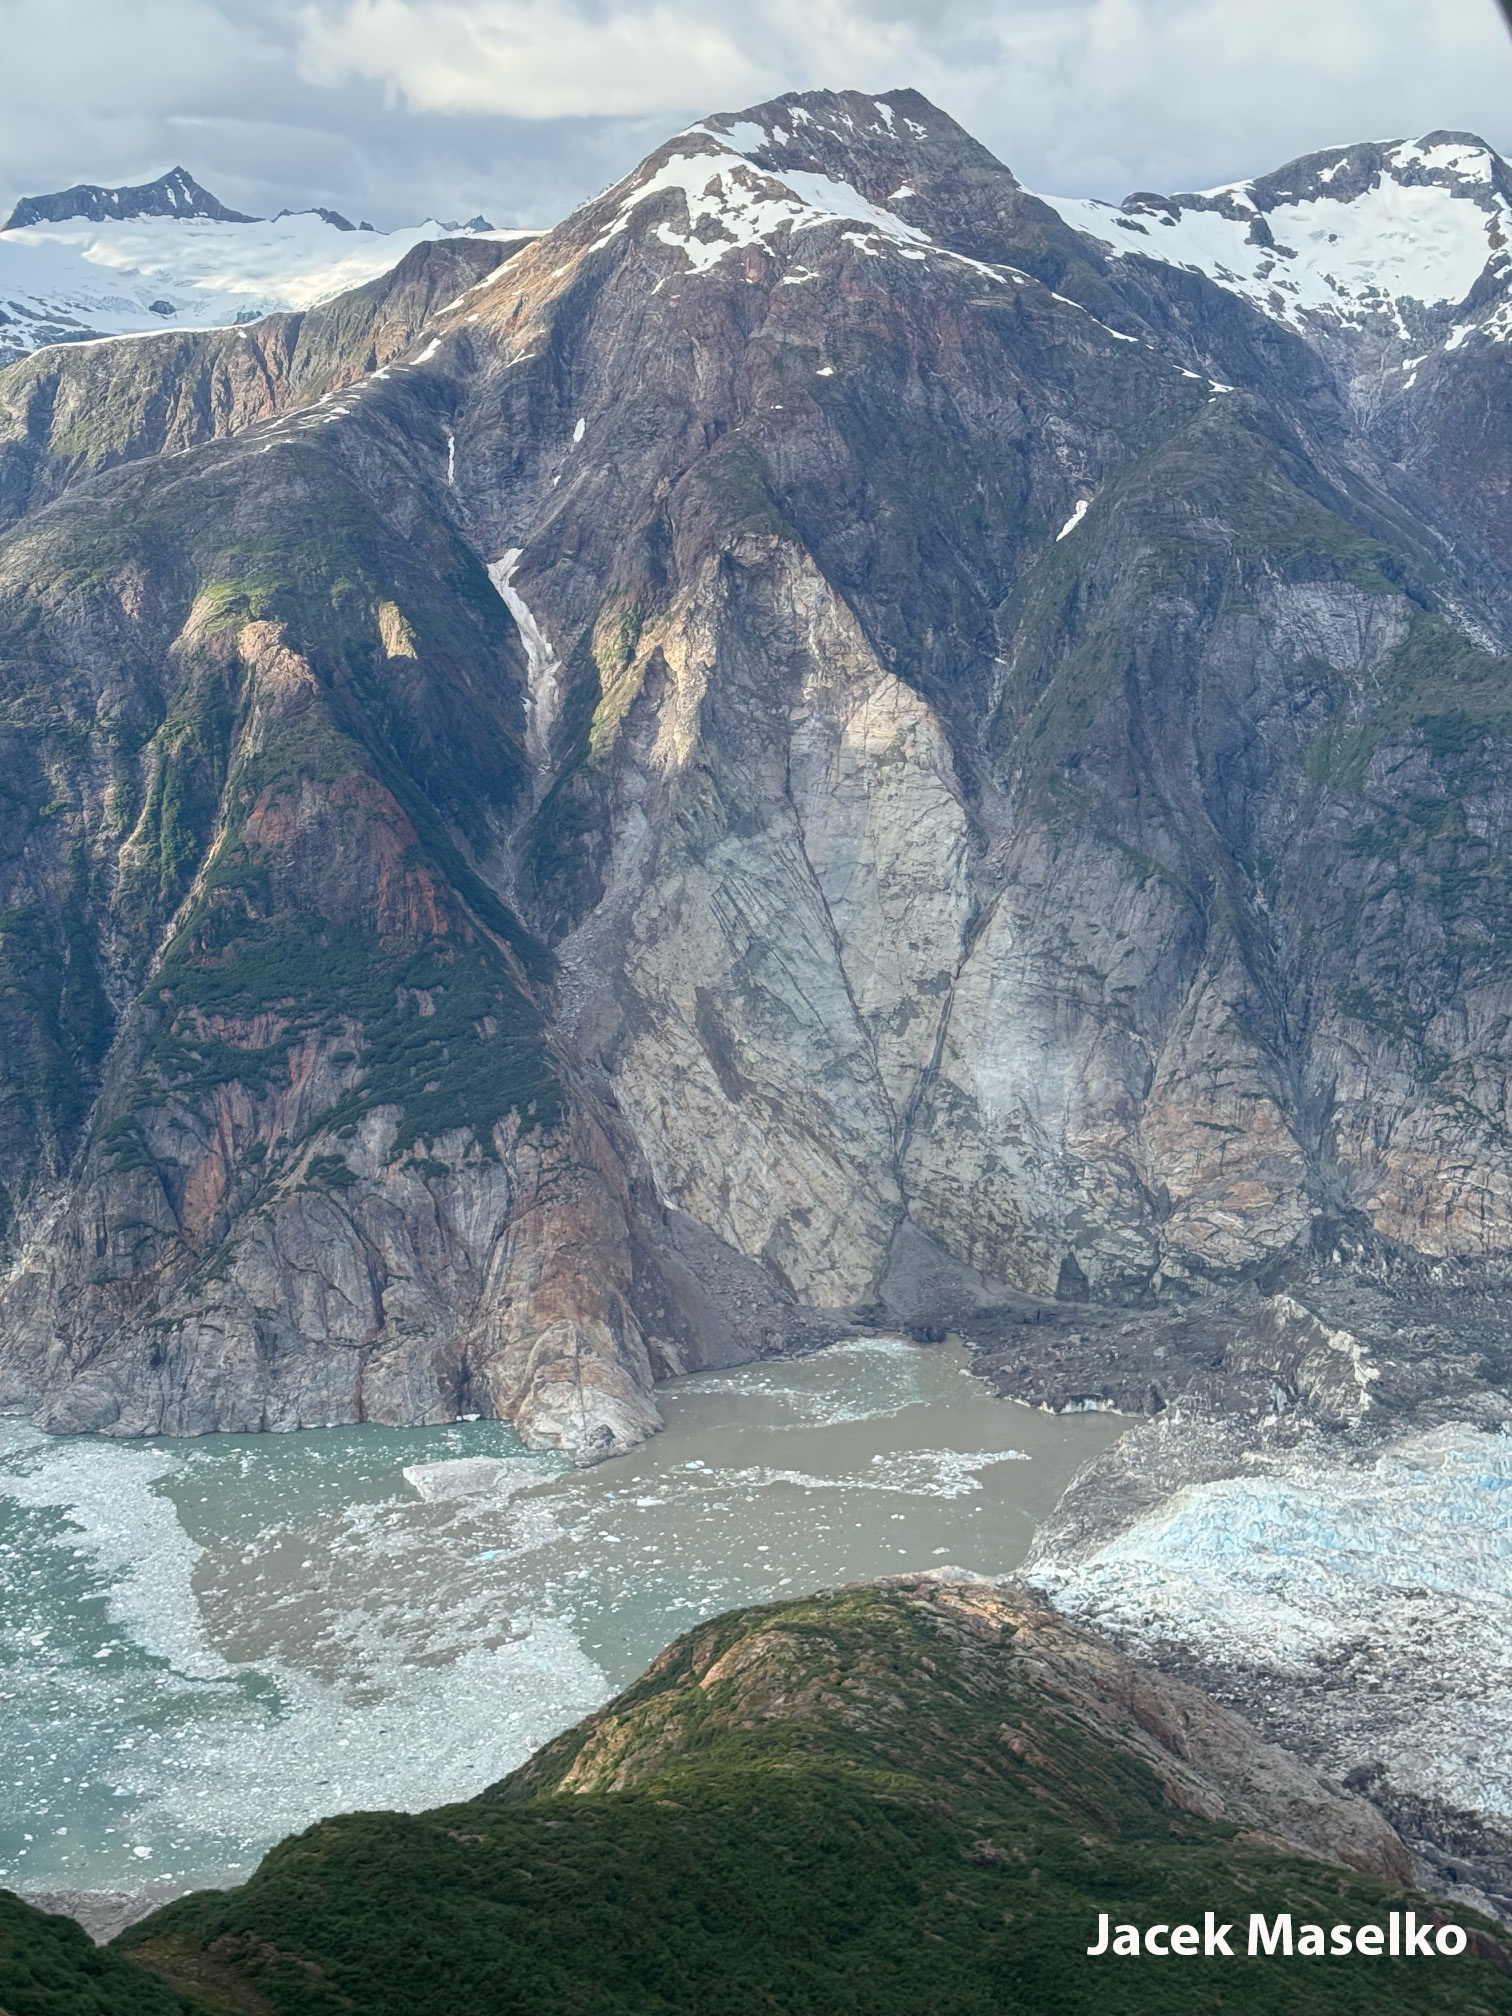
Tracy Arm Landslide
If you revisited the 2024 seismicity year in review, you’d notice that icequakes, landslides, quarry blasts, and volcanic events tend to fall below magnitude 3. In 2025, the Tracy Arm Landslide broke this trend, generating the seismic energy equivalent to a magnitude 5.4 earthquake.
In the wee hours of August 10, about 100 million cubic meters of rock tore loose, collapsed onto and broke asunder the toe of the South Sawyer Glacier, sending a tsunami runup of about 1,600 feet across the fjord (Figure 3). Alaska Earthquake Center landslide specialist Ezgi Karasözen, using our dedicated landslide detection system, was the first to locate the slide and estimate its volume. Earthquake Center seismologists have since been studying unusually energetic precursory seismic activity from the area, which was recorded by seismometers up to hundreds of miles away.
As of this writing, two major cruise lines have eliminated their Tracy Arm stop as a result of the landslide.
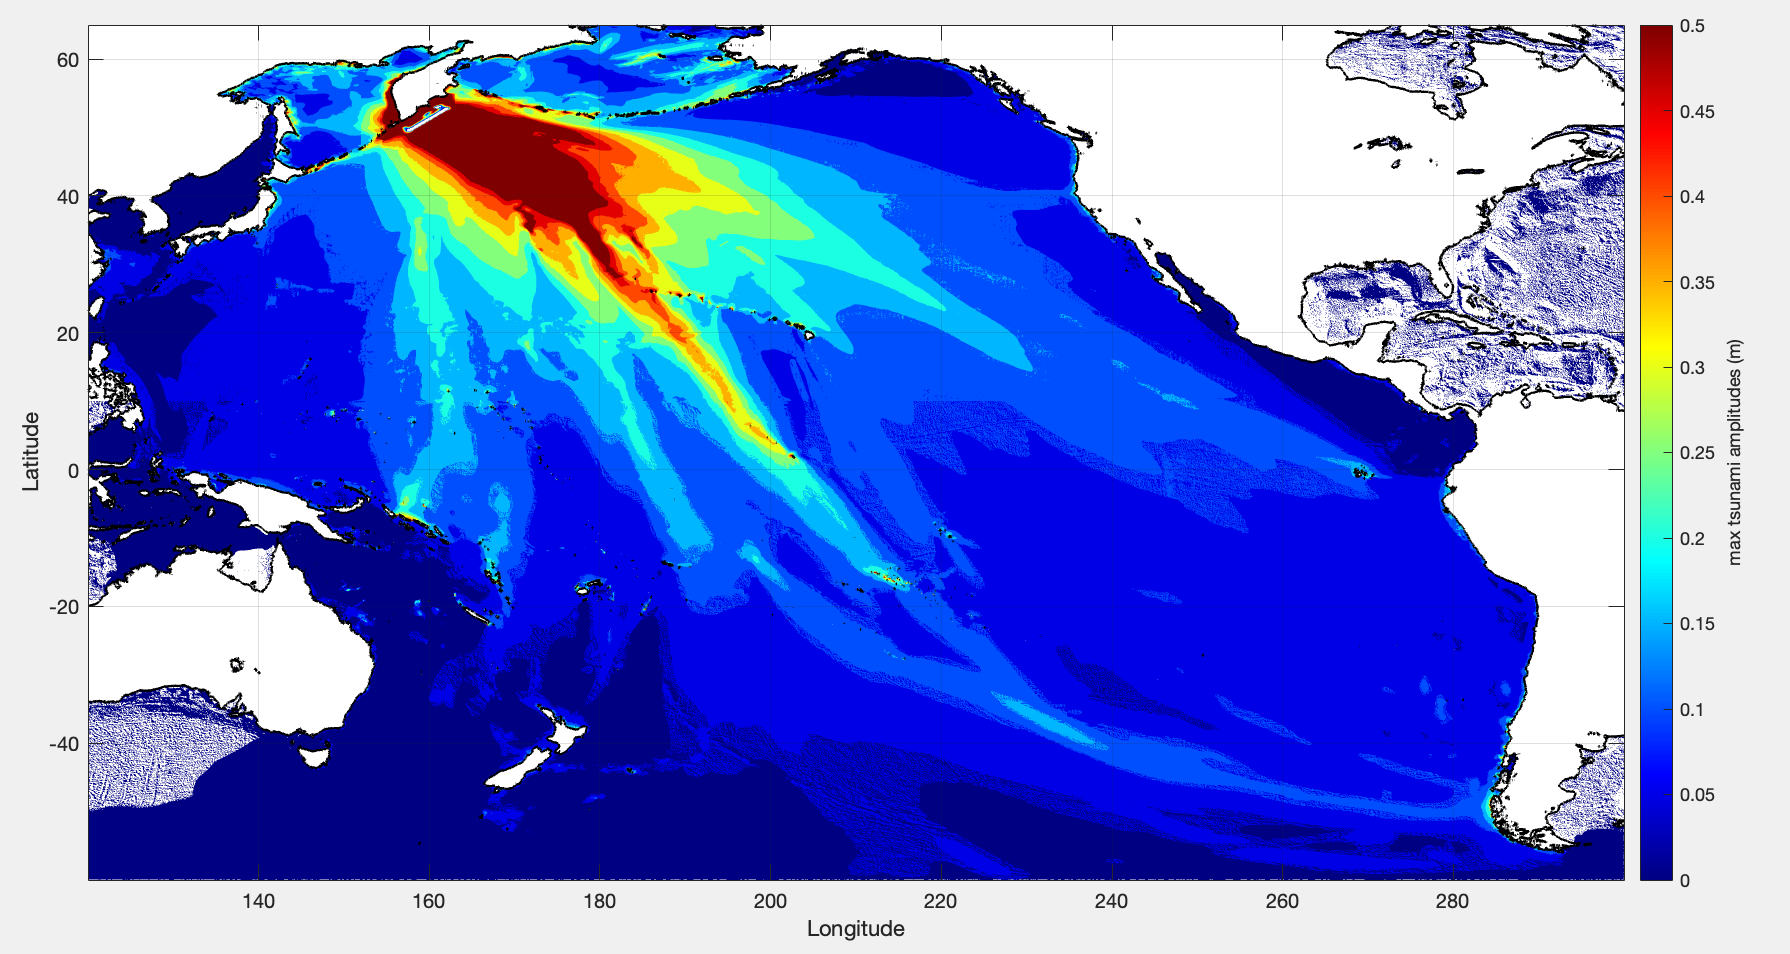
Kamchatka Tsunami
Speaking of tsunamis, the largest seismic tsunami to hit Alaska in 2025 actually came from Russia. On July 29, a magnitude 8.8 earthquake (now tied as the 6th-largest recorded in the world) generated a tsunami that crossed the Pacific. The largest wave height recorded in Alaska was about 3 feet, in Adak.
Elena Troshina, a tsunami specialist with the Alaska Earthquake Center, modeled the maximum tsunami heights across the Pacific (Figure 4) and reminded coastal residents that even a one-foot tsunami can cause destruction.
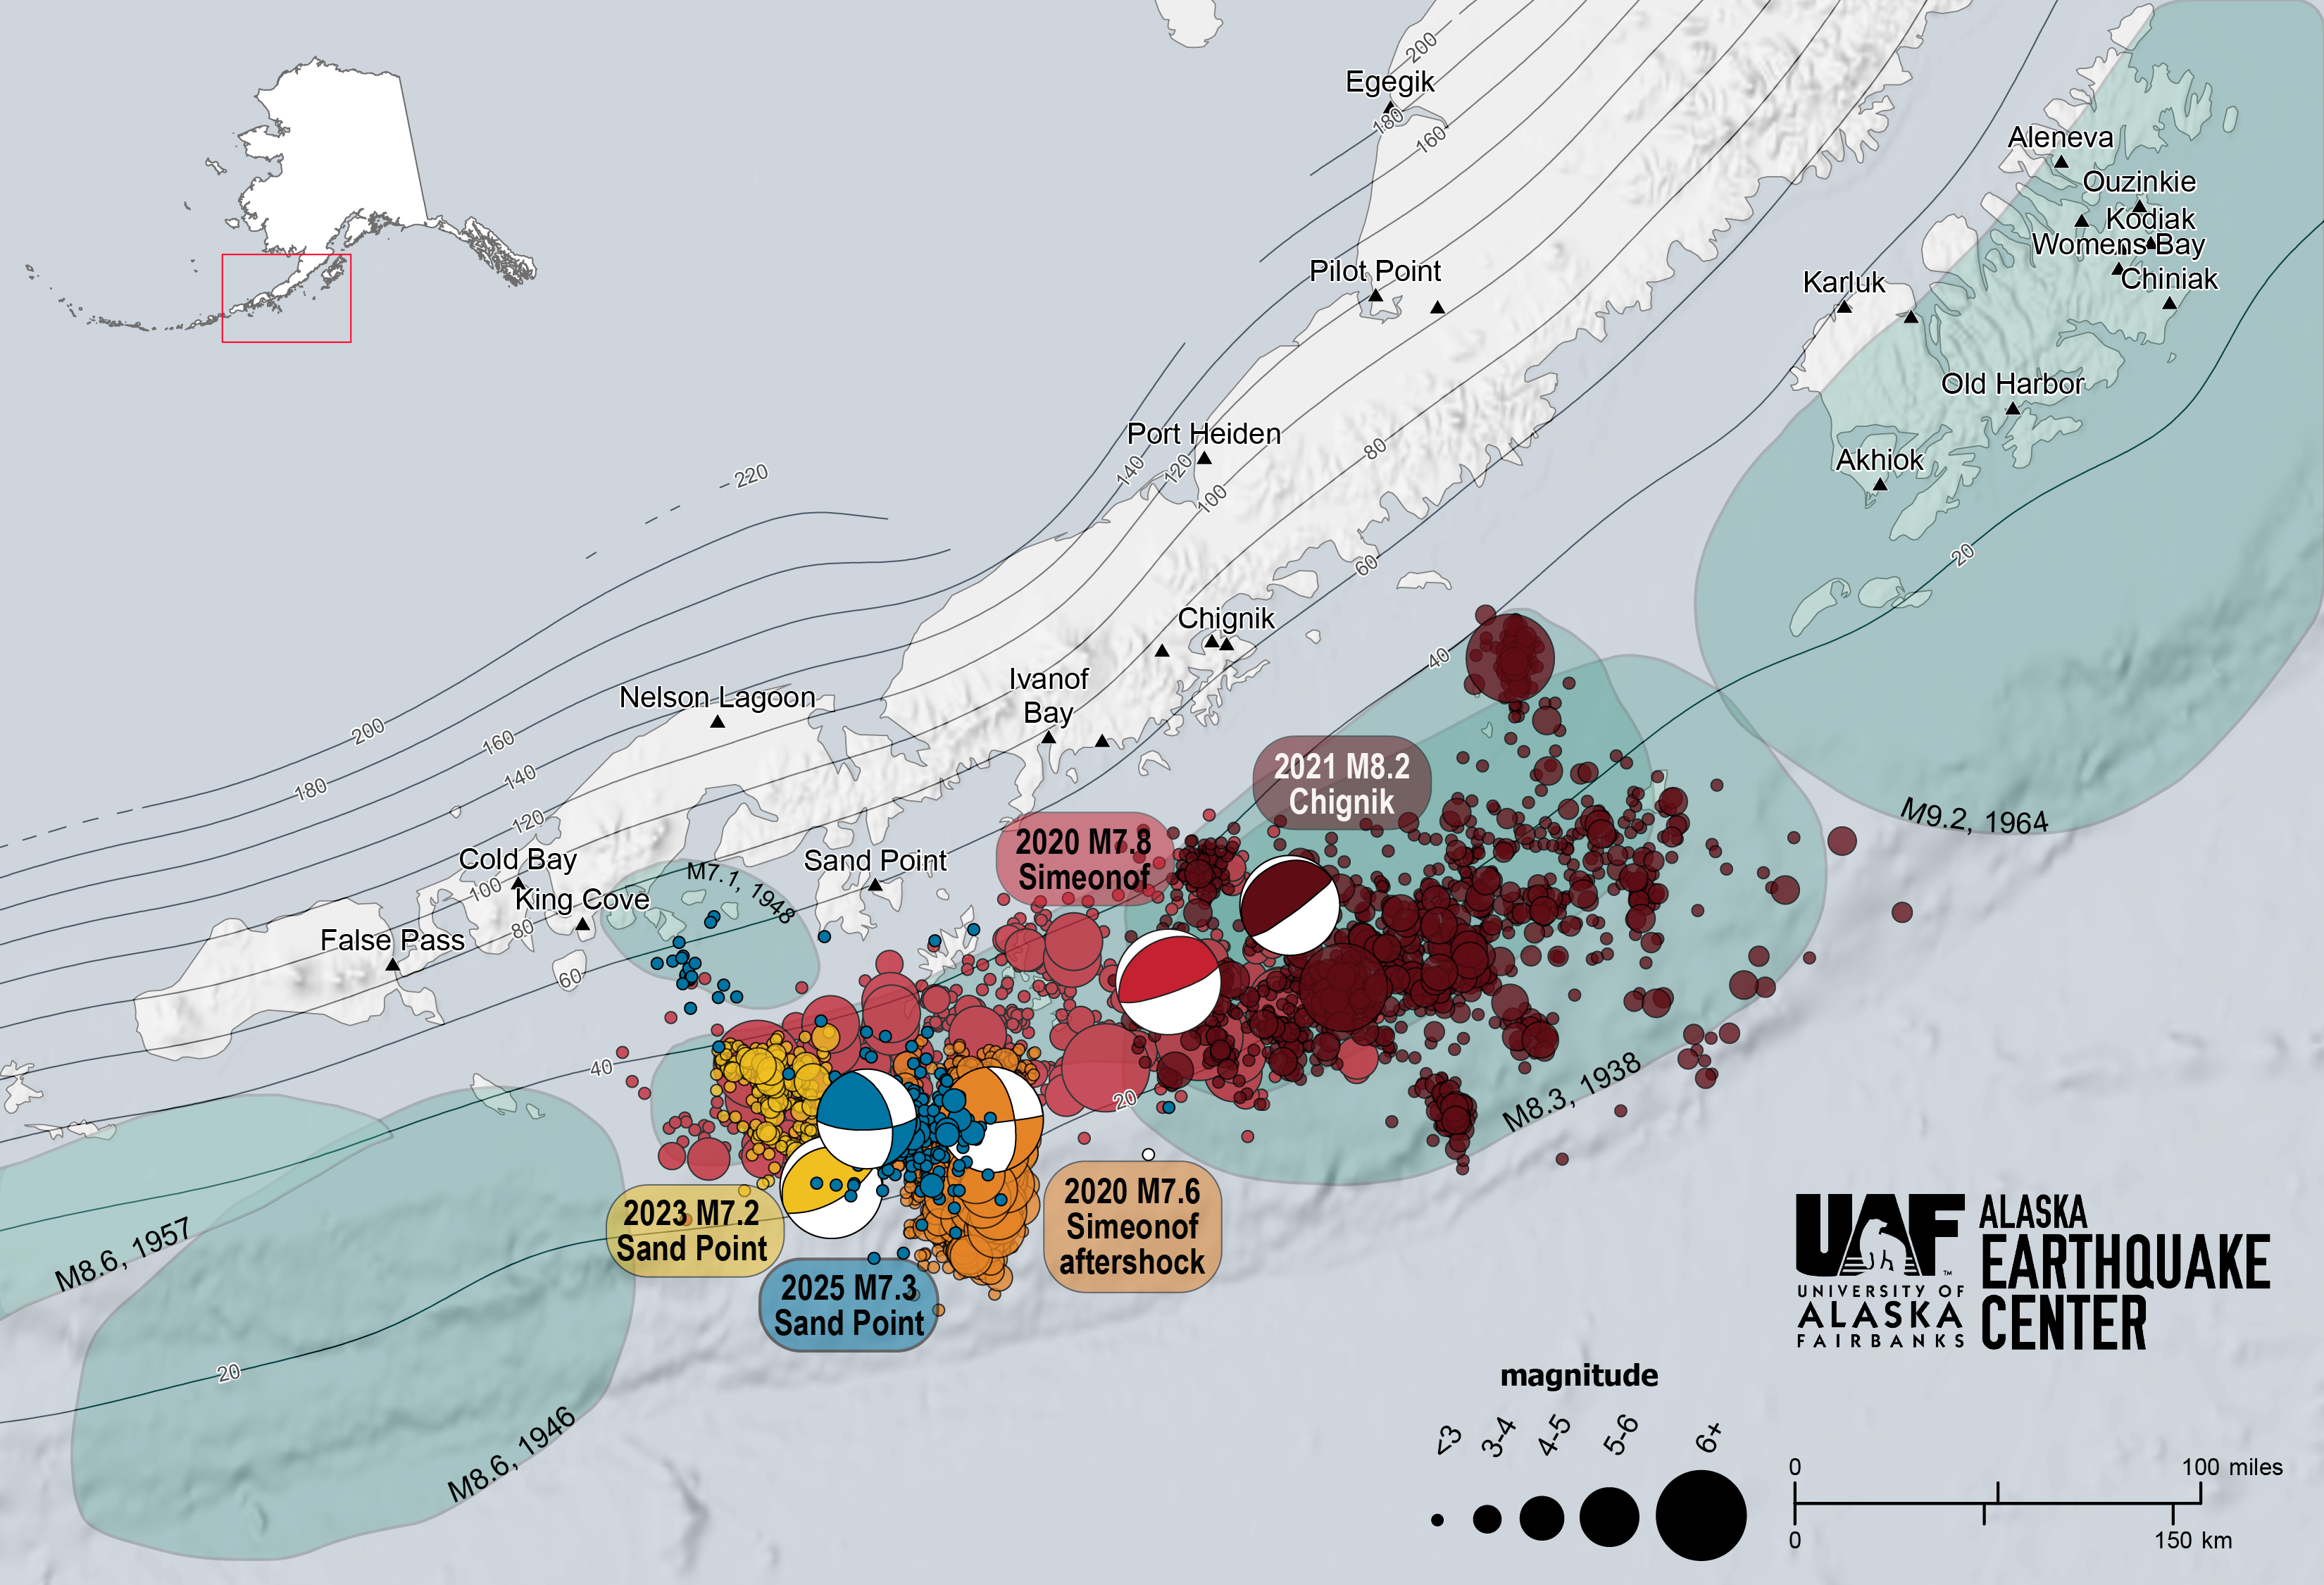
Sand Point Earthquake
Alaska’s largest earthquake of 2025 was on July 16, within a cluster of five notable earthquakes above magnitude 7 in the same spot since 2020 (Figure 5). This earthquake generated a tsunami warning, and several communities practiced their tsunami readiness, although no notable tsunami resulted. The Alaska Earthquake Center is working to add Sand Point to our growing collection of communities with which we produce tsunami safety brochures (in collaboration with Alaska’s Division of Geological and Geophysical Surveys and Division of Homeland Security and Emergency Management). This quake also allowed Earthquake Center scientist Alex Fozkos to test his modeling of alert times from a feasible earthquake early warning system. If such a system was active in Alaska, alerts could have given communities 10–50 seconds to take protective actions before significant shaking from the event arrived.
As of the writing of this story, the first increment of funding to begin the expansion of the U.S. Geological Survey ShakeAlert® program into Alaska was announced.
Thanksgiving, and 6–7
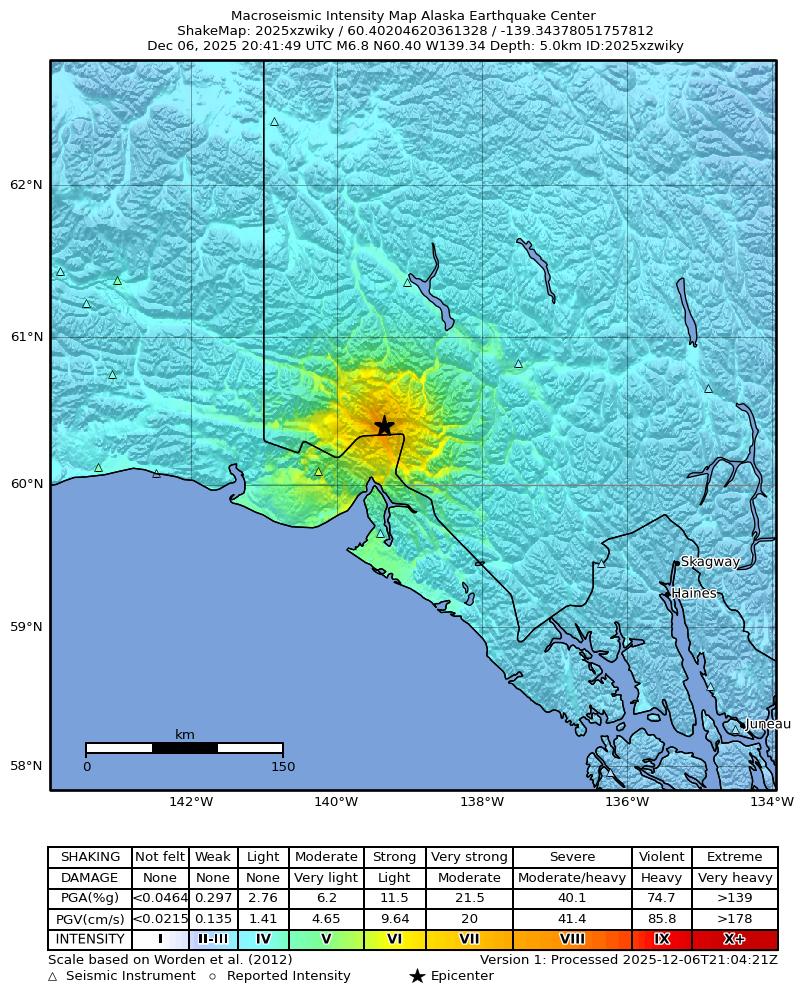
A look back at 2025 events would be incomplete without mentioning a Thanksgiving Day magnitude 6 near Susitna (Figure 6), and the December 6, magnitude 7 (who will remember the 6–7 trend a year from now?) quake under Hubbard Glacier (Figure 7).
While none of Alaska’s significant 2025 earthquakes and other seismic events caused notable damage to people or structures, they reminded us of our state’s potential to do so. Our ability to monitor the seismic hazards of the state is enabled by a robust network of seismic instruments.
Stay tuned for next week’s field highlights of 2025.